. 2022 May;605(7909):349-356.
doi: 10.1038/s41586-022-04642-z. Epub 2022 Apr 27.

TLR7 gain-of-function genetic variation causes human lupus

Affiliations

TLR7 gain-of-function genetic variation causes human lupus

Grant J Brown et al. Nature. 2022 May.

Abstract

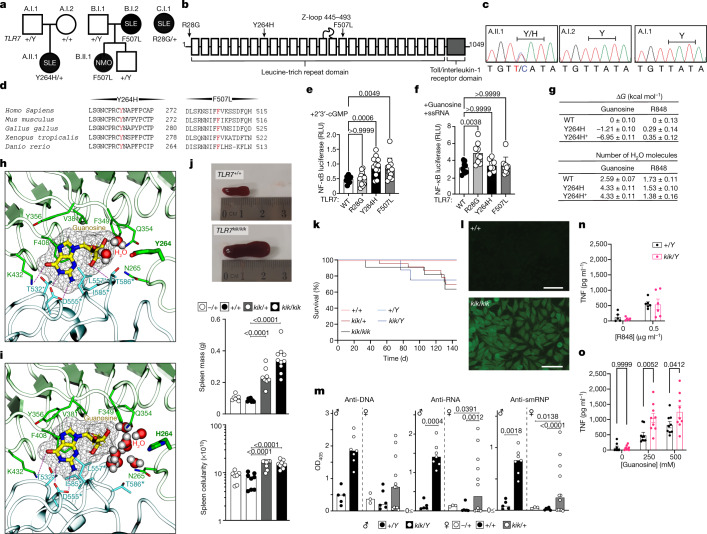
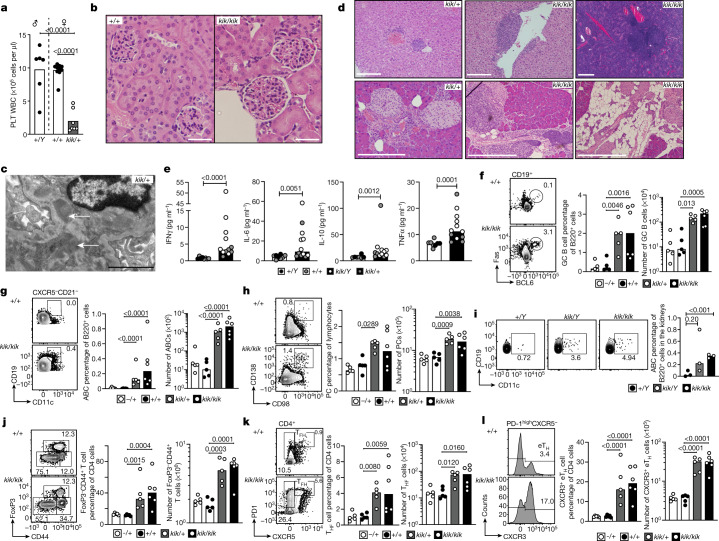
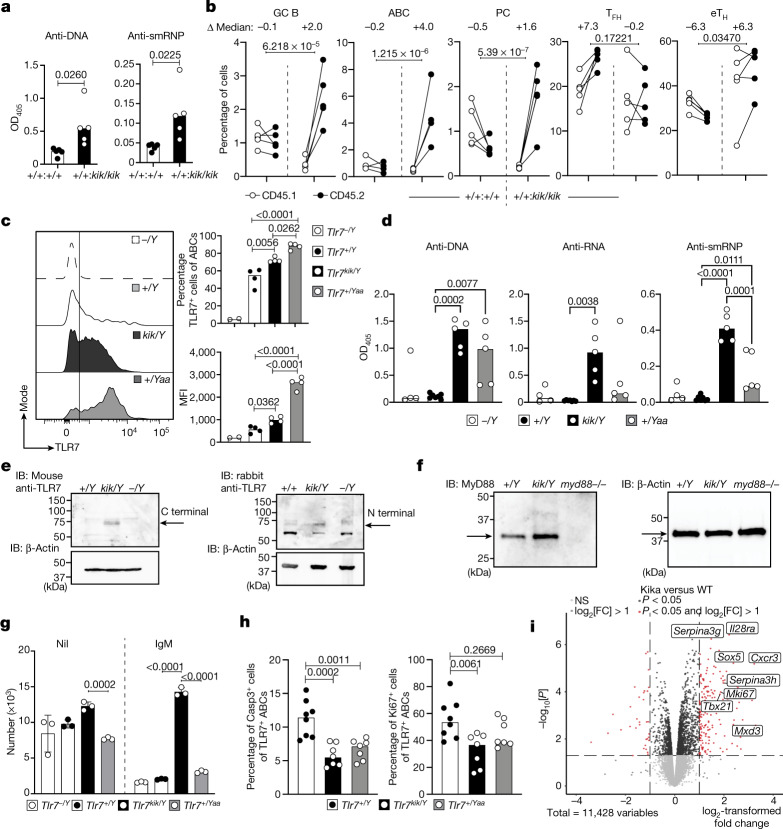
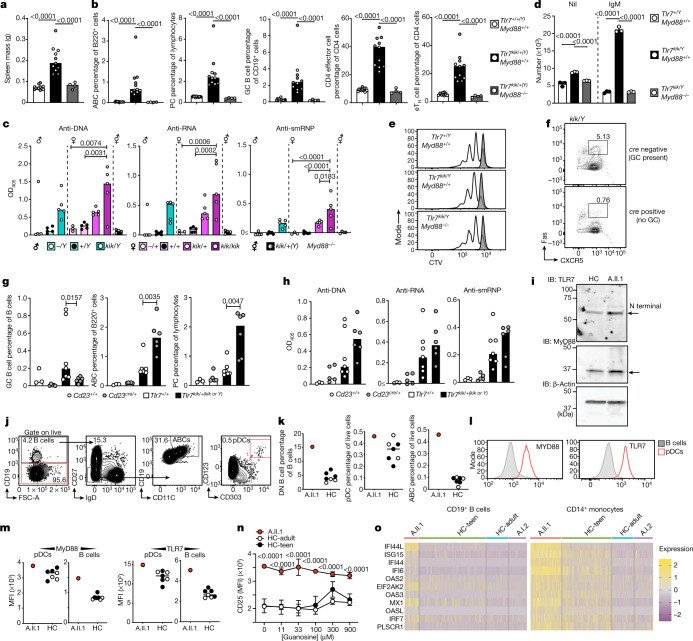
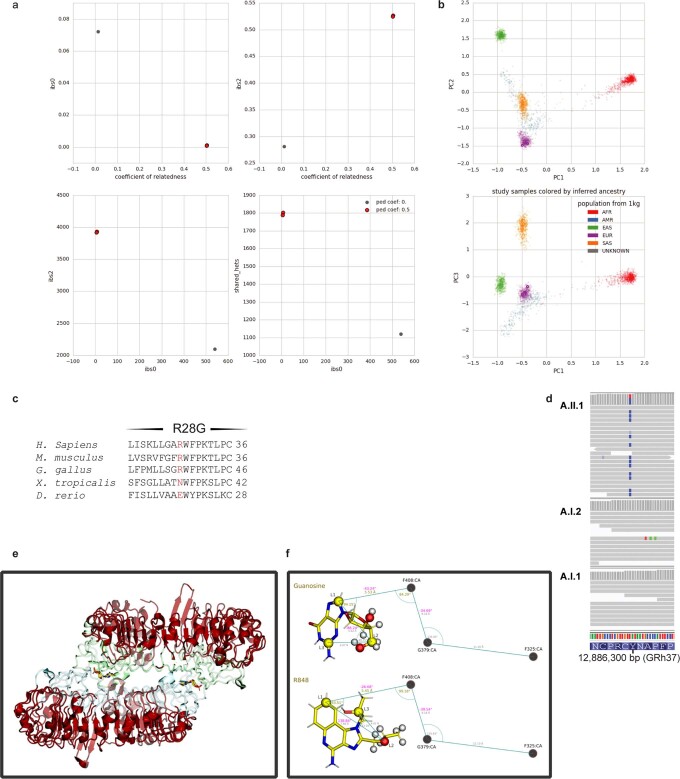
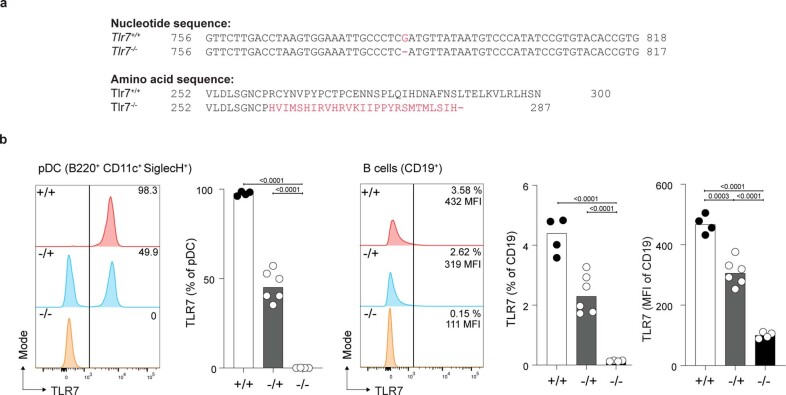
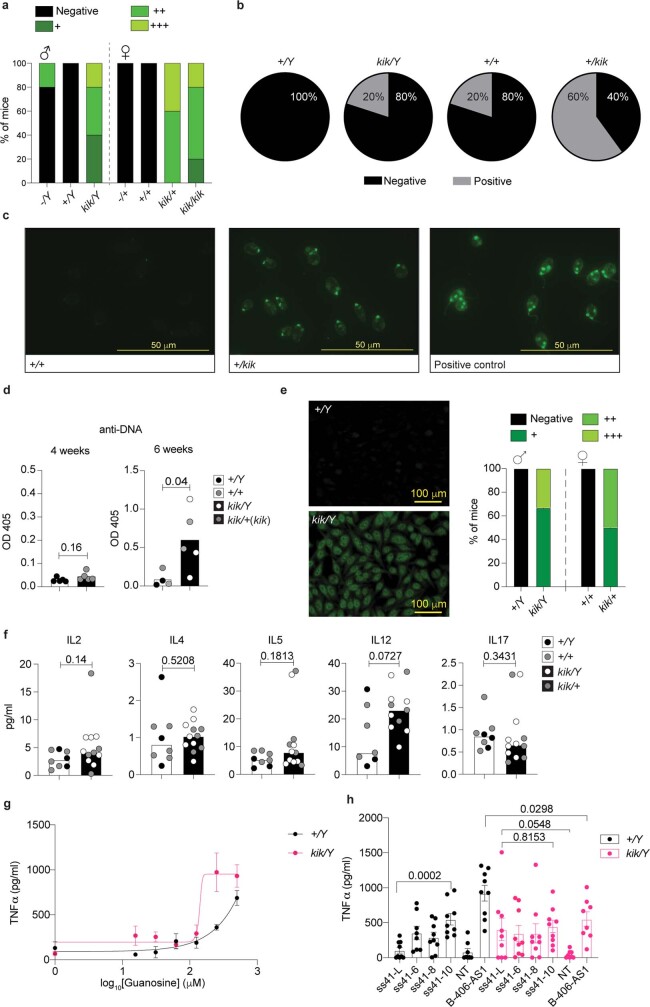
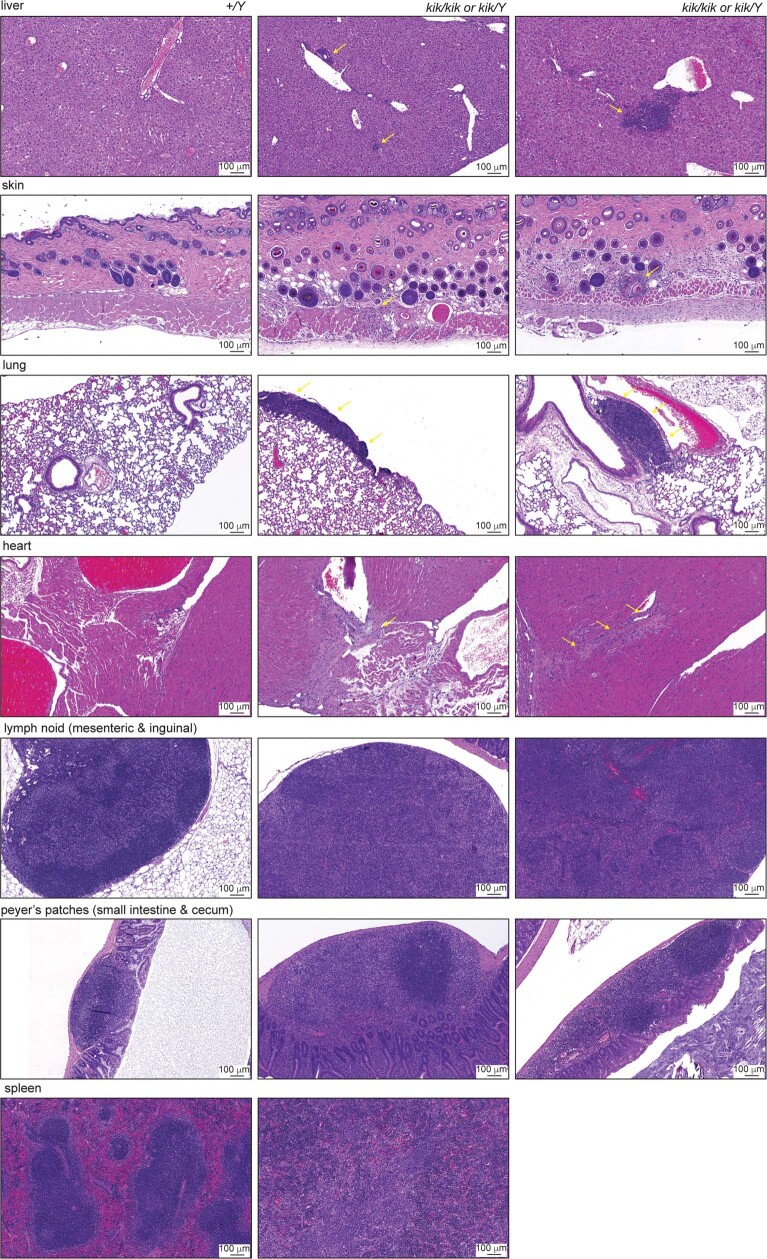
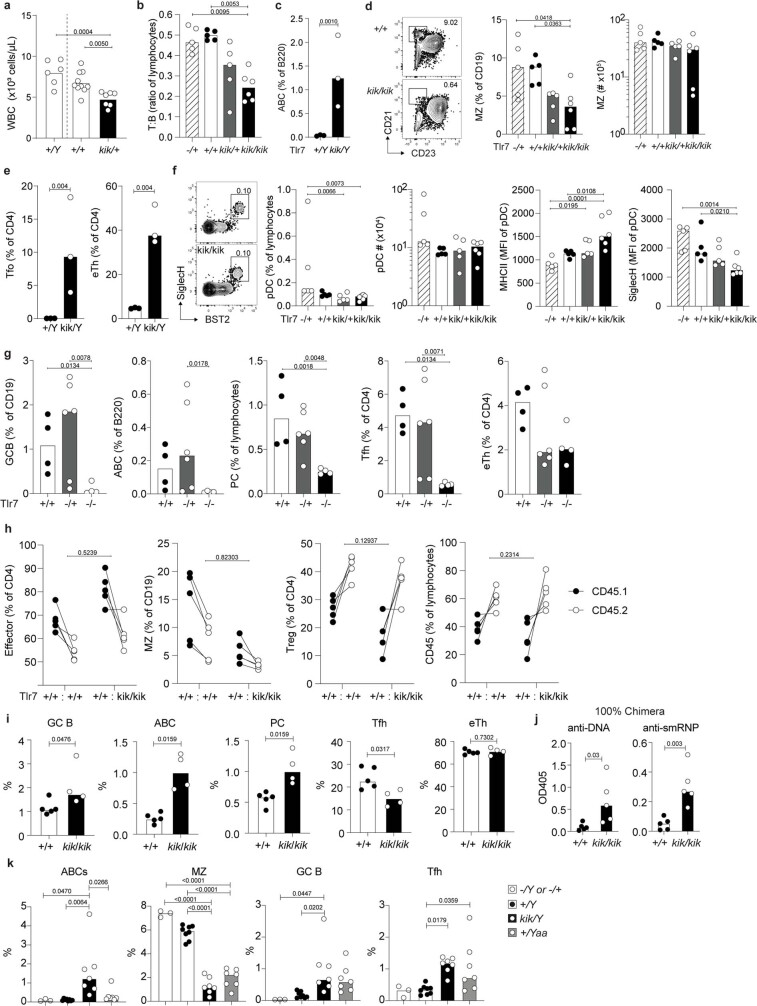
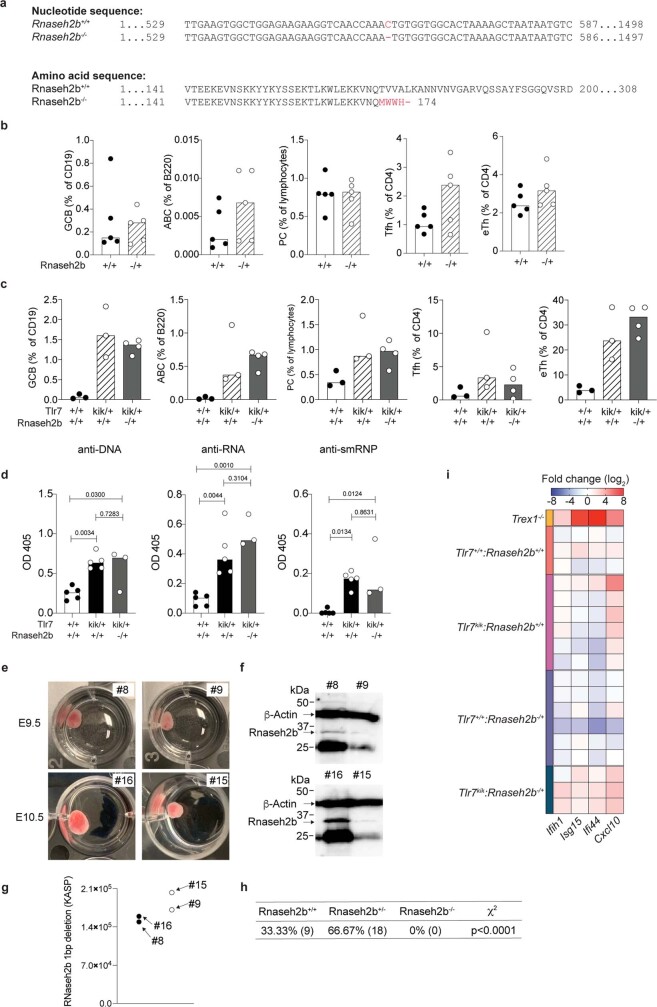
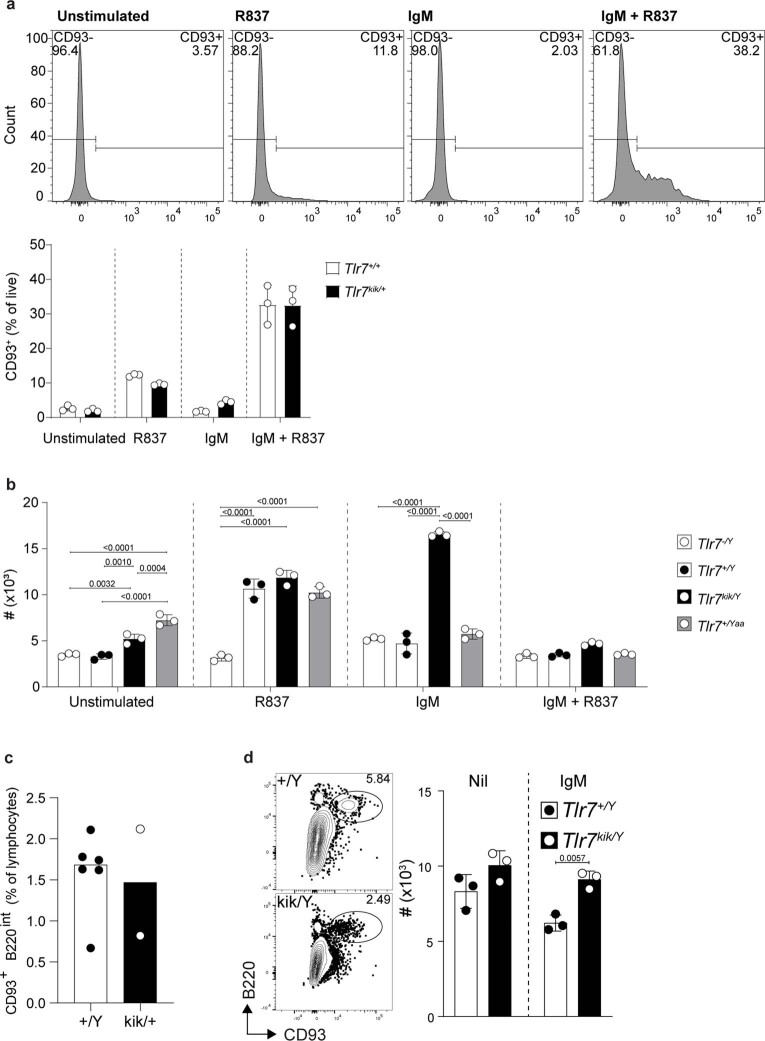
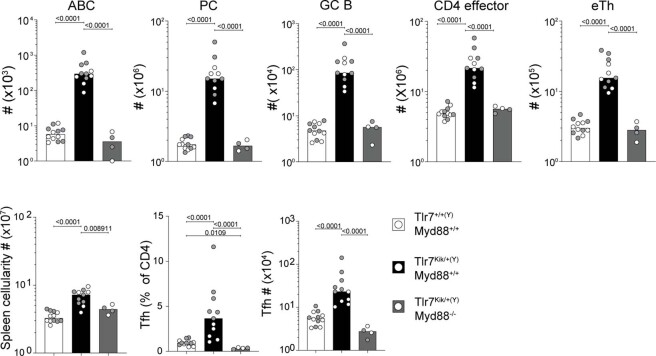
Although circumstantial evidence supports enhanced Toll-like receptor 7 (TLR7) signalling as a mechanism of human systemic autoimmune disease1-7, evidence of lupus-causing TLR7 gene variants is lacking. Here we describe human systemic lupus erythematosus caused by a TLR7 gain-of-function variant. TLR7 is a sensor of viral RNA8,9 and binds to guanosine10-12. We identified a de novo, previously undescribed missense TLR7Y264H variant in a child with severe lupus and additional variants in other patients with lupus. The TLR7Y264H variant selectively increased sensing of guanosine and 2',3'-cGMP10-12, and was sufficient to cause lupus when introduced into mice. We show that enhanced TLR7 signalling drives aberrant survival of B cell receptor (BCR)-activated B cells, and in a cell-intrinsic manner, accumulation of CD11c+ age-associated B cells and germinal centre B cells. Follicular and extrafollicular helper T cells were also increased but these phenotypes were cell-extrinsic. Deficiency of MyD88 (an adaptor protein downstream of TLR7) rescued autoimmunity, aberrant B cell survival, and all cellular and serological phenotypes. Despite prominent spontaneous germinal-centre formation in Tlr7Y264H mice, autoimmunity was not ameliorated by germinal-centre deficiency, suggesting an extrafollicular origin of pathogenic B cells. We establish the importance of TLR7 and guanosine-containing self-ligands for human lupus pathogenesis, which paves the way for therapeutic TLR7 or MyD88 inhibition.


Conflict of interest statement

M.P.G. is working with Pharmorage Pty on the therapeutic development of TLR7 inhibitors. The other authors declare no competing interests.

Figures

Fig. 1
Fig. 1. TLR7 variants in patients and mice with systemic autoimmunity and ligand-binding modelling.
a, b, TLR7 variants in families (a) and within protein domains (b). c, Sanger sequencing results. d, Conservation. e, f, NF-κB activity (ratio of NF-κB firefly to Renilla luciferase relative light units (RLU)) after human TLR7 plasmid transfection into RAW264.7 cells treated with 2′,3′-cGMP (e) or guanosine plus ssRNA (f). Data are mean and s.d. n = 12 biological replicates or transfections shown as individual dots. Statistical significance was calculated using one-way analysis of variance (ANOVA) with Bonferroni correction for multiple comparisons, compared with wild-type TLR7. g, Binding free energy (ΔG; top) of guanosine and R848 relative to wild-type (WT) TLR7 for the Y264H and Y264H+ mutants, and the number (bottom) of bound water molecules within 3.5 Å of ligand tail hydrogen and oxygen atoms. Data are mean and s.e.m. h, i, Molecular dynamics simulations showing the binding pose of guanosine to wild-type (h) and Y264H (i) TLR7. Guanosine is shown in thick liquorice with yellow carbon atoms and mesh surface. TLR7 is shown as a ribbon representation with the guanosine-interacting residues shown as sticks. Individual protomers are coloured green and blue. The dashed lines indicate hydrogen bonds. Asterisks indicate residues belonging to the other protomer. Water molecules within 5 Å of both guanosine and residue 264 are shown. j, Spleens from Tlr7+/+ and Tlr7kik/kik female mice (top). Bottom, median spleen mass and cellularity. k, The survival of kika mice. n = 12 (Tlr7+/+), n = 25 (Tlr7+/kik), n = 11 (Tlr7kik/kik), n = 11 (Tlr7+/Y), n = 7 (Tlr7kik/Y). l, Hep-2 immunofluorescence showing ANAs in 12-week-old kika mice. Representative of n > 10 mice. Scale bars, 100 µm. m, Serum antibodies to ssDNA (ANA), ssRNA and smRNP from kika mice (aged 12 weeks). OD405, optical density at 405 nm. Bars indicate median values. n, o, TNF production from mouse BMDMs treated with R848 (n) or guanosine (o). Data are mean ± s.e.m. The results represent n = 4 (j), n = 3 (e, k, mo) or n = 2 (f) experiments. Statistical analysis was performed using Tukey multiple-comparison tests (jm); and two-way ANOVA with Sidak (o). Exact P values are shown.
Fig. 2
Fig. 2. Kika mice develop autoimmune symptoms and end organ damage.
a, The platelet count in female Tlr7kik/+ mice (aged 18 weeks). b, c, Haematoxylin and eosin (H&E) staining (b) and electron microscopy analysis (c) of kidneys from kika and control mice (aged 6 months). The white arrows show immunoglobulin deposits. Scale bars, 50 µm (b) and 2 µm (c). d, H&E staining of the liver, pancreas and salivary gland from kika mice (aged 12–21 weeks). Scale bars, 100 µm (bottom left) and 200 µm (other images). e, Mesoscale measurement of cytokines in serum from wild-type (n = 8) or kika (n = 12) mice. fl, Flow cytometry plots and quantification of splenic cells from kika mice (aged 12 weeks): GC B cells (CD19+CD95+BCL6+) (f); ABCs (B220+CD21CXCR5CD19highCD11c+) (g); plasma cells (PCs; CD138+CD98+) (h); ABCs in the kidneys from kika mice (i); CD4 effector T cells (CD4+FOXP3CD44+) (j); TFH cells (CXCR5+PD1high) (k); and extrafollicular helper T cells (eTH; CD4+CXCR5PD1+CXCR3+) (l). The bars represent the median values, and each dot represents a single mouse. These results are representative of n = 4 (fh, j–l), n = 3 (b, d), or n = 2 (ai) experiments. Experiments in c were performed once with 5 mice (WT n = 2, kika n = 3) and experiments in e were performed once with serum from 20 mice. Statistical analysis was performed using one-way ANOVA with Tukey multiple-comparison test (a, fh, jl); unpaired t-tests (i); and Mann–Whitney U-tests (e). The exact P values are shown.
Fig. 3
Fig. 3. Cell-intrinsic expansion of ABCs and GC B cells in kika mice, aberrant B cell survival and extrafollicular autoimmunity induced by the Y264H variant.
a, b, Autoantibodies to DNA and smRNP in the serum (a) and cellular splenic phenotypes (b) from mixed bone marrow chimeric mice containing a 1:1 ratio of control Tlr7+/+CD45.1/Tlr7+/+ CD45.2 or Tlr7+/+CD45.1/Tlr7kik/kikCD45.2 bone marrow. c, Histogram plot and quantification of TLR7 expression in ABCs from Tlr7−/Y (n = 2), Tlr7+/Y (n = 4), Tlr7kik/Y (n = 4) and Tlr7+/Yaa (n = 4) mice. d, Autoantibodies to DNA, RNA and smRNP in the serum from Tlr7−/Y (n = 4), Tlr7+/Y(n = 7), Tlr7kik/Y(n = 5) and Tlr7+/Yaa (n = 5) mice. e, f, Western blot analysis showing splenocyte expression of TLR7 (e) and MyD88 (f) from mice of the indicated genotypes. IB, immunoblot. g, Survival of magnetic-activated cell sorting (MACS)-purified splenic B cells cultured with or without anti-IgM for 72 h from male mice of the indicated genotypes. Data are mean ± s.d. h, Quantification of apoptosis (caspase-3) and proliferation (Ki67) in ABCs from male mice (Tlr7+/Y = 8,  Tlr7kik/Y n = 7, Tlr7+/Yaa n = 7). i, Differentially expressed genes in MACS-purified splenic B cells from wild-type (n = 3) or kika (n = 3) mice cultured with anti-IgM (10 µg ml−1) for 20 h. The bars represent the median values and each dot represents a single mouse. These results are representative of n = 2 (c, e, f, h)  or n = 3 (d, g) independent experiments. Experiments in ae were performed once with n > 25 mice, and experiments in jn were performed once with n = 4 HC-teens, n = 3 HC-adults and n = 1 patient. Statistical analysis was performed using unpaired t-tests (a); one-way ANOVA with Tukey multiple-comparison test (c, d, h); and two-way ANOVA with Tukey multiple-comparison test (b, g). Exact P values are shown. NS, not significant.
Fig. 4
Fig. 4. TLR7-mediated autoimmunity is MyD88 dependent.
a, b, Spleen mass (a) and flow cytometry quantification (b) of ABCs (B220+CD21CXCR5CD19highCD11c+), plasma cells (CD138+CD98+), GC B cells (CD19+CD95+BCL6+), CD4 effector/memory T cells (CD4+FOXP3CD44+) and extrafollicular helper cells (CD4+CXCR5PD1+CXCR3+) from splenocytes of male (grey) and female (white) kika mice (aged 12 weeks) either sufficient or deficient in MyD88. c, Auto-antibodies to ssDNA (ANAs), ssRNA and smRNP from kika mice (aged 12 weeks) either deficient or sufficient in MyD88. d, e, Survival (d) and proliferation (e) of CTV-labelled splenic B cells cultured for 72 h with anti-IgM (white) or unstimulated (grey). f, g, Flow cytometry plots (f) and quantification (g) of splenic GC B cells (CD19+CD95+CXCR5+), ABCs and plasma cells from kika or control littermates (aged 10 weeks) either deficient (Bcl6flox/flox;Cd23cre) or sufficient (Bcl6flox/flox) in GCs (Cd23+/+ n = 3, Cd23cre/+ n = 5, Tlr7+/+ n = 7, Tlr7kik/+(kik or Y)= 6). h, Serum autoantibodies to ssDNA, ssRNA and smRNP in the same mice as in g. i, Western blots showing TLR7 and MyD88 expression in PBMCs from A.II.1 and an age- and gender-matched healthy control individual (HC). j, k, Flow cytometry plots (j) and quantification (k) of the DN B cell, pDC and ABC phenotype in PBMCs from healthy control individuals (n = 7) and A.II.1. l, Quantification histograms of TLR7 and MyD88 protein in healthy control individuals and A.II.1. m, Mean fluorescence intensity (MFI) of MyD88 and TLR7 protein expression in plasmacytoid dendritic cells (pDC) and B cells in healthy control individuals and A.II.1. n, Quantification of CD25 expression in CD14+ monocytes after dose stimulations with guanosine. Data are mean ± s.d. o, Type I IFN signature of healthy control individuals (HC-teen and HC-adult), A.I.2 and A.II.1. The bars represent the median values and each dot represents a single mouse. The results represent n = 2 (fi), or n = 1 (ae, ko), independent experiments. Experiments in ae were performed once with n > 25 mice, and experiments in jn were performed once with n = 4 HC-teens, n = 3 HC-adults, n = 1 patient. Statistical analysis was performed using one-way ANOVA with Tukey multiple-comparison test (ac); Mann–Whitney U-tests (g); and two-way ANOVA with Tukey multiple-comparison test (d, n). Exact P values are shown.
Extended Data Fig. 1
Extended Data Fig. 1. Confirmation of paternity in trio of proband with TLR7 de novo variant and methods for molecular modelling.
(a) Peddy diagrams used to establish relatedness. Each red dot represents a child/parent pair (child mother and child father). The grey dot is a no-relatedness control. Coefficient of relatedness should be 0.5 for a parent-child pair. ibs0: the number of sites at which the 2 samples shared no alleles (should approach 0 for parent-child pairs). ibs2: the number of sites in which the child vs parent samples where both hom-ref, both het, or both hom-alt. Shared_hets: the number of sites at which both child and parent samples were hets. (b) Ancestry check using Peddy (proband and parents are purple dots). (c) Phylogenetic conservation of TLR7 variants. (d) Integrative Genomics Viewer (IGV) image of the Y264H TLR7 de novo variant. (e) TLR7 structure 6IF5. Regions in red were restrained through all simulations with a harmonic restraint of force constant 5 kcal/mol/Å2, and correspond to residue numbers: 27-96, 116-179, 193-256, 281-297, 304-321, 327-346, 361-376, 385-403, 412-427, 434-460, 476-499, 510-523, 534-548, 561-572, 591-602, 616-625, 646-656, 671-681 and 699-835. (f) Guanosine and R848 illustrated with binding geometries from crystal structures 5GMF and 5GMH14. L1-L3 indicate ligand atoms used for Boresch restraints, which were restrained relative to the three depicted protein alpha carbons of residues F408, G379 and F325 (not to scale). Distances and angles in gold, and dihedrals in pink show the values for the 6DoF Boresch restraints. Additional geometric relationships between the restrained atoms, as measured from the starting structure, are shown in grey smaller print. Boresch dihedral restraints are relative to the two atoms connecting either side of the location of print. White hydrogen spheres and red oxygen spheres show the atoms used in the calculation for determining the number of waters within 3.5 Å of the tail region that each ligand interacted with.
Extended Data Fig. 2
Extended Data Fig. 2. Tlr7−/− spleen cells lack TLR7 expression.
(a) Tlr7 nucleotide and amino acid sequence in mice carrying a CRISPR/Cas9-generated deletion (Tlr7−/−) and WT littermate (Tlr7+/+). (b) Flow cytometric histograms of intracellular TLR7 expression on cells from 6-month-old mice of the indicated genotypes: plasmacytoid dendritic cells (pDC, CD19 CD11c+ SiglecH+ BST2+) and CD19+ B cells. Bars represent medians and each dot a single mouse. These results are representative of one experiment. One-way ANOVA with Tukey (b); Exact p values are shown.
Extended Data Fig. 3
Extended Data Fig. 3. Autoantibodies to ssDNA but not dsDNA are a feature of kika mice and are detectable by 6 wks of age.
(a) Quantification of ANAs in 12 wk-old kika mice by Hep-2 immunofluorescence (IF). (b) Proportion of 6 month-old WT and kika mice positive for dsDNA according to Crithidia luciliae IF, and representative images (c) for each genotype. (d) Autoantibodies to DNA in serum from 4 wk-old (n = 10) and 6 wk-old (n = 9) wt or kika mice. (e) HEp-2 IF showing pattern and quantification of ANAs in 6 wk-old kika mice. (f) Mesoscale measurement of cytokines in serum from wt or kika mice (n = 20). (g) Dose-dependent response of TLR7 to guanosine (data averaged from two mice in biological triplicate). (h) Responsiveness of TLR7 to ssRNAs lacking uridine (ss41-L), with 6 to 10 uridines; or 9 uridines B-406-AS1 (data represent mean ± s.e.m. averaged from three mice in biological triplicates). Unpaired t-test (d, h); Mann-Whitney test (f). Exact p values are shown.
Extended Data Fig. 4
Extended Data Fig. 4. Organ Pathology of kika mice.
Observational report is summarized in supplementary table 4. Organs were collected from 3 mice per genotype. Histopathology and organ pathology was performed by the Australian Phenomics Network (APN).
Extended Data Fig. 5
Extended Data Fig. 5. Cellular phenotypes in blood and spleen from kika mice, TLR7-deficient mice, mixed chimeras and Yaa mice.
(a) White blood cell (WBC) count in 18-wk old mice. (b, c) Flow cytometric plots and quantification. (b) Spleen T (CD3+):B (B220+) cell ratio from 12-wk old kika mice. (c) Age-associated B cells (ABC, B220+ CD21 CD23 CD19hi CD11c+) in blood from 18-wk-old kika mice. (d) Splenic marginal zone (MZ) B cells (CD19+ CD23 CD21+) in 12-wk kika mice. (e) Circulating T follicular cells (Tfo, CD4+ CXCR5+ PD1hi) and extrafollicular helper T cells (eTH, CD4+ CXCR5 PD1+ CXCR3+) in blood from 18-wk-old kika mice. (f) Plasmacytoid dendritic cellc (pDCs, CD3 CD19 MHCII+ CD11c+ CD11b- CD8 SiglecH+ BST2+) and pDC MFI of MHCII and SiglecH from 12-week-old kika mice. (g) Splenic germinal center B cells (GCB, CD19+ CD95+ BCL6+), ABC (B220+ CD21 CXCR5 CD19hi CD11c+), TFH (CD4+ CXCR5+ PD1hi), eTH (CD4+ CXCR5 PD1+ CXCR3+) and plasma cells (PC, CD138+ CD98+) from 24-wk TLR7-deficient mice. (h, i) Splenic cell subsets from mixed bone marrow chimeric mice containing a 1:1 ratio of control Tlr7+/+ CD45.1/Tlr7+/+ CD45.2 or Tlr7+/+ CD45.1/Tlr7kik/kik CD45.2 bone marrow (h) and 100% mixed bone marrow (i) of each genotype. Subsets shown are CD4 effector (CD4+ FoxP3 CD44+), MZ (CD19+ CD23 CD21+), Treg (CD4+ FoxP3+) and CD45.1 to CD45.2 reconstitution ratio, 22-weeks post-reconstitution. (j) Autoantibodies to DNA and smRNP in serum from 100% chimeric mice model. (k) Splenic cell subsets from kika and Yaa mice. Bars represent medians and each dot a single mouse. These results are representative of one blood ADVIA analysis, two experiments for blood flow cytometry, four splenic phenotyping for kika mice and one for TLR7 deletion mice, and one experiment for chimera analysis. One-way ANOVA with Tukey (ag, k); Two-way ANOVA (h); Mann-Whitney (i); Unpaired t-test (j); Exact p values are shown.
Extended Data Fig. 6
Extended Data Fig. 6. Rnaseh2b hemizygosity does not cause a cellular phenotype.
(a) Rnaseh2b cDNA sequence from Rnaseh2b-deletion mice, highlighting the single nucleotide CRISPR/Cas9-generated deletion leading to a frame-shift after amino acid residue Q170 and stop codon 4 amino acids downstream. (b, c) Flow cytometric quantification of splenic germinal center B cells (GCB, CD19+ CD95+ BCL6+), age-associated B cells (ABC, B220+ CD21 CXCR5 CD19hi CD11c+), T follicular helper cells (TFH, CD4+ CXCR5+ PD1hi), extrafollicular helper T cells (eTH, CD4+ CXCR5 PD1+ CXCR3+) and plasma cells (PC, CD138+ CD98+) (b) in 12 week-old mice carrying a heterozygous deletion in Rnaseh2b and (c) in 12-wk-old mice with heterozygous deletion in Rnaseh2b crossed to the kika mice. (d) Autoantibodies to DNA, RNA and smRNP in serum from mice of indicated genotypes. (e) Representative photo of time-mated embryos from Rnaseh2b−/+ breeders. (f) Western blot of RNASEH2B in time-mated embryo lysates. (g) KASP genotyping results of representative time-mated embryos. (h) Breeding record of Rnaseh2b−/+ crossed to Rnaseh2b−/+ mice. (i) Type 1 IFN signature of Rnaseh2b+/− Tlr7kik/+ double heterozygous female mice compared to Tlr7kik/+ alone, Rnaseh2b+/− alone or Trex1−/− mice as positive controls. Bars represent medians and each dot a single mouse. Data is representative of two experiments. Embryos were collected from two time-mating breeding set ups (n = 18 embryo collected from two pair breeders). One-way ANOVA with Tukey (bd); Chi-square test (h); Exact p values are shown.
Extended Data Fig. 7
Extended Data Fig. 7. Kika mice have normal responses to TLR7 signalling and CD93 is expressed on TLR7 stimulated B cells.
(ac) Flow cytometric analysis of (a) Mean CD93+ cells derived from CD93 sorted splenic B cells stimulated with R837, a-IgM or R837 + a-IgM for 72-hours from kika and control mice. (b) FACS sorted bone marrow immature B cells (B220int CD93+) cultured with or without α-IgM for 72 h, from male mice of the indicated genotypes. (c) Mean survival count of MACS purified splenic B cells stimulated with R837, a-IgM or R837 + a-IgM for 72-hours from kika mice and control mice. (c) Percentage of bone marrow (BM) immature B cells (CD93+ B220int) in 12-35-wk kika and control mice. (a, b, d) Bars represent means ± s.d. and (d) each dot a single mouse. These results are representative of one experiment for CD93 upregulation and BM immature flow cytometry, four splenic B cell cultures purified using MACS bead selection and one BM analysis. Two-way ANOVA with Tukey (a, b) and Sidak (d); Exact p values are shown.
Extended Data Fig. 8
Extended Data Fig. 8. Myd88 deficiency rescues kika’s immune cell phenotype and splenic cellularity.
(a) Flow cytometric quantification of splenic cell subsets (percentage and total number) and total cellularity in 12 wk-old mice of the indicated genotypes (Tlr7+/+(Y)Myd88+/+ n = 12, Tlr7kik/+(Y)Myd88+/+ n = 11, Tlr7kik/+(Y)Myd88−/− n = 4). Subsets include: germinal center B cells (GCB, CD19+ CD95+ BCL6+), T follicular helper cells (TFH, CD4+ CXCR5+ PD1hi), percentage of ABC (B220+, CD21, CXCR5 CD19hi CD11c+), extrafollicular helper cells (eTH, CD4+ CXCR5 PD1+ CXCR3+), plasma cells (PC, CD138+ CD98+), CD4 effector/memory T cells (CD4+ FoxP3 CD44+) Male mice = grey and female mice = white. Bars represent medians and each dot a single mouse. One-way ANOVA with Tukey; Exact p values are shown.
Extended Data Fig. 9
Extended Data Fig. 9. TLR7 and MYD88 expression is indistinguishable between female patients with SLE and healthy controls (HC).
(a) Flow cytometric analysis and quantification of DN B cells, pDCs and ABCs phenotype in PBMCs from healthy controls (n = 6) and female patients with SLE (n = 8). (b) Quantification of TLR7 and MYD88 protein in HC and SLE. (c) Quantification of CD25 expression after TLR7 stimulation among HC (n = 8), autoimmune control (AC) (n = 1), age-matched autoimmune control (AMAC) (n = 1) and A.II.1 (n = 1). Unpaired t-test (a, b); One-way ANOVA with Tukey (c); Exact p values are shown.

Comment in

References

    1. Jenks SA, et al. Distinct effector B cells induced by unregulated Toll-like receptor 7 contribute to pathogenic responses in systemic lupus erythematosus. Immunity. 2018;49:725–739. doi: 10.1016/j.immuni.2018.08.015. - DOI - PMC - PubMed
    1. dos Santos BP, et al. TLR7/8/9 polymorphisms and their associations in systemic lupus erythematosus patients from Southern Brazil. Lupus. 2012;21:302–309. doi: 10.1177/0961203311425522. - DOI - PubMed
    1. Shen N, et al. Sex-specific association of X-linked toll-like receptor 7 (TLR7) with male systemic lupus erythematosus. Proc. Natl Acad. Sci. USA. 2010;107:15838–15843. doi: 10.1073/pnas.1001337107. - DOI - PMC - PubMed
    1. Wang C-M, et al. Genetic variations in Toll-like receptors (TLRs 3/7/8) are associated with systemic lupus erythematosus in a Taiwanese population. Sci. Rep. 2014;4:3792. doi: 10.1038/srep03792. - DOI - PMC - PubMed
    1. Pisitkun P, et al. Autoreactive B cell responses to RNA-related antigens due to TLR7 gene duplication. Science. 2006;312:1669–1672. doi: 10.1126/science.1124978. - DOI - PubMed