. 2022 May;605(7909):285-290.
doi: 10.1038/s41586-022-04664-7. Epub 2022 Apr 27.

A global reptile assessment highlights shared conservation needs of tetrapods

Affiliations

A global reptile assessment highlights shared conservation needs of tetrapods

Neil Cox et al. Nature. 2022 May.

Abstract

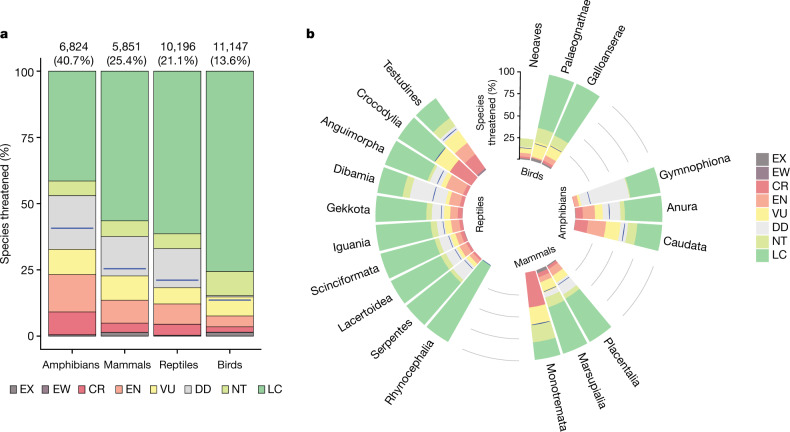
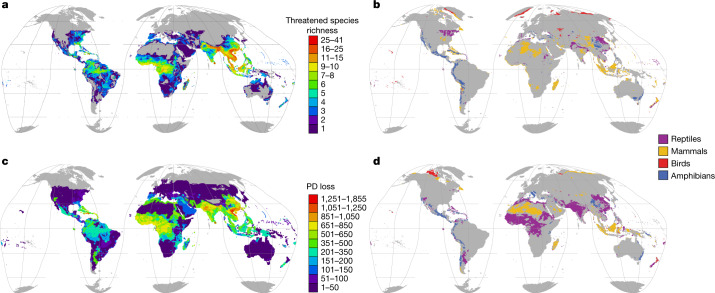
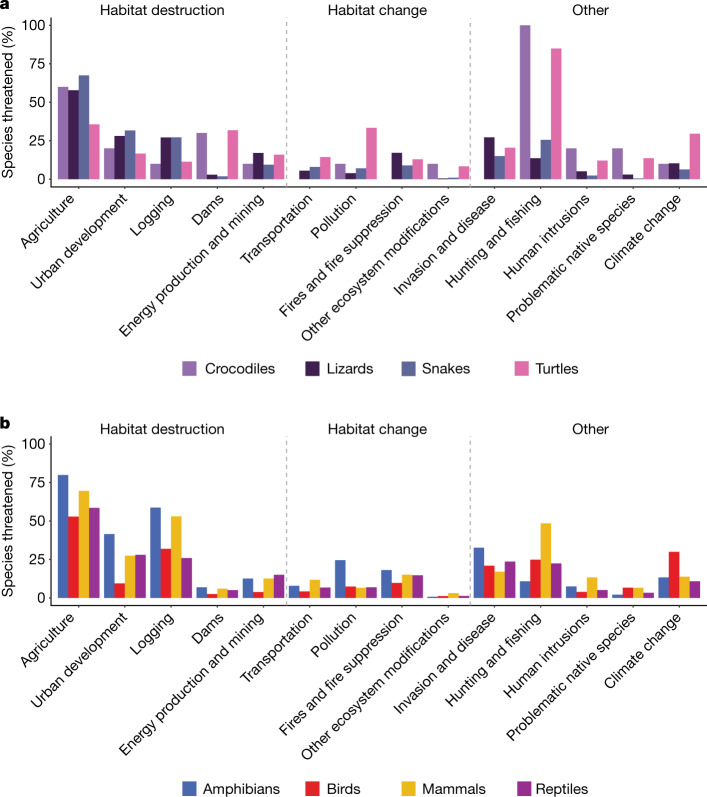
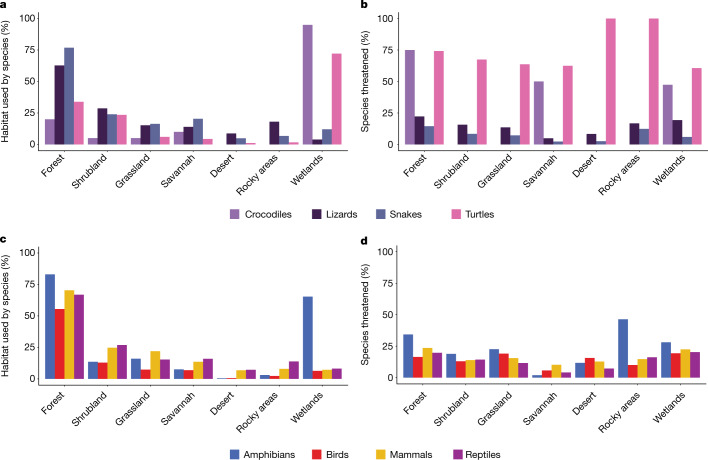
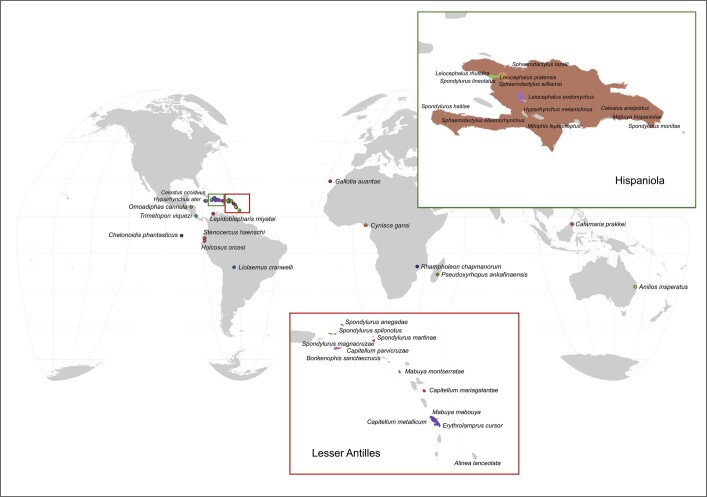
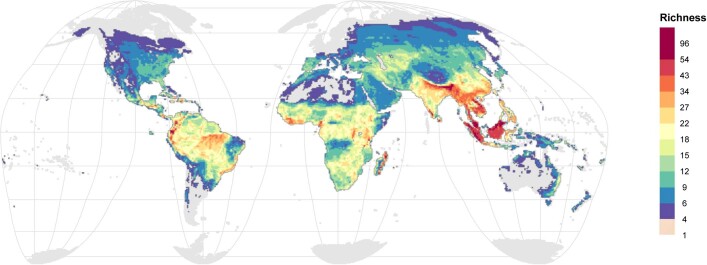
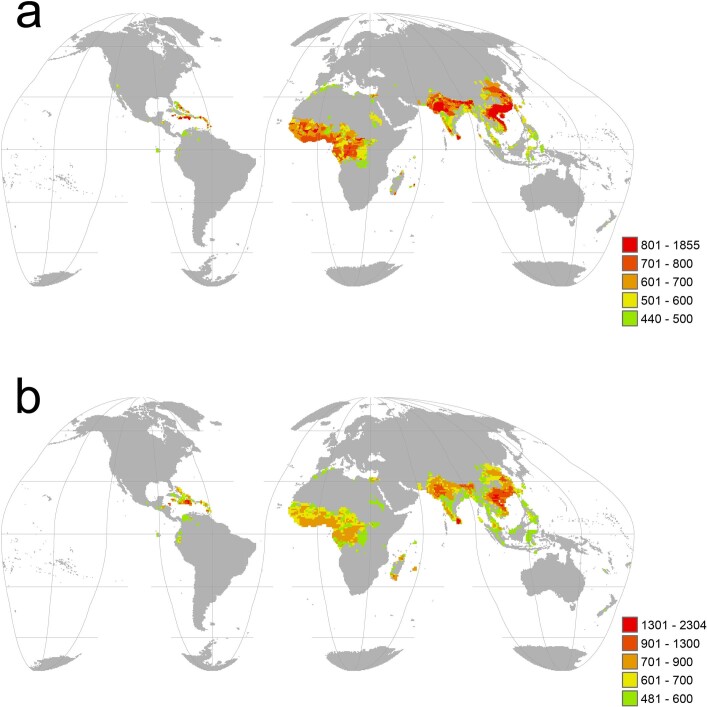
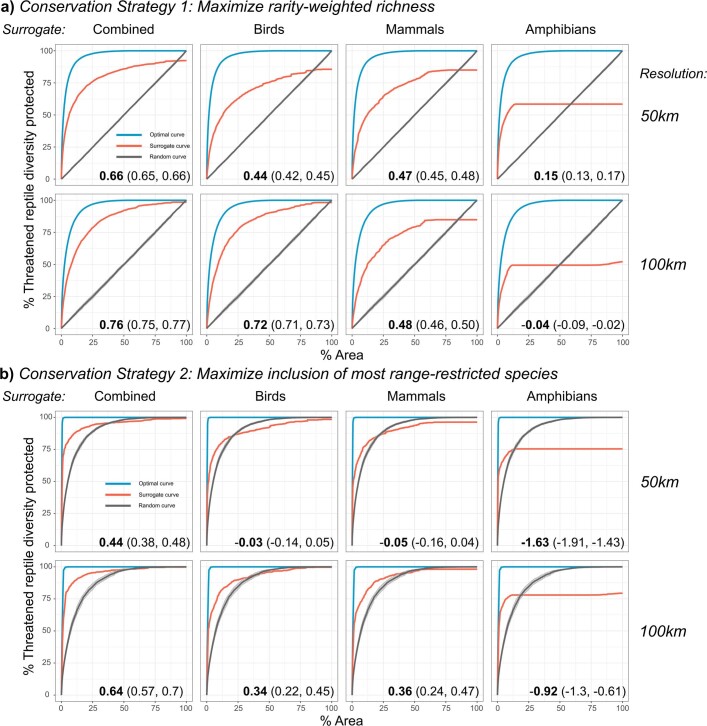
Comprehensive assessments of species' extinction risks have documented the extinction crisis1 and underpinned strategies for reducing those risks2. Global assessments reveal that, among tetrapods, 40.7% of amphibians, 25.4% of mammals and 13.6% of birds are threatened with extinction3. Because global assessments have been lacking, reptiles have been omitted from conservation-prioritization analyses that encompass other tetrapods4-7. Reptiles are unusually diverse in arid regions, suggesting that they may have different conservation needs6. Here we provide a comprehensive extinction-risk assessment of reptiles and show that at least 1,829 out of 10,196 species (21.1%) are threatened-confirming a previous extrapolation8 and representing 15.6 billion years of phylogenetic diversity. Reptiles are threatened by the same major factors that threaten other tetrapods-agriculture, logging, urban development and invasive species-although the threat posed by climate change remains uncertain. Reptiles inhabiting forests, where these threats are strongest, are more threatened than those in arid habitats, contrary to our prediction. Birds, mammals and amphibians are unexpectedly good surrogates for the conservation of reptiles, although threatened reptiles with the smallest ranges tend to be isolated from other threatened tetrapods. Although some reptiles-including most species of crocodiles and turtles-require urgent, targeted action to prevent extinctions, efforts to protect other tetrapods, such as habitat preservation and control of trade and invasive species, will probably also benefit many reptiles.


Conflict of interest statement

The authors declare no competing interests.

Figures

Fig. 1
Fig. 1. Taxonomic patterns of extinction risk in tetrapods.
a, Taxonomic patterns organized by class. The numbers above each column refer to the numbers and percentages of species threatened (that is, those categorized as critically endangered, endangered or vulnerable). b, Extinction risk by major taxonomic groups. Blue lines indicate the best estimate of the percentage of species threatened. CR, critically endangered; DD, data deficient; EN, endangered; EW, extinct in the wild; EX, extinct; LC, least concern; NT, near threatened; VU, vulnerable. Source data
Fig. 2
Fig. 2. Geographical patterns of threat in reptiles and other tetrapods in terrestrial regions.
a, Distribution of reptile species that are threatened (critically endangered, endangered or vulnerable). b, Regions with disproportionate numbers of threatened species for each tetrapod class (areas for each class where the proportional threat in species diversity is at least twice the loss for the next-most threatened class). c, Loss of reptile phylogenetic diversity (PD) if all threatened species became extinct. d, Regions with disproportionate phylogenetic diversity loss for each tetrapod class (calculated as in b). Grey, areas with no threatened species (a, c) or regions in which no class is disproportionately threatened (b, d). Data are shown at a resolution of 50 km.
Fig. 3
Fig. 3. Threats to reptiles and other tetrapods.
a, Crocodiles, lizards (including amphisbaenians), snakes and turtles. b, All tetrapods. Only threats to species categorized as critically endangered, endangered or vulnerable were included. Some species are subject to more than one threat (mean = 2.4; s.d.  = 1.3 threats per species). Source data
Fig. 4
Fig. 4. Habitat use by reptiles and other tetrapods.
a, Habitats used by crocodiles, lizards (includes amphisbaenians), snakes and turtles. b, Percentage of reptiles using each habitat that are threatened. c, Habitats used by tetrapods. d, Percentage of threatened tetrapod species using each habitat. See Supplementary Table 3 for additional, rarely used habitats not shown here. Artificial habitats are not shown. Source data
Extended Data Fig. 1
Extended Data Fig. 1. Locations of critically endangered (possibly extinct) reptiles.
Colours depict individual species’ ranges. These species were classified as critically endangered (possibly extinct) (CR(PE)) at the time of their assessments. Fortunately, a few species such as Rhampholeon chapmanorum have been recorded subsequent to their assessment publication dates and will no longer be classified as CR(PE) once they are reassessed in the future.
Extended Data Fig. 2
Extended Data Fig. 2. Richness of threatened (CR, EN, VU) tetrapods (50-km resolution).
As in Fig. 2a, only threatened species occurring in terrestrial areas are shown.
Extended Data Fig. 3
Extended Data Fig. 3. Areas with the top 15% of PD loss if all threatened reptiles become extinct.
a, 50-km resolution, b, 100-km resolution.
Extended Data Fig. 4
Extended Data Fig. 4. Species Accumulation Index (SAI) values and curves for surrogacy. analysis.
Effectiveness of threatened birds, mammals, and amphibians – individually or combined – as a surrogate for the conservation of threatened reptile species diversity for two alternative strategies – a, Conservation Strategy 1: Maximize rarity-weighted richness, b, Conservation Strategy 2: Maximize inclusion of most range-restricted species. See Methods for full explanation of each strategy. Surrogate effectiveness is measured using the Species Accumulation Index (SAI): values range from −∞ to 1, with 1 indicating perfect surrogacy, values between 1 and 0 indicate positive surrogacy, 0 indicating no surrogacy, and values less than 0 indicating negative surrogacy. In each panel, median SAI values are in bold, with lower and upper confidence intervals in brackets. Blue lines are the optimal curves (accumulation of target diversity based on target priority areas); red lines are the surrogate curves (accumulation of target diversity based on surrogate priority areas); and grey lines are the random curves (accumulation of target diversity based on random selection of areas). Confidence intervals (95%, based on 100 randomizations) shown in lighter shading around curves; most are too small to be visible.

References

    1. IPBES. Global Assessment Report on Biodiversity and Ecosystem Services (eds Brondizio, E. S. et al.) (2019).
    1. Mair L, et al. A metric for spatially explicit contributions to science-based species targets. Nat. Ecol. Evol. 2021;5:836–844. doi: 10.1038/s41559-021-01432-0. - DOI - PubMed
    1. IUCN. The IUCN Red List of Threatened Species v.2020-1 https://www.iucnredlist.org/ (2020).
    1. Tilman D, et al. Future threats to biodiversity and pathways to their prevention. Nature. 2017;546:73–81. doi: 10.1038/nature22900. - DOI - PubMed
    1. Mason N, Ward M, Watson JEM, Venter O, Runting RK. Global opportunities and challenges for transboundary conservation. Nat. Ecol. Evol. 2020;4:694–701. doi: 10.1038/s41559-020-1160-3. - DOI - PubMed