. 2022 Apr 27;71(10):2093-2106.
doi: 10.1136/gutjnl-2021-326259. Online ahead of print.

CXCR2 inhibition enables NASH-HCC immunotherapy

Affiliations

CXCR2 inhibition enables NASH-HCC immunotherapy

Jack Leslie et al. Gut. .

Abstract

Objective: Hepatocellular carcinoma (HCC) is increasingly associated with non-alcoholic steatohepatitis (NASH). HCC immunotherapy offers great promise; however, recent data suggests NASH-HCC may be less sensitive to conventional immune checkpoint inhibition (ICI). We hypothesised that targeting neutrophils using a CXCR2 small molecule inhibitor may sensitise NASH-HCC to ICI therapy.

Design: Neutrophil infiltration was characterised in human HCC and mouse models of HCC. Late-stage intervention with anti-PD1 and/or a CXCR2 inhibitor was performed in murine models of NASH-HCC. The tumour immune microenvironment was characterised by imaging mass cytometry, RNA-seq and flow cytometry.

Results: Neutrophils expressing CXCR2, a receptor crucial to neutrophil recruitment in acute-injury, are highly represented in human NASH-HCC. In models of NASH-HCC lacking response to ICI, the combination of a CXCR2 antagonist with anti-PD1 suppressed tumour burden and extended survival. Combination therapy increased intratumoural XCR1+ dendritic cell activation and CD8+ T cell numbers which are associated with anti-tumoural immunity, this was confirmed by loss of therapeutic effect on genetic impairment of myeloid cell recruitment, neutralisation of the XCR1-ligand XCL1 or depletion of CD8+ T cells. Therapeutic benefit was accompanied by an unexpected increase in tumour-associated neutrophils (TANs) which switched from a protumour to anti-tumour progenitor-like neutrophil phenotype. Reprogrammed TANs were found in direct contact with CD8+ T cells in clusters that were enriched for the cytotoxic anti-tumoural protease granzyme B. Neutrophil reprogramming was not observed in the circulation indicative of the combination therapy selectively influencing TANs.

Conclusion: CXCR2-inhibition induces reprogramming of the tumour immune microenvironment that promotes ICI in NASH-HCC.

Keywords: hepatocellular carcinoma; immunotherapy; nonalcoholic steatohepatitis.


Conflict of interest statement

Competing interests: DM is a director of Fibrofind. JL and DM are shareholders in Fibrofind limited. SB owns shares in AstraZeneca. OJS receives funding from AstraZeneca and Novartis. TGB receives research funding support from AstraZeneca. JML receives research support from Bayer HealthCare Pharmaceuticals, Eisai Inc, Bristol-Myers Squibb, Boehringer-Ingelheim and Ipsen, and consulting fees from Eli Lilly, Bayer HealthCare Pharmaceuticals, Bristol-Myers Squibb, Eisai Inc, Celsion Corporation, Exelixis, Merck, Ipsen, Genentech, Roche, Glycotest, Nucleix, Sirtex, Mina Alpha and AstraZeneca.

Figures
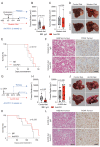
Figure 1
Figure 1
NASH-HCC is resistant to anti-PD1 immunotherapy. (A) Timeline schematic of the NASH-HCC model. (B-D) Quantification and representative images of tumour burden at day 28 post-intrahepatic injection for orthotopic HCC mice fed a control diet or western diet and treated with IgG-control or anti-PD1. (E) Survival plot in orthotopic NASH-HCC mice fed a Western diet and treated with IgG-control or anti-PD1. (F) Representative images of H&E-stained non-tumour livers and PCNA-stained tumours from orthotopic NASH-HCC mice fed a Western diet and treated with IgG-control or anti-PD1. Scale bar = 100 µm. (G) Timeline schematic for the DEN/ALIOS NASH-HCC model. (H-J) Quantification and representative images of tumour burden at day 284 for DEN mice fed a control diet or ALStreated with IgG-control or anti-PD1. (K) Survival plot in DEN/ALIOS mice treated with IgG-control or anti-PD1 (censored at day 165 post-treatment). (L) Representative images of H&E-stained non-tumour livers and PCNA-stained tumours from DEN/ALIOS mice treated with IgG-control or anti-PD1 at day 284. Scale bar = 100 µm. Dots in (B, C, H, I) represent individual mice. Significance tested using: Mann-WhitneyU-test (A, B, H, L) and Log-rank (Mantel-Cox) test (E, K). Exact p-values indicated on graph. HCC, hepatocellular carcinoma; NASH, non-alcoholic steatohepatitis; PCNA, proliferating cell nuclear antigen.
Figure 2
Figure 2
NASH-HCC and anti-PD1 resistance is associated with CXCR2+ neutrophils. (A) Quantification of Ly6G+ counts/field in non-tumour liver and tumours from IgG-control or anti-PD1 treated orthotopic NASH-HCC mice. (B) Quantification of Ly6G+ counts/field in non-tumour liver and tumours from IgG-control or anti-PD1 treated DEN/ALIOS mice. (C) Heatmap showing row-scaled expression of DEGs associated with a pro-tumour neutrophil phenotype upregulated in DEN/ALIOS TANs compared with peripheral blood and control liver neutrophils. (D) Quantification of fold change for Cxcl and Ccl chemokine transcripts between DEN/ALIOS non-tumour liver and tumour. (E) Flow cytometric quantification of CXCR2+ as a percentage of cell populations in the peripheral blood, non-tumour liver and tumour in DEN/ALIOS mice. Error bars represent Mean ± SEM. (F) Representative image of RNAscope in situ hydrisation staining of CXCR2 in DEN/ALIOS mouse tumours. Black arrowheads indicate positive infiltrating non-parenchymal cells and red arrows indicate negative tumour cells. (G-I) Quantification and representative images of CD66b+ and CXCR2+ cell counts/mm2 in non-tumour liver and tumour by IHC of non-alcoholic fatty liver disease (NAFLD)-HCC and NASH-HCC patient resected tissue. (J) Heatmap showing row-scaled expression of neutrophil-associated process networks for human NASH-HCC compared with HBV, HCV and alcohol-related HCC (non-NASH-HCC). Scale bar = 100 µm. Data are from; bulk Ly6G+ neutrophil RNA-Seq (C), bulk tissue RNA-Seq (D), bulk tumour microarray (J). Dots in (A, B, G, H) represent individual mice. Significance tested using: Two-way ANOVA with Sidak’s multiple comparisons test (A, B, G, H). Exact p-values indicated on graph. ALIOS, American lifestyle induced obesity syndrome diet; ANOVA, analysis of variance; DEN, Diethylnitrosamine; GO, gene ontology; HBV, hepatitis B virus; HCC, hepatocellular carcinoma; HCV, hepatitis C virus; IHC, immunohistochemistry; NASH, non-alcoholic steatohepatitis; TANs, tumour-associated neutrophils.
Figure 3
Figure 3
Inhibition of CXCR2+ protumour neutrophils resensitises NASH-HCC to anti-PD1 therapy. (A) Schematic for DEN/ALIOS model treatment regime. (B) Quantification of tumour burden for DEN/ALIOS mice at day 284 for each treatment arm. (C) Quantification of average mitotic body counts per tumour for DEN/ALIOS mice at day 284. (D) Quantification of tumour stage based on nuclear grading for DEN/ALIOS mice at day 284 for each treatment arm. Mean ± SEM. (E) Representative images of non-tumour liver H&E for DEN/ALIOS mice. Scale bar = 100 µm. (F) Quantification of NAFLD activity score (NAS) in the livers for DEN/ALIOS mice at day 284. G) Survival plot for DEN/ALIOS mice (censored at day 365). (H) Schematic for orthotopic NASH-HCC model treatment regime. (I) Quantification of tumour burden for the orthotopic NASH-HCC mice at day 28. (J) Survival plot in orthotopic NASH-HCC mice. One mouse censored due to non-liver related medical issue. Dots in (B, C, F, I) represent individual mice.Significance tested using: Kruskal-Wallis test with Dunn’s multiple comparisons test (B), One-Way ANOVA with Tukey multiple comparisons test (C, F, I), Log-rank (Mantel-Cox) test (G, J). Exact p-values indicated on graph. ALIOS, American lifestyle induced obesity syndrome diet; ANOVA, analysis of variance; DEN, Diethylnitrosamine; HCC, hepatocellular carcinoma; NAFLD, non-alcoholic fatty liver disease; NASH, non-alcoholic steatohepatitis.
Figure 4
Figure 4
AZD5069/anti-PD1 therapy promotes an anti-tumour immune microenvironment. (A) Quantification of CD8+ counts/field in tumours DEN/ALIOS model from each treatment arm. (B) Heatmap showing row-scaled expression of genes associated with CD8+ T cell activation and exhaustion for DEN/ALIOS treatment groups. Data are from bulk CD3+ Tumour associated T cells analysed by RNA-Seq. (C) Quantification of granzyme B+clusters in the tumours for DEN/ALIOS mice from each treatment arm at day 284 and representative images of granzyme B+ clusters in AZD5069/anti-PD1 treated mice (black arrow heads = banded neutrophils; blue arrow heads = lymphocytes). Scale bar = 100 µm. (D) Timeline schematic for the anti-CD8a depletion regime in the orthotopic NASH-HCC model. (E) Quantification of tumour burden in orthotopic NASH-HCC mice treated with AZD5069/anti-PD1 and IgG-control or anti-CD8α at day 28 post-intrahepatic injection. (F) Flow cytometric quantification of CD86 median fluorescence intensity (MFI) of intratumoural XCR1+ cDC1 cells from DEN/ALIOS mice treatment arms at day 284. (G) Timeline schematic for the DEN/ALIOS regimen and targeted therapies in mice with compound deletion of Ccr1, 2, 3, 5 knockout mice, designated iCCR. (H) Quantification of tumour burden for DEN/ALIOS mice Vehicle-treated WT and iCCR, and AZD5069/anti-PD1 treated iCCR mice at day 284. (I) Flow cytometric quantification of CD4+ and CD8+ cells as a percentage of CD3+ T cells in tumours from WT-Vehicle, iCCR-Vehicle and iCCR-AZD5069/anti-PD1 treated DEN/ALIOS mice at day 284. (J) Quantification of granzyme B+ clusters in WT and iCCR DEN/ALIOS mice treated with AZD5069/Anti-PD1 at day 284. (K) Timeline schematic for the anti-XCL1 neutralisation regime in the orthotopic NASH-HCC model. (L) Quantification of tumour burden in orthotopic NASH-HCC mice treated with vehicle control and IgG-control or AZD5069/anti-PD1 and either IgG-control or anti-XCL1 at day 28 post-intrahepatic injection. (M, N) Quantification of CD8+ and granzyme B+ counts/field in tumours of orthotopic NASH-HCC mice treated with vehicle control and IgG-control or AZD5069/anti-PD1 and either IgG-control or anti-XCL1 at day 28 post-intrahepatic injection. Dots in (A, C, E, F, H-J, L-N) represent individual mice. Significance tested using: One-Way ANOVA with Tukey multiple comparisons test (A, C, F, L, M, N), Mann-Whitney U-test (E), Two-way ANOVA with Tukey’s multiple comparisons test (I), Unpaired T-test (J). Exact p-values indicated on graph. ALIOS, American lifestyle induced obesity syndrome diet; ANOVA, analysis of variance; DEN, Diethylnitrosamine; HCC, hepatocellular carcinoma; IHC, immunohistochemistry, NASH, non-alcoholic steatohepatitis; WT, wild-type.
Figure 5
Figure 5
AZD5069/anti-PD1 therapy promotes tumour neutrophil accumulation and the formation of intratumoural immunological hubs. (A) Quantification of Ly6G+ counts/field by IHC for DEN/ALIOS mice tumours at day 284. (B) Representative images of Ly6G+ staining for DEN/ALIOS tumours in mice treated with vehicle or AZD5069/Anti-PD1. Black arrows indicate single Ly6G+ neutrophils; red arrows indicate clusters of Ly6G+ neutrophils. Scale bar = 100 µm. (C) Representative H&E from Vehicle-control and AZD5069/anti-PD1 treated mouse tumours identifying clusters of neutrophils with banded (blue arrows) and segmented (black arrows) nuclear morphology. Scale bar = 10 µm. (D) Flow cytometric quantification of NeP count/gram in non-tumour liver and tumour tissues for DEN/ALIOS mice for each treatment arm at day 284. (E) Representative intra-tumour IMC image for DEN/ALIOS mice treated with AZD5069/anti-PD1. DNA = white; MPO = blue; Ki-67 = red. n=6 mice. Scale bar = 100 µm. (F) Quantification of MPO+Ki-67+ counts/field for DEN/ALIOS tumours from IMC analysis. (G) Representative intra-tumour IMC image for DEN/ALIOS mice treated with AZD5069/anti-PD1. MPO = cyan; CD3 = yellow; MHCII = purple. Scale bar = 100 µm. (H) HistoCAT neighbourhood clustering analysis performed using phonograph clustered cell populations across all four treatment arms where red indicated a significant interaction, blue indicates a significant avoidance and white indicated no significant interaction. Each column represents the interaction of two cell types. Each row represents an individual mouse. (I) Magnified image of HistoCAT neighbourhood clustering analysis. Cluster showing specifically enriched cell-cell interactions. 7/8 cell-cell interactions characterised by antibodies used. Dots in (A, D, F) represent individual mice. Significance tested using: One-Way ANOVA with Tukey’s multiple comparisons test (A, F), Two-way ANOVA with Sidak’s multiple comparisons test (D). Exact p-values indicated on graph. ALIOS, American lifestyle induced obesity syndrome diet; ANOVA, analysis of variance; APC, antigen presenting cell; DEN, Diethylnitrosamine; HCC, hepatocellular carcinoma; IHC, immunohistochemistry, IMC, imaging mass cytometry; NASH, non-alcoholic steatohepatitis.
Figure 6
Figure 6
AZD5069/anti-PD1 combination therapy reprogrammes the TAN phenotype. (A) Heatmap showing row-scaled expression of genes associated with late and early neutrotime for DEN/ALIOS mice TANs. (B) Quantification of LTF+ counts/field by IHC for DEN/ALIOS mice tumours at­ day 284. (C) Represenative image of LTF positive neutrophils (red arrow) in the tumour of AZD5069/anti-PD1 treated DEN/ALIOS mice at day 284. Scale bar top = 100 µm, bottom = 10 µm. (D) Heatmap showing row-scaled expression of early and late neutrotime signatures for human NASH-HCC compared with HBV, HCV and alcohol-related HCC (non-NASH-HCC). In total n=237 patients analysed. (E) Heatmap showing row-scaled expression of published HCC immune class signatures; IFN, inflammation, IFNAP, Response to ICI and immune resistance as well as the late neutrotime signature for human HCC active and exhausted immune subsets. In total n=228 patients analysed. (F) Heatmap showing row-scaled expression of genes associated with late and early neutrotime signatures for DEN/ALIOS peripheral blood neutrophils and AZD5069/Anti-PD1 treated TANs. (G) Gene set enrichment analysis (GSEA) showing normalised enrichment scores for TAN process networks highly enriched in; Anti-PD1 vs Vehicle (Phagosome Antigen Presentation and Antigen Presentation), AZD5069 vs Vehicle (Neutrophil Activation and Phagocytosis), and AZD5069/Anti-PD1 vs Vehicle (G2-M). (H) Timeline schematic for neutrophil based therapy treatment regime in the orthotopic NASH-HCC model. (I) Quantification of tumour burden in orthotopic NASH-HCC mice treated with anti-PD1 and immature or mature neutrophils at day 28 post-intrahepatic injection. (J, K) Flow cytometric quantification and representative histogram plot of CD86 median fluorscent intensity (MFI) of intraturmoural XCR1+ cDC1 cells from orthotopic NASH-HCC neutrophil/anti-PD1 therapy mice at day 28. (L, M) Quantification of intratumoural CD8+ and gramzyme B+ counts/field in the tumours of orthotopic NASH-HCC neutrophil/anti-PD1 therapy mice at day 28. Data are from: Bulk DEN/ALIOS Ly6G+ TAN RNA-Seq data in (A, F, G) and bulk tumour microarray in (D, E). Dots in (B, I, J, L, M) represent individual mice. Significance tested using: One-Way ANOVA with Tukey’s multiple comparisons test (B, I, J, L, M). Exact p-values indicated on graph. ALIOS, American lifestyle induced obesity syndrome diet; ANOVA, analysis of variance; DEN, Diethylnitrosamine; HCC, hepatocellular carcinoma; IHC, immunohistochemistry; ICI, immune checkpoint inhibition; NASH, non-alcoholic steatohepatitis; TANs, tumour-associated neutrophils.

Comment in

  • CXCR2 inhibition in NASH-HCC.
    Kotsiliti E. Kotsiliti E. Nat Rev Gastroenterol Hepatol. 2022 Jul;19(7):415. doi: 10.1038/s41575-022-00637-3. Nat Rev Gastroenterol Hepatol. 2022. PMID: 35610512 No abstract available.

References

    1. Sung H, Ferlay J, Siegel RL, et al. Global cancer statistics 2020: GLOBOCAN estimates of incidence and mortality worldwide for 36 cancers in 185 countries. CA Cancer J Clin 2021;71:209–49. 10.3322/caac.21660 - DOI - PubMed
    1. Younossi Z, Stepanova M, Ong JP, et al. Nonalcoholic steatohepatitis is the fastest growing cause of hepatocellular carcinoma in liver transplant candidates. Clin Gastroenterol Hepatol 2019;17:748–55. 10.1016/j.cgh.2018.05.057 - DOI - PubMed
    1. Dyson J, Jaques B, Chattopadyhay D, et al. Hepatocellular cancer: the impact of obesity, type 2 diabetes and a multidisciplinary team. J Hepatol 2014;60:110–7. 10.1016/j.jhep.2013.08.011 - DOI - PubMed
    1. Gallage S, García-Beccaria M, Szydlowska M, et al. The therapeutic landscape of hepatocellular carcinoma. Med 2021;2:505–52. 10.1016/j.medj.2021.03.002 - DOI - PubMed
    1. Finn RS, Qin S, Ikeda M, et al. Atezolizumab plus bevacizumab in unresectable hepatocellular carcinoma. N Engl J Med 2020;382:1894–905. 10.1056/NEJMoa1915745 - DOI - PubMed