

The steatosis-associated fibrosis estimator (SAFE) score: A tool to detect low-risk NAFLD in primary care
- PMID: 35477908
- PMCID: PMC9613815
- DOI: 10.1002/hep.32545
The steatosis-associated fibrosis estimator (SAFE) score: A tool to detect low-risk NAFLD in primary care
Abstract
Background: NAFLD is common in primary care. Liver fibrosis stage 2 or higher (≥F2) increases future risk of morbidity and mortality. We developed and validated a score to aid in the initial assessment of liver fibrosis for NAFLD in primary care.
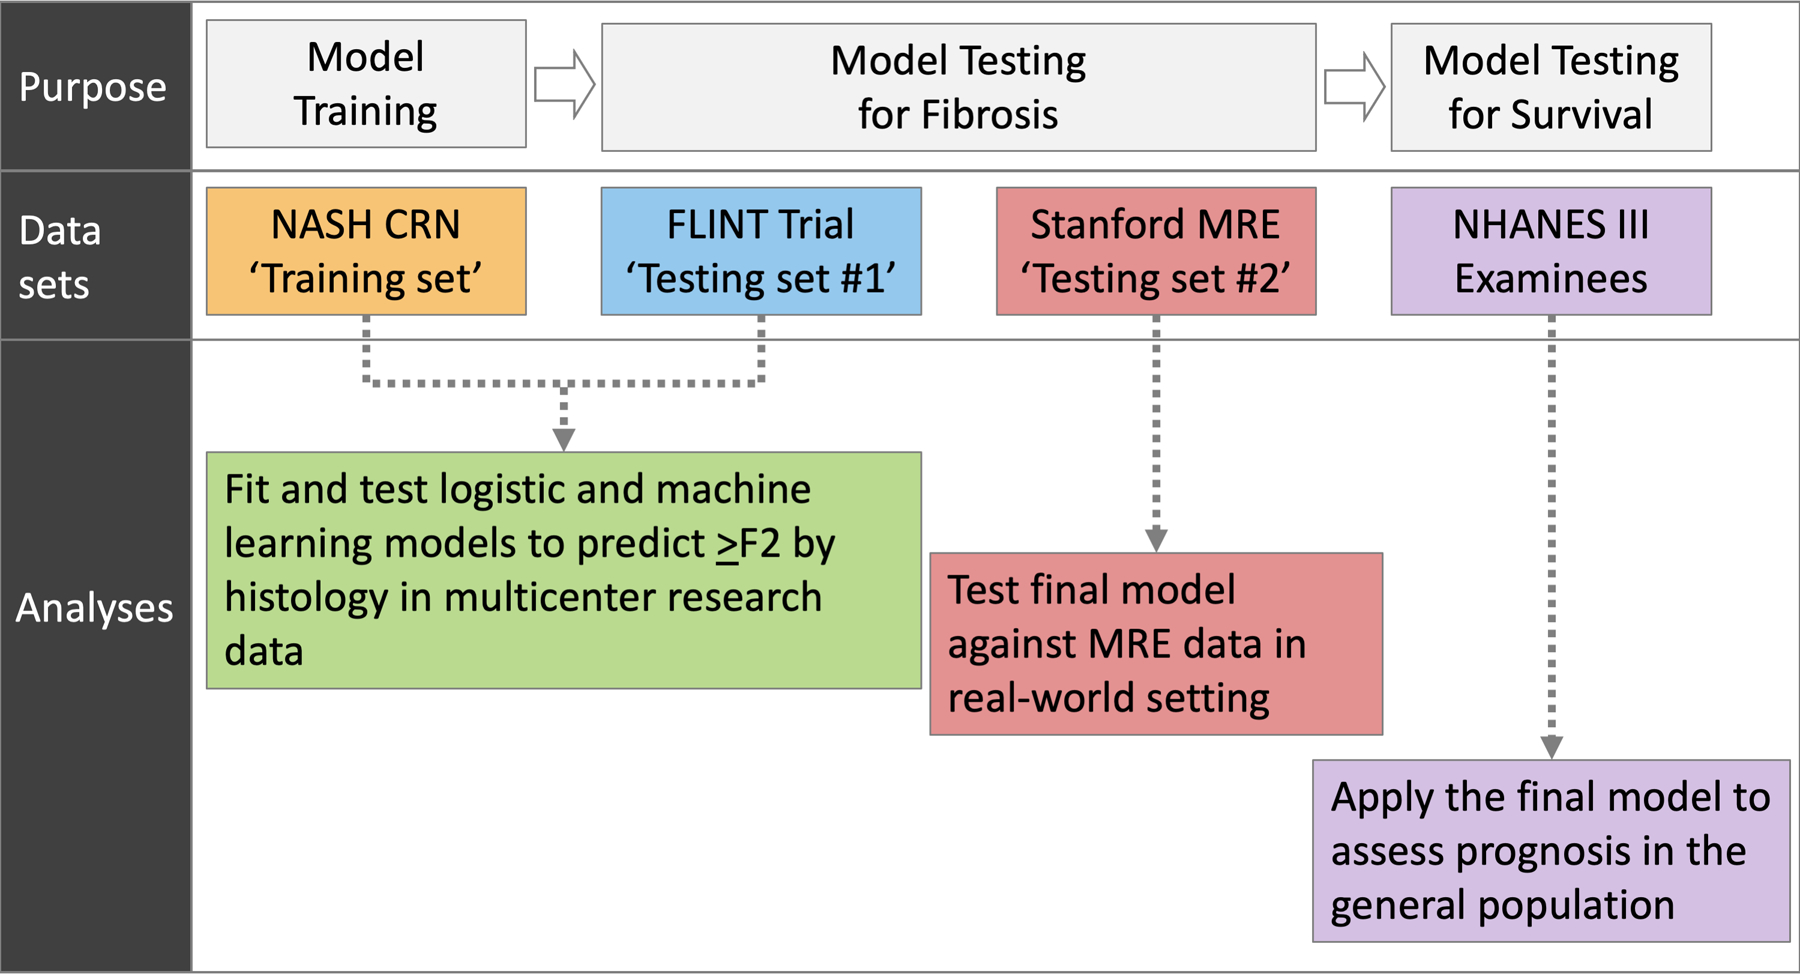
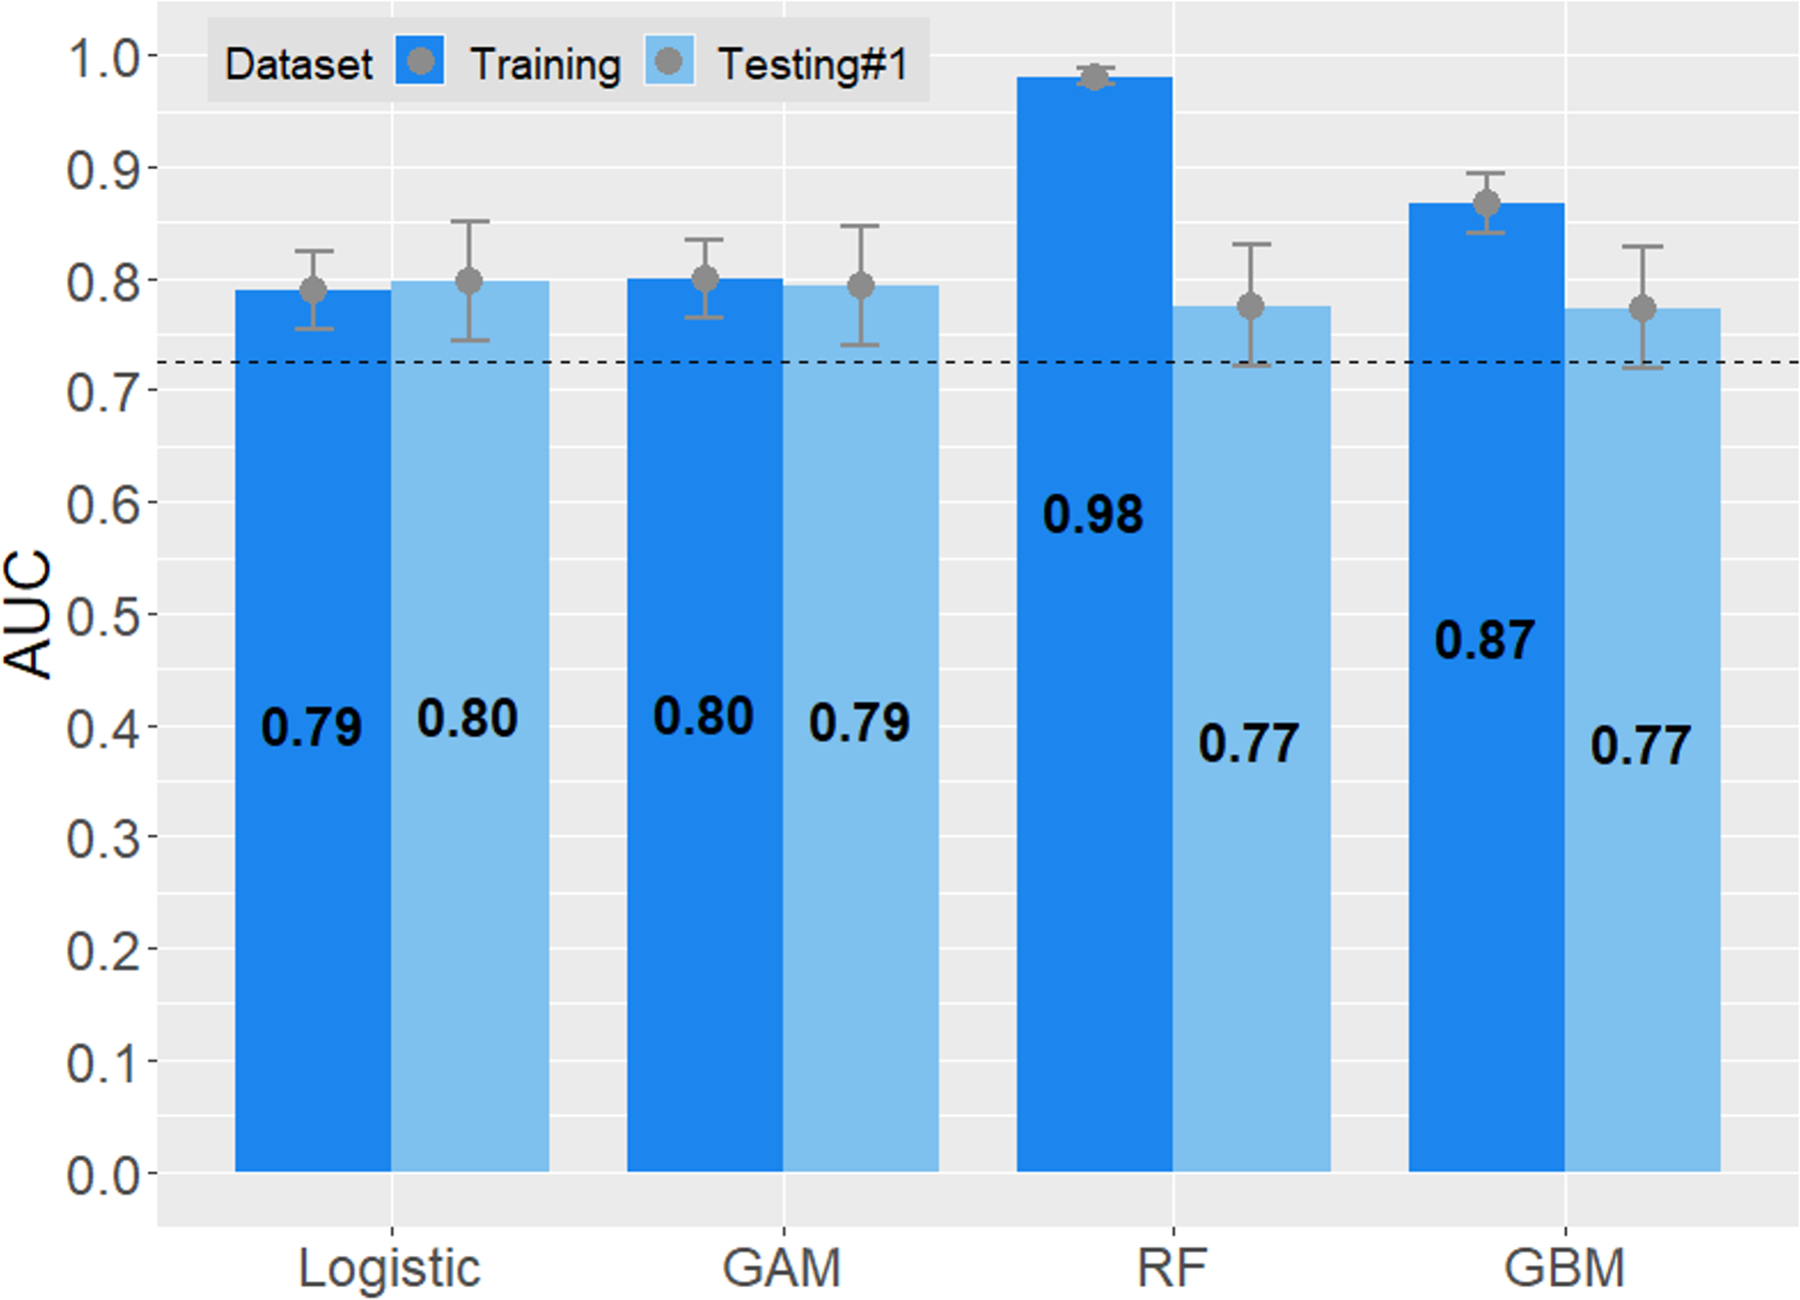
Methods: Data from patients with biopsy-proven NAFLD were extracted from the NASH Clinical Research Network observational study ( n = 676). Using logistic regression and machine-learning methods, we constructed prediction models to distinguish ≥F2 from F0/1. The models were tested in participants in a trial ("FLINT," n = 280) and local patients with NAFLD with magnetic resonance elastography data ( n = 130). The final model was applied to examinees in the National Health and Nutrition Examination Survey (NHANES) III ( n = 11,953) to correlate with long-term mortality.
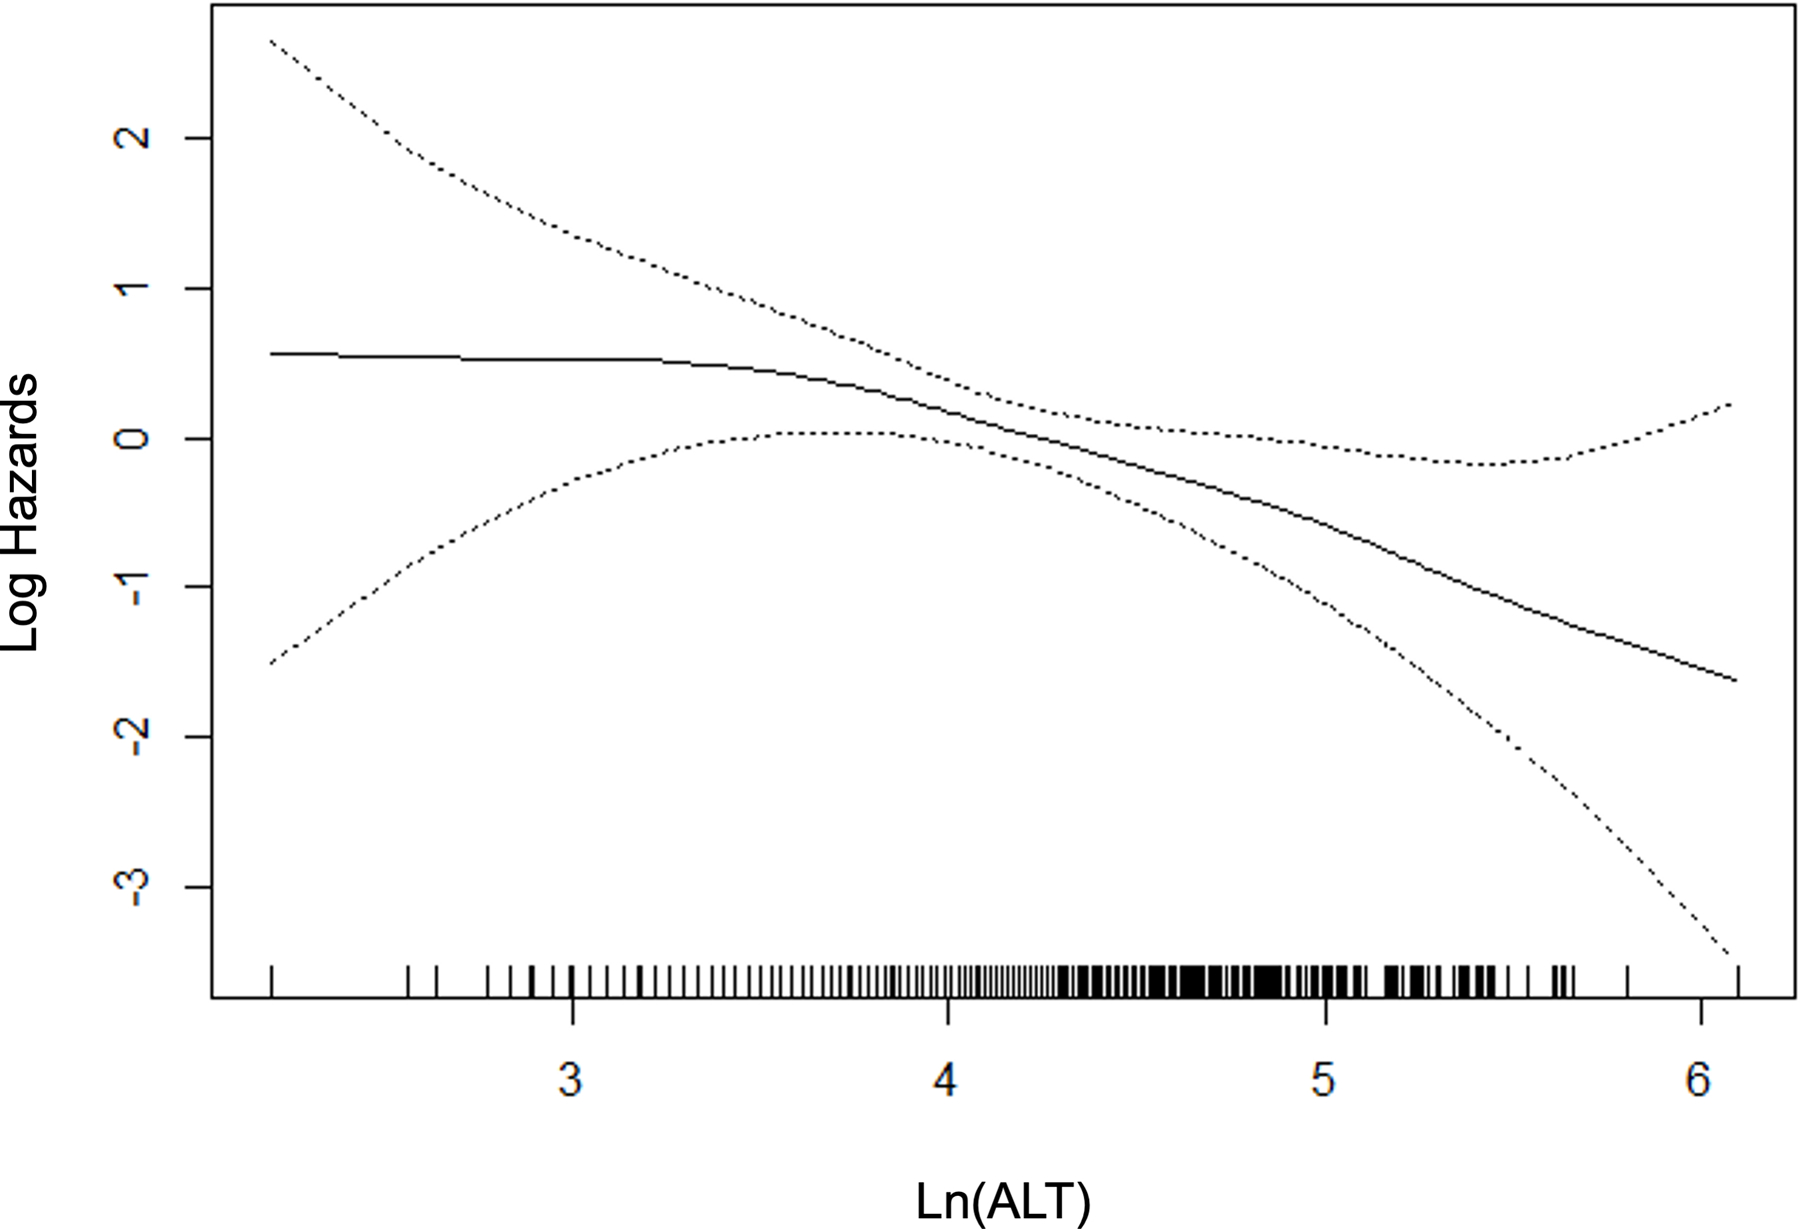
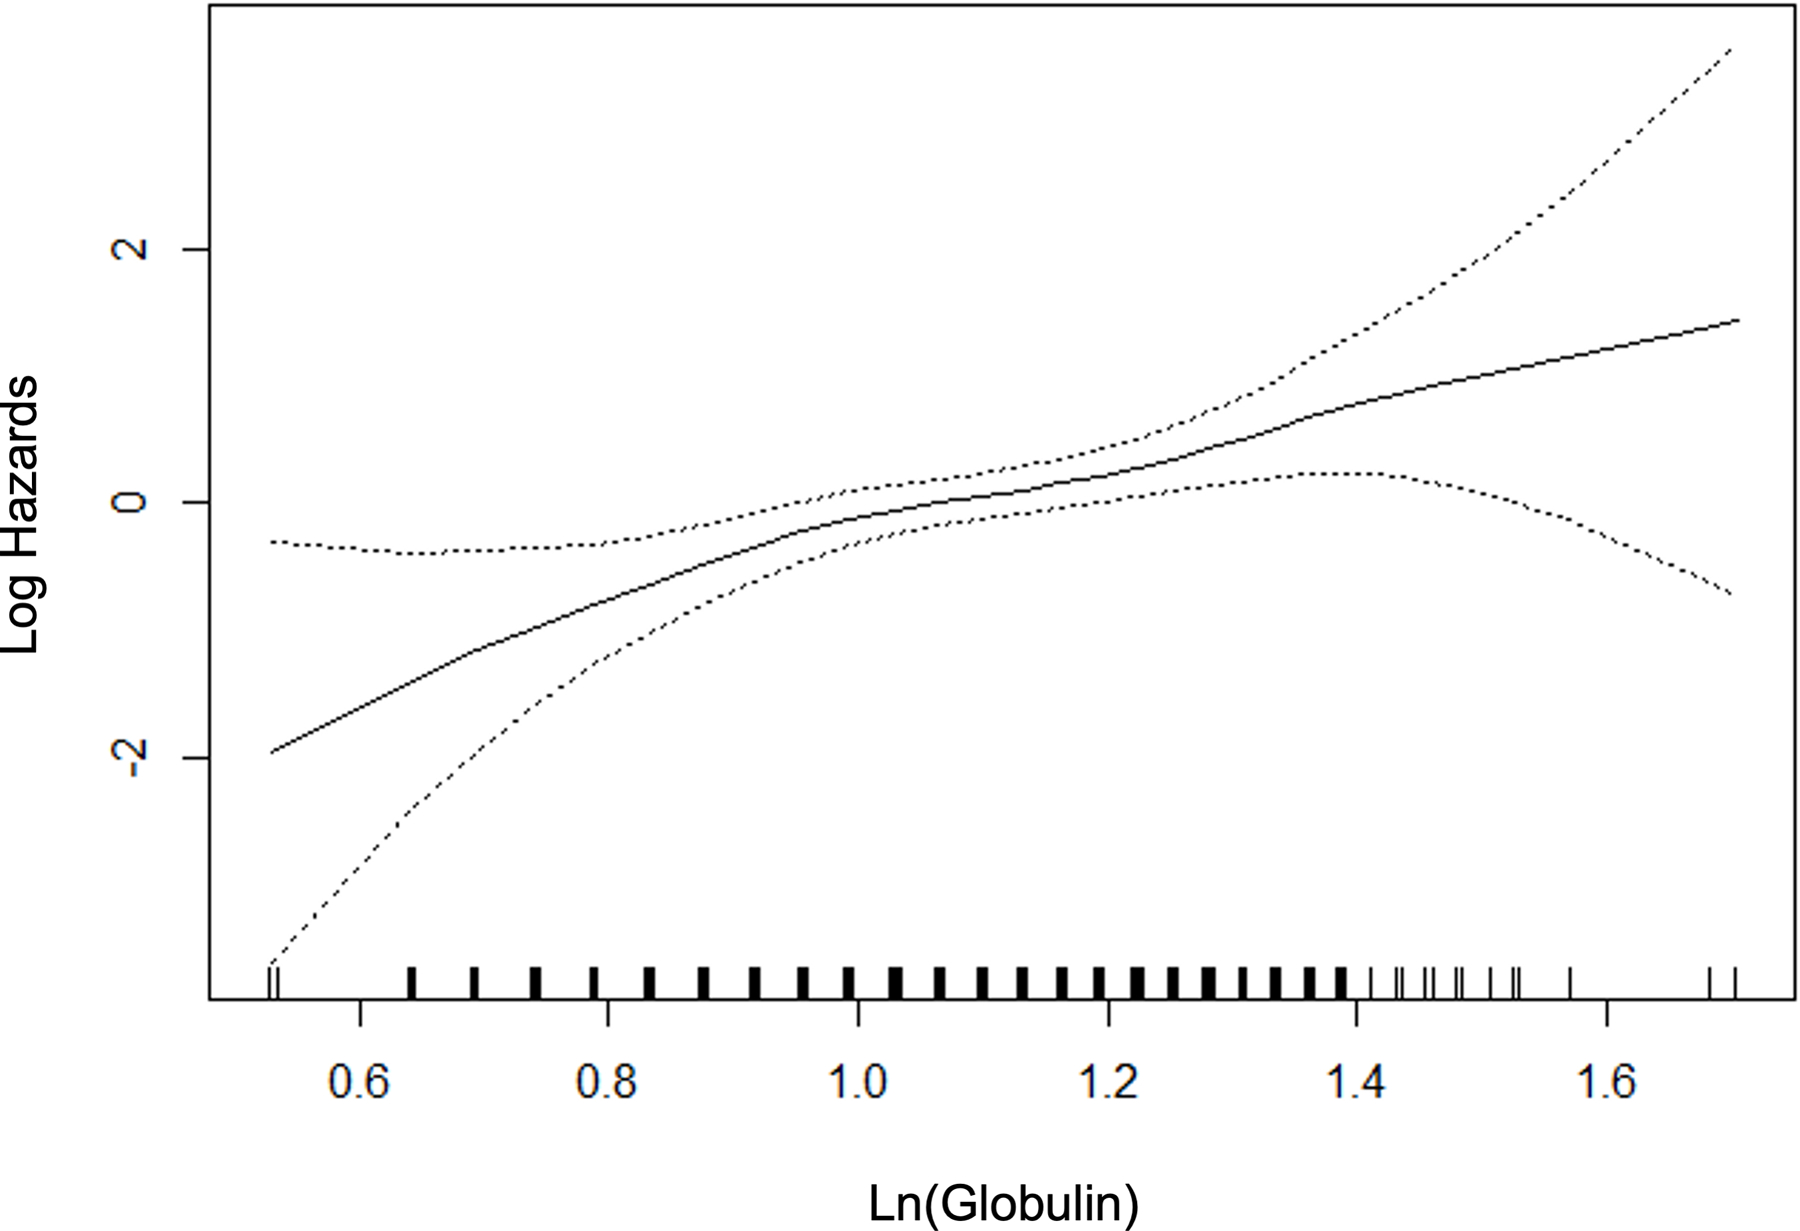
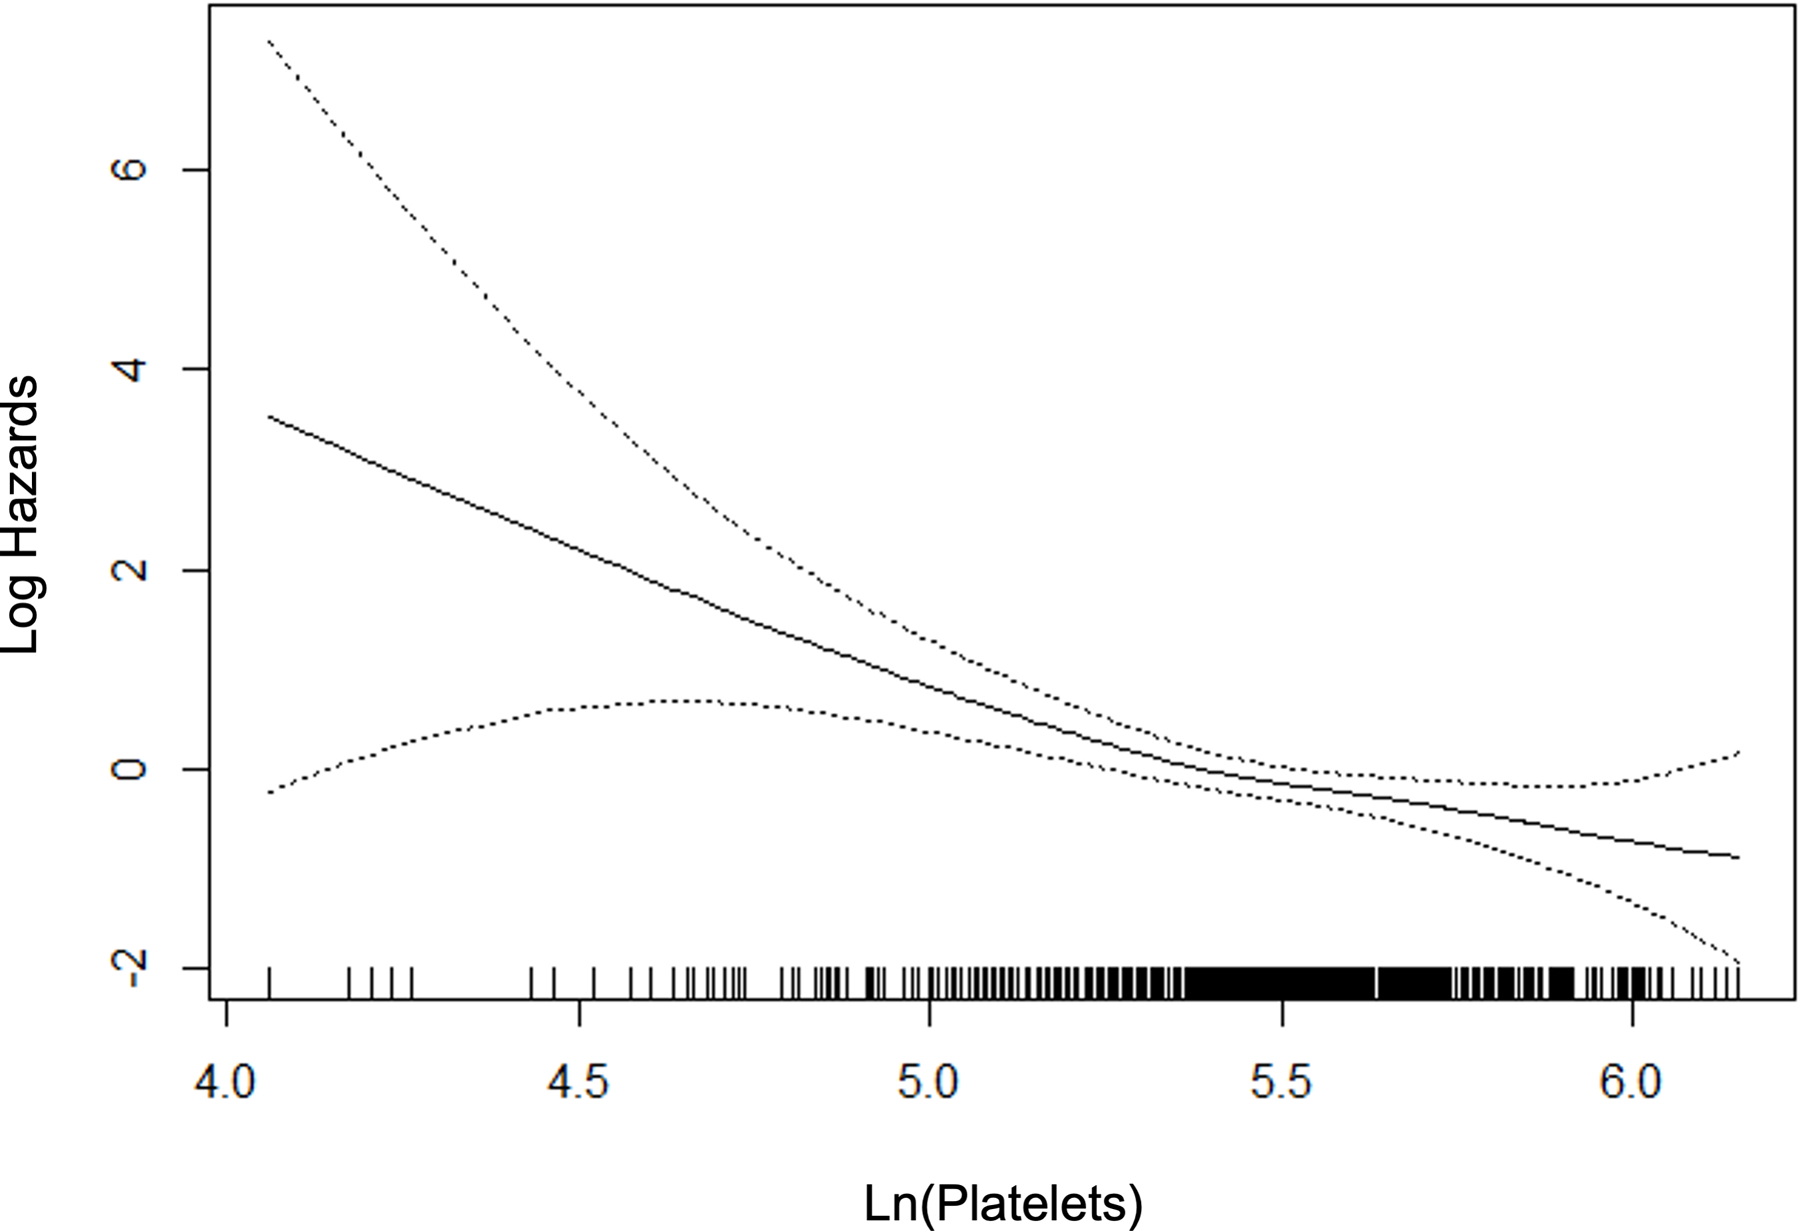
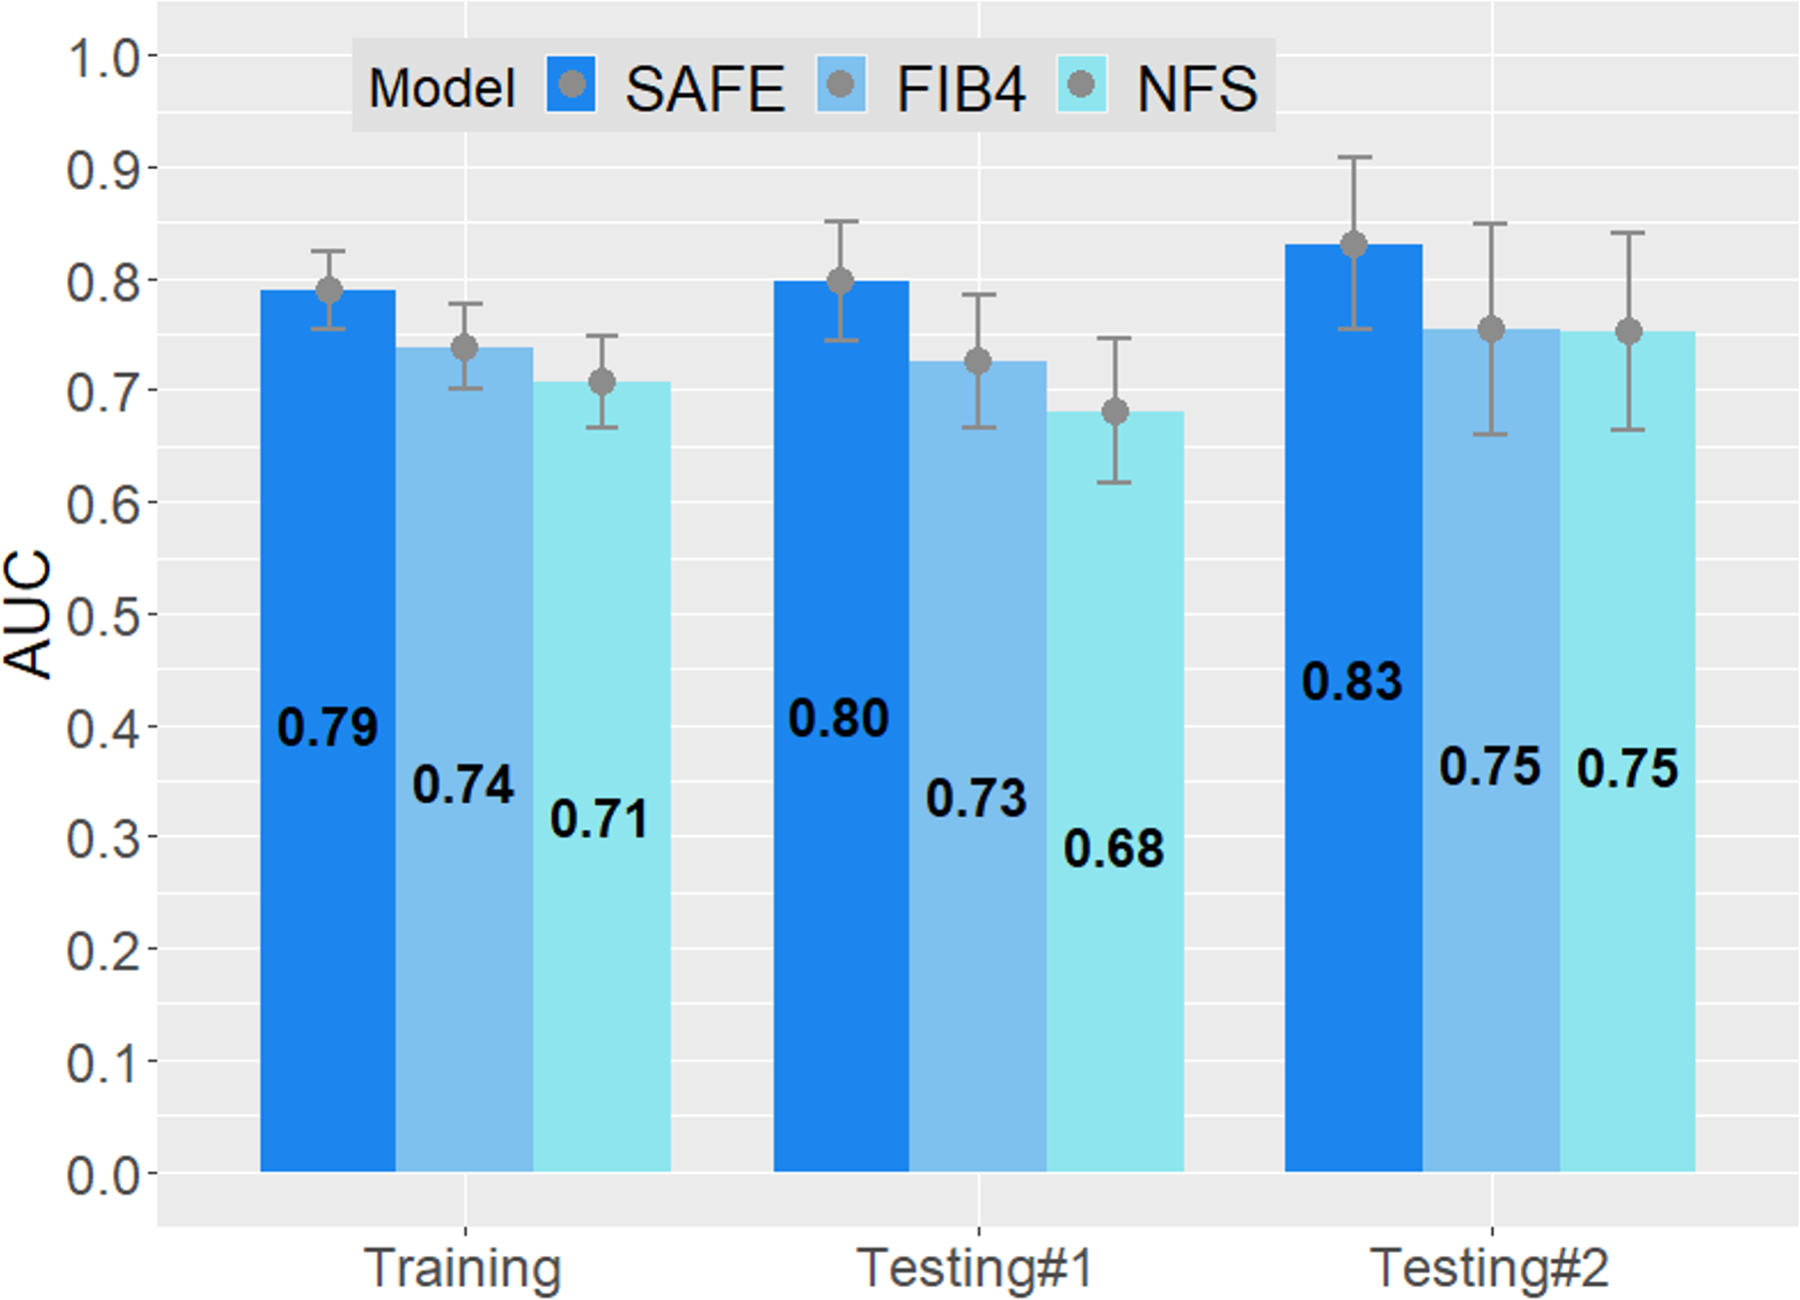
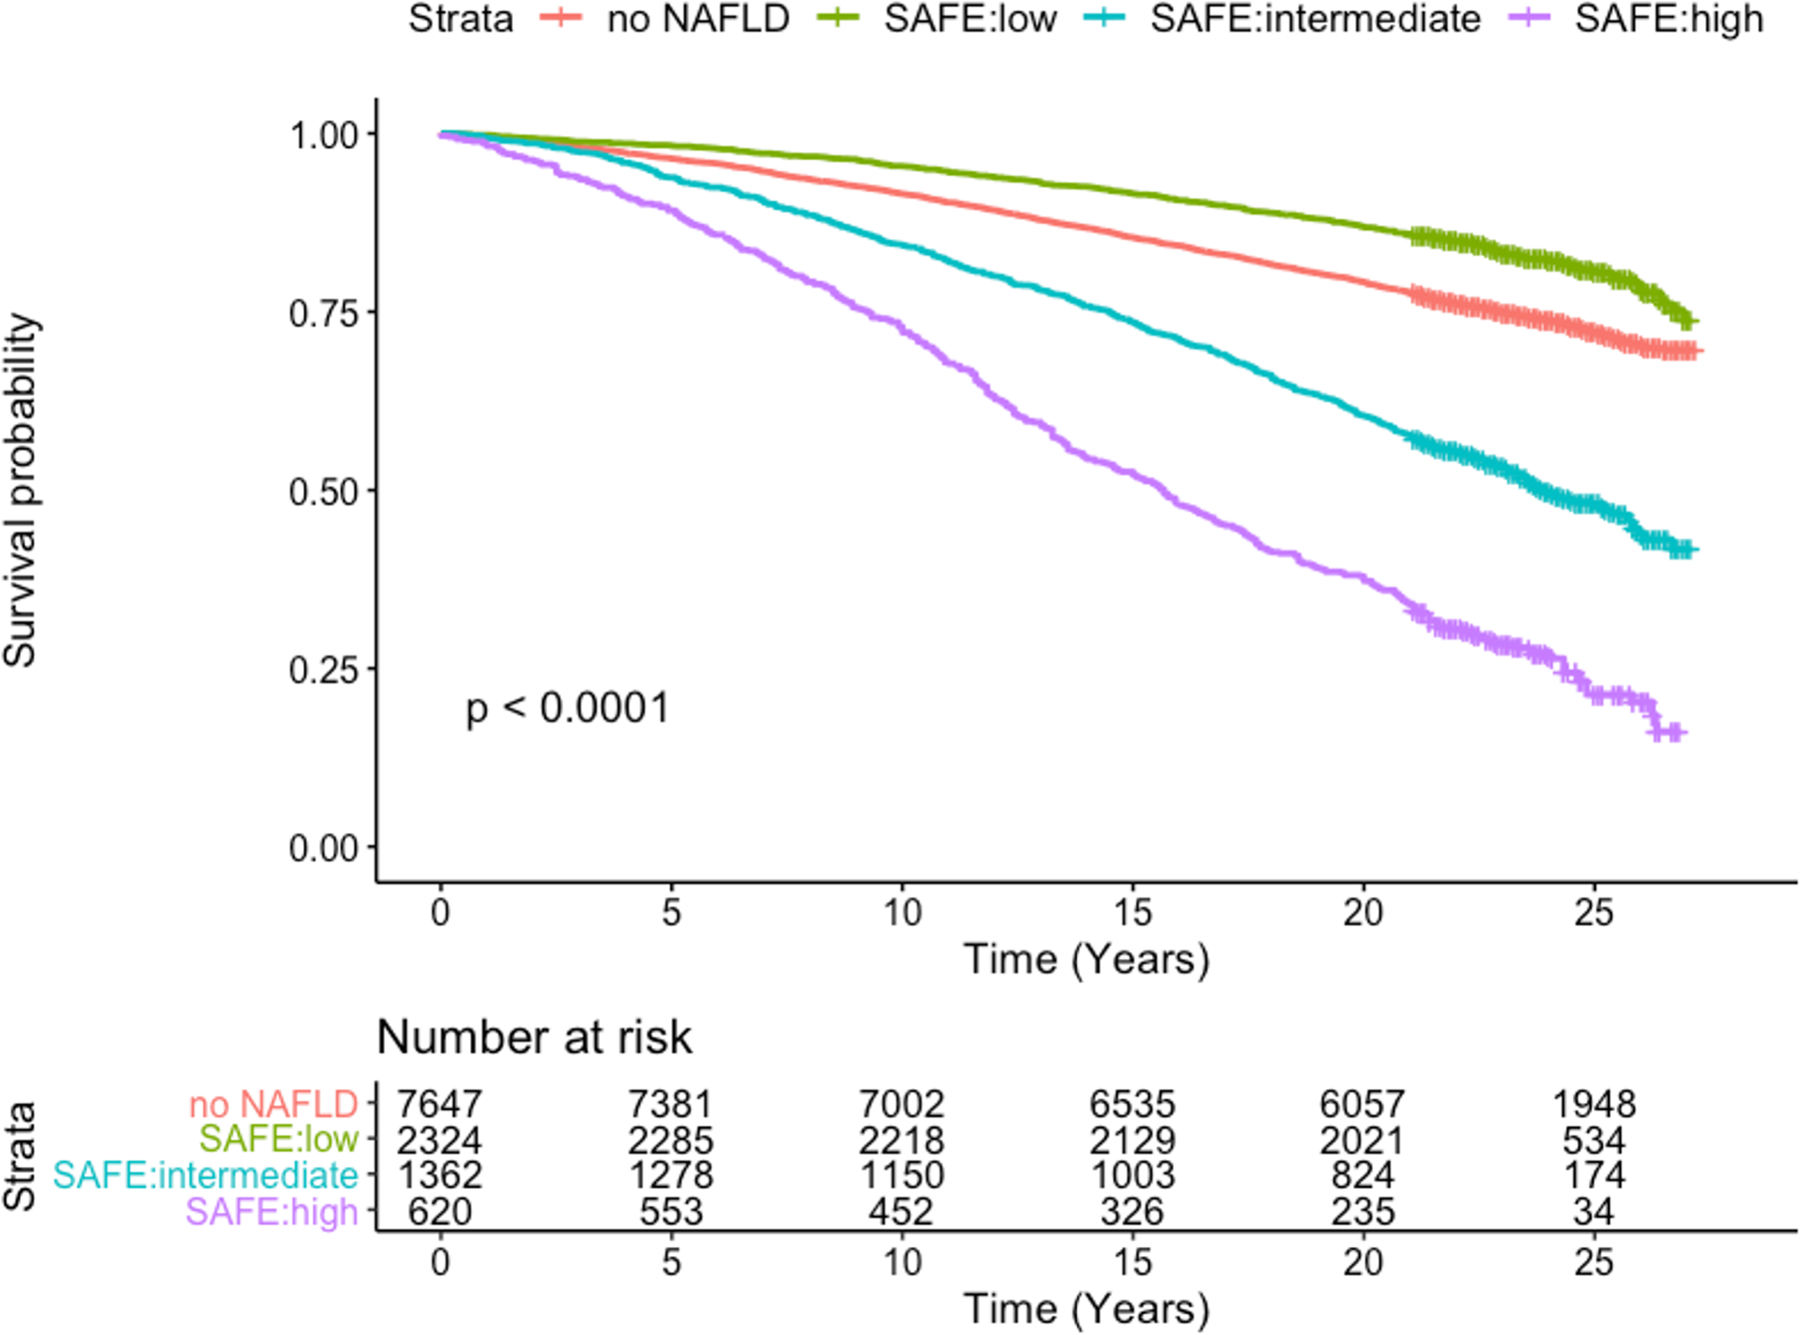
Results: A multivariable logistic regression model was selected as the Steatosis-Associated Fibrosis Estimator (SAFE) score, which consists of age, body mass index, diabetes, platelets, aspartate and alanine aminotransferases, and globulins (total serum protein minus albumin). The model yielded areas under receiver operating characteristic curves ≥0.80 in distinguishing F0/1 from ≥F2 in testing data sets, consistently higher than those of Fibrosis-4 and NAFLD Fibrosis Scores. The negative predictive values in ruling out ≥F2 at SAFE of 0 were 88% and 92% in the two testing sets. In the NHANES III set, survival up to 25 years of subjects with SAFE < 0 was comparable to that of those without steatosis ( p = 0.34), whereas increasing SAFE scores correlated with shorter survival with an adjusted HR of 1.53 ( p < 0.01) for subjects with SAFE > 100.
Conclusion: The SAFE score, which uses widely available variables to estimate liver fibrosis in patients diagnosed with NAFLD, may be used in primary care to recognize low-risk NAFLD.
Copyright © 2022 American Association for the Study of Liver Diseases.
Figures
Comment in
-
A new model for estimation of significant fibrosis in primary care. SAFE to use?Hepatology. 2023 Jan 1;77(1):18-19. doi: 10.1002/hep.32549. Epub 2022 May 21. Hepatology. 2023. PMID: 35491438 No abstract available.
References
-
- Younossi ZM, Koenig AB, Abdelatif D, Fazel Y, Henry L, Wymer M. Global epidemiology of nonalcoholic fatty liver disease-Meta-analytic assessment of prevalence, incidence, and outcomes. Hepatology 2016;64(1):73–84. - PubMed
-
- Younossi ZM, Stepanova M, Younossi Y, et al. Epidemiology of chronic liver diseases in the USA in the past three decades. Gut 2019. - PubMed
-
- Angulo P. Nonalcoholic fatty liver disease. N Engl J Med 2002;346(16):1221–1231. - PubMed
-
- Kleiner DE, Brunt EM, Van Natta M, et al. Design and validation of a histological scoring system for nonalcoholic fatty liver disease. Hepatology 2005;41(6):1313–1321. - PubMed
Publication types
MeSH terms
Grants and funding
LinkOut - more resources
Full Text Sources
Medical
Miscellaneous
