. 2022 Apr 27;12(1):6858.
doi: 10.1038/s41598-022-10909-2.

Universality of political corruption networks

Affiliations

Universality of political corruption networks

Alvaro F Martins et al. Sci Rep. .

Abstract

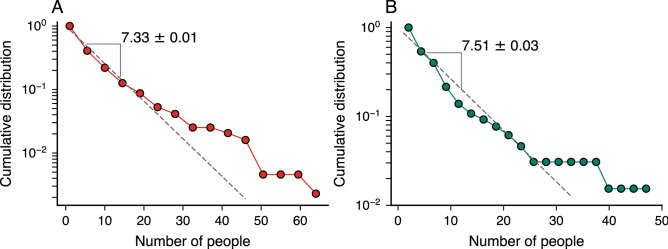
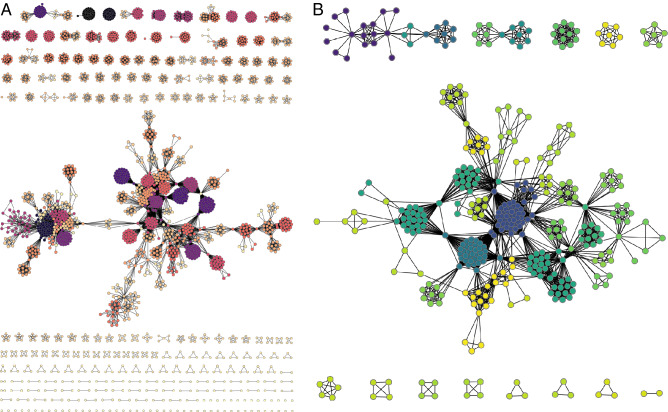
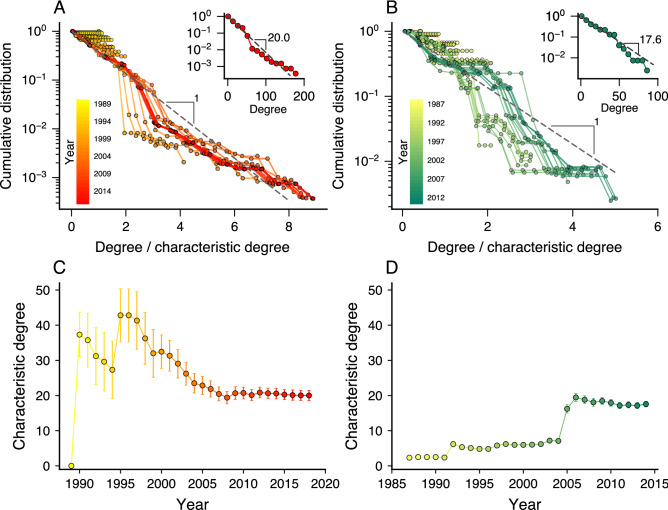
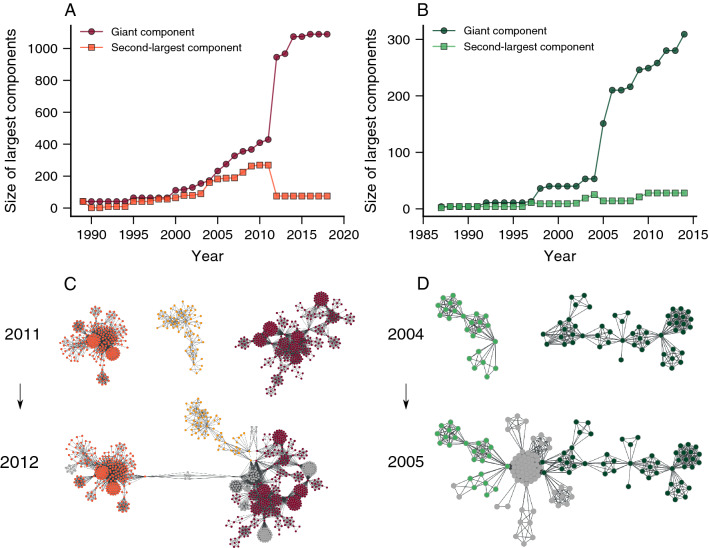
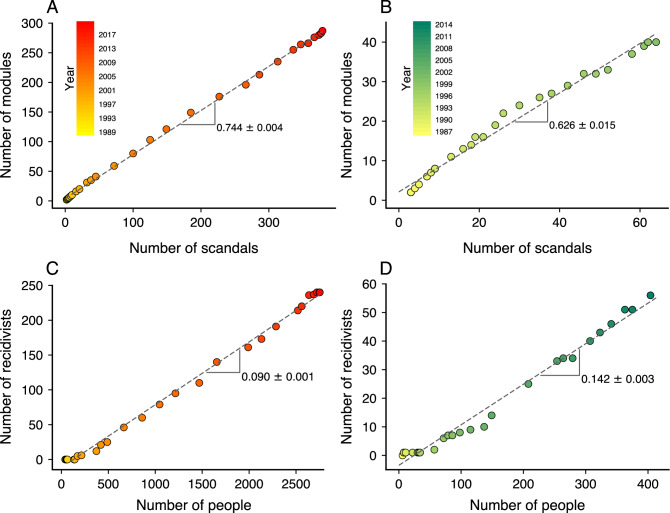
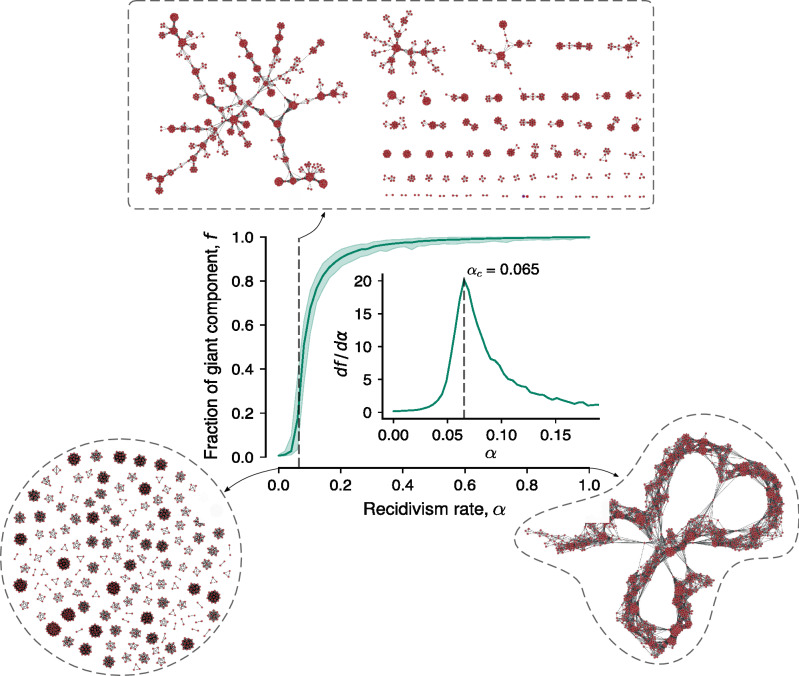
Corruption crimes demand highly coordinated actions among criminal agents to succeed. But research dedicated to corruption networks is still in its infancy and indeed little is known about the properties of these networks. Here we present a comprehensive investigation of corruption networks related to political scandals in Spain and Brazil over nearly three decades. We show that corruption networks of both countries share universal structural and dynamical properties, including similar degree distributions, clustering and assortativity coefficients, modular structure, and a growth process that is marked by the coalescence of network components due to a few recidivist criminals. We propose a simple model that not only reproduces these empirical properties but reveals also that corruption networks operate near a critical recidivism rate below which the network is entirely fragmented and above which it is overly connected. Our research thus indicates that actions focused on decreasing corruption recidivism may substantially mitigate this type of organized crime.


Conflict of interest statement

The authors declare no competing interests.

Figures

Figure 1
Figure 1
The size of corruption scandals is approximately exponentially distributed. Complementary cumulative distribution function of the number of people involved in political corruption scandals in (A) Spain and (B) Brazil. The dashed lines indicate an exponential distribution adjusted to data via the maximum likelihood method. The characteristic number of people involved in these scandals (indicated by the numbers within each panel) is around seven people for both countries.
Figure 2
Figure 2
Visualization of the corruption networks formed by people involved in political scandals in (A) Spain and (B) Brazil. In both networks, nodes represent people and the edges among them indicate individuals engaged in the same corruption case. The colors refer to the modular structures of these networks estimated by the infomap algorithm,.
Figure 3
Figure 3
Degree distributions of corruption networks are approximated by exponential models with characteristic degrees that seem to approach a constant value with the network growth. Complementary cumulative distributions of the node degree divided by the characteristic degree for each year (indicated by the color code) of the (A) Spanish and (B) Brazilian networks. The insets show the degree distributions for the latest stage of the network of each country. The approximately linear behavior of these curves on a log-linear scale and the good quality collapse of the distributions indicate that the exponential model approximates well the degree distributions. Evolution of the characteristic degree for the (C) Spanish and (D) Brazilian corruption networks. The markers indicate the maximum-likelihood estimate of the characteristic degree in each year and the error bars stand for 95% bootstrap confidence intervals.
Figure 4
Figure 4
Corruption networks grow by a coalescence-like process of network components. Evolution of the size of the giant component (circle) and second-largest component (square) of the (A) Spanish and (B) Brazilian corruption networks. We observe that these quantities undergo sudden changes between specific years (2011–2012 for Spain and 2004–2005 for Brazil) characterized by an abrupt increase in the giant component and an abrupt decrease in the second-largest component. Snapshot visualizations of the network before and after the abrupt changes in the largest components of the (C) Spanish and (D) Brazilian networks. We observe that these changes are associated with a coalescence of network components caused by the emergence of new scandals (new nodes are colored in gray) involving a few recidivist agents.
Figure 5
Figure 5
Evolution of the modular structure and the emergence of recidivist agents in corruption networks. Relationship between the number of network modules and the total of political scandals for each year of the (A) Spanish and (B) Brazilian corruption networks. The dashed lines are linear models adjusted to data, indicating that 0.744±0.004 network modules are created per scandal in the Spanish network, while 0.626±0.015 network modules per scandal emerge in the Brazilian network. Association between the number of recidivist agents and the total number of people for each year of the (C) Spanish and (D) Brazilian corruption networks. The dashed lines represent a linear model adjusted to data, where we find 0.090±0.001 and 0.142±0.003 recidivists per agent in the Spanish and Brazilian networks, respectively.
Figure 6
Figure 6
Corruption networks seem to operate close to the critical recidivism rate of our model. The continuous curve in the main panel shows the average fraction of the giant component of simulated networks (f) as a function of the recidivism rate (α), and the shaded region represents the minimum and maximum values of f estimated from one thousand model realizations for each α. The inset in the main panel depicts the derivative of f with respect to α, and the dashed vertical line (also shown in the main panel) indicates the critical recidivism rate αc=0.065 of our model, a value that is not too far from the recidivism rates of the Spanish (α=0.09) and Brazilian (α=0.14) networks. The three visualizations surrounded by dashed paths represent typical simulated networks for α=0, α=αc, and α=1. We observe that α=αc (upper network visualization) generates networks visually similar to the empirical corruption networks.

References

    1. Jensen HJ. Self-organized Criticality: Emergent Complex Behavior in Physical and Biological Systems. Cambridge University Press; 1998.
    1. Mitchell M. Complexity: A Guided Tour. Oxford University Press; 2009.
    1. Castellano C, Fortunato S, Loreto V. Statistical physics of social dynamics. Rev. Mod. Phys. 2009;81:591. doi: 10.1103/RevModPhys.81.591. - DOI
    1. Jusup M, et al. Social physics. Phys. Rep. 2022;948:1–148. doi: 10.1016/j.physrep.2021.10.005. - DOI
    1. D’Orsogna MR, Perc M. Statistical physics of crime: A review. Phys. Life Rev. 2015;12:1–21. doi: 10.1016/j.plrev.2014.11.001. - DOI - PubMed

Publication types