. 2022 Apr 27;12(1):6839.
doi: 10.1038/s41598-022-10881-x.

High altitude is associated with pTau deposition, neuroinflammation, and myelin loss

Affiliations

High altitude is associated with pTau deposition, neuroinflammation, and myelin loss

Diego Iacono et al. Sci Rep. .

Abstract

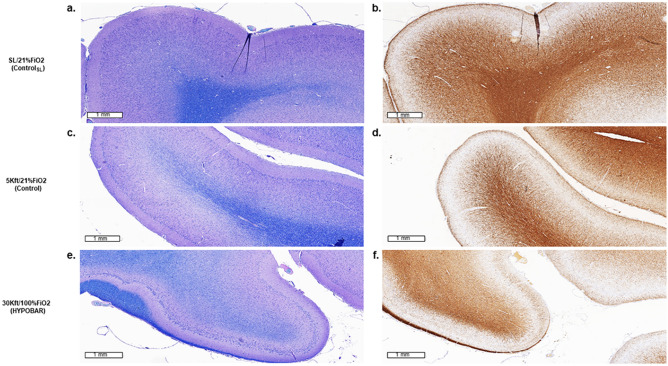
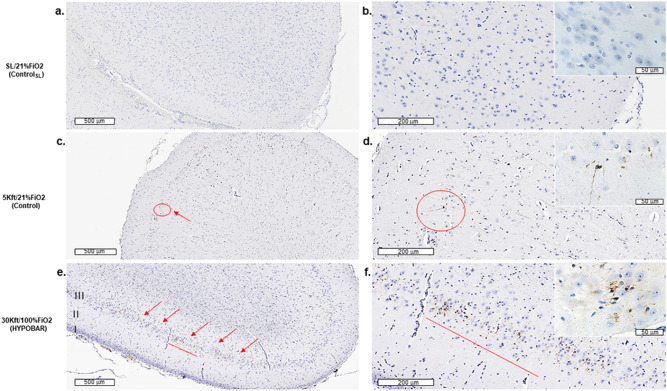
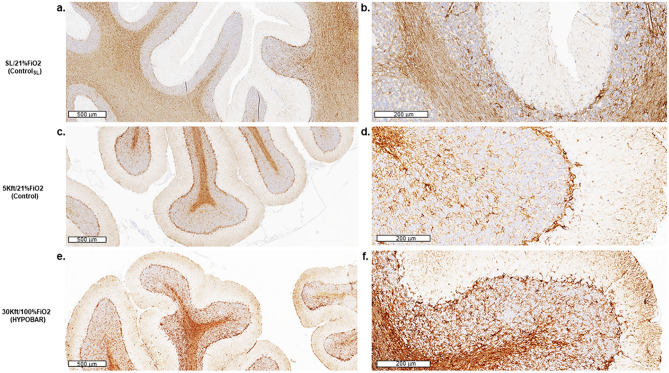
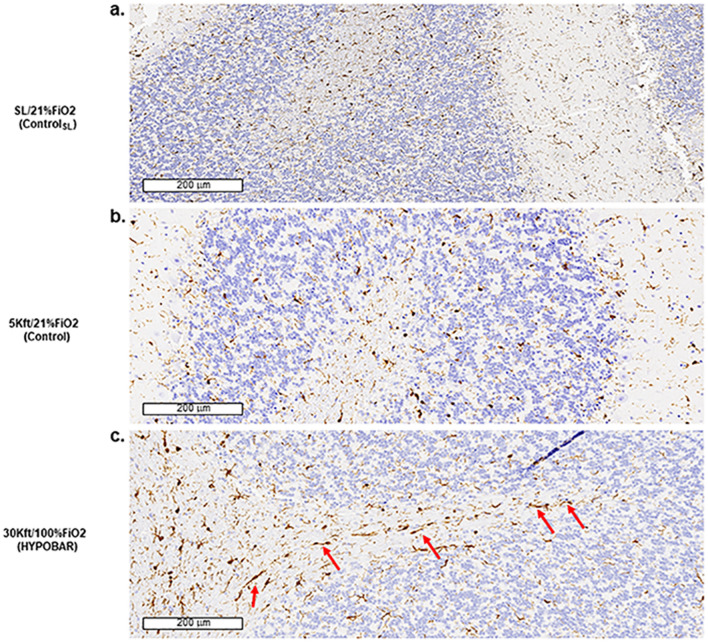
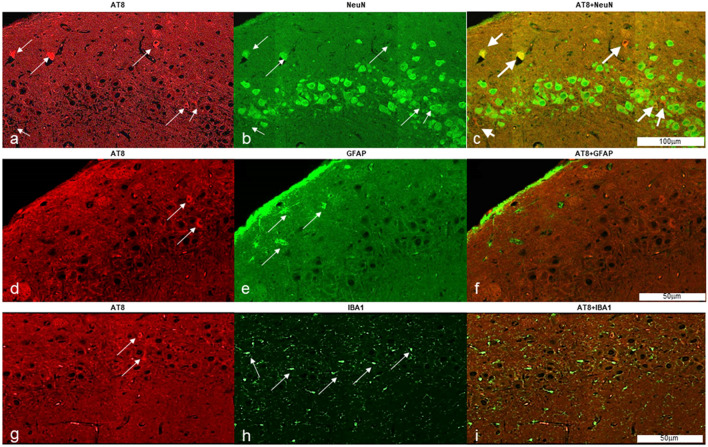
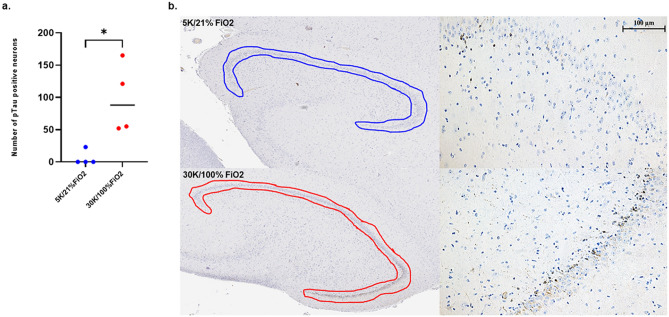
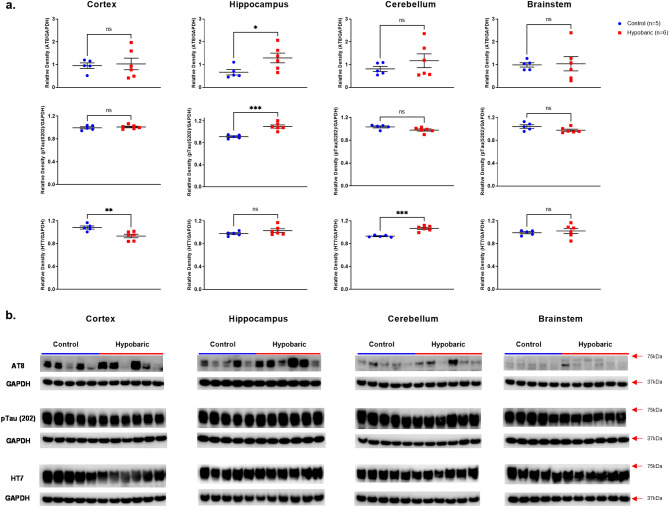
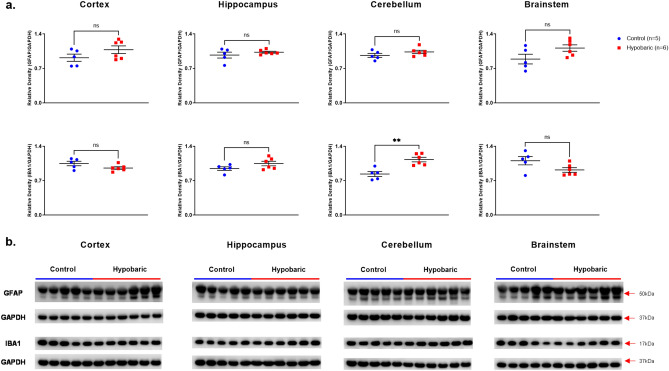
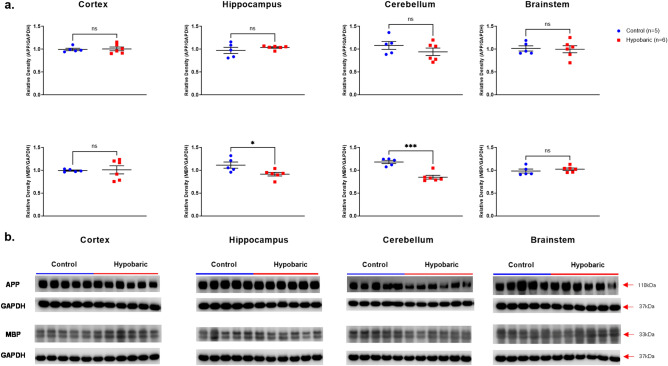
Mammals are able to adapt to high altitude (HA) if appropriate acclimation occurs. However, specific occupations (professional climbers, pilots, astronauts and other) can be exposed to HA without acclimation and be at a higher risk of brain consequences. In particular, US Air Force U2-pilots have been shown to develop white matter hyperintensities (WMH) on MRI. Whether WMH are due to hypoxia or hypobaria effects is not understood. We compared swine brains exposed to 5000 feet (1524 m) above sea level (SL) with 21% fraction inspired O2 (FiO2) (Control group [C]; n = 5) vs. 30,000 feet (9144 m) above SL with 100% FiO2 group (hypobaric group [HYPOBAR]; n = 6). We performed neuropathologic assessments, molecular analyses, immunohistochemistry (IHC), Western Blotting (WB), and stereology analyses to detect differences between HYPOBAR vs. Controls. Increased neuronal insoluble hyperphosphorylated-Tau (pTau) accumulation was observed across different brain regions, at histological level, in the HYPOBAR vs. Controls. Stereology-based cell counting demonstrated a significant difference (p < 0.01) in pTau positive neurons between HYPOBAR and C in the Hippocampus. Higher levels of soluble pTau in the Hippocampus of HYPOBAR vs. Controls were also detected by WB analyses. Additionally, WB demonstrated an increase of IBA-1 in the Cerebellum and a decrease of myelin basic protein (MBP) in the Hippocampus and Cerebellum of HYPOBAR vs. Controls. These findings illustrate, for the first time, changes occurring in large mammalian brains after exposure to nonhypoxic-hypobaria and open new pathophysiological views on the interaction among hypobaria, pTau accumulation, neuroinflammation, and myelination in large mammals exposed to HA.


Conflict of interest statement

The authors declare no competing interests.

Figures

Figure 1
Figure 1
Luxol-fast Blue (LFB) stain (a,c,e) and immunohistochemistry (IHC) outcomes of MBP (myelin basic protein) antibody (b,d,f) in the left parietal cortex of minipig brains exposed to different oxemic and barometric conditions. All panels are at a scale of 1 mm (mm). Note the marked level of myelin rarefaction (e,f) in the cortical white matter of HYPOBAR vs. the other two experimental groups [CSL (a,b) and C (c,d) group]. SL sea level, FiO2 fraction inspired oxygen, HYPOBAR nonhypoxic-hypobaric condition, ft feet, ControlSL SL/21%FiO2, Control 5Kft/21%FiO2.
Figure 2
Figure 2
Immunohistochemistry (IHC) outcomes of the AT8 antibody in the left parietal cortex of minipig brains exposed to different oxemic and barometric conditions. Panel (af) show sections of the left parietal cortex at a lower level of magnification [at a scale of 500 microns (µm)] across all three analyzed experimental conditions. Panel (b), (d), (f) include upper right insets at a higher level of magnification [at a scale of 50 microns (µm)]. I, II, III indicate cortical layers. Red signals indicate the presence of AT8 positive cortical cells. Note the higher level of AT8-positive cortical cells in the 30ft/100%FiO2 (HYPOBAR) group. SL sea level, FiO2 fraction inspired oxygen, HYPOBAR nonhypoxic-hypobaric condition, ft feet, ControlSL SL/21%FiO2, Control 5Kft/21%FiO2.
Figure 3
Figure 3
Immunohistochemistry (IHC) outcomes of the GFAP antibody in the left cerebellar hemisphere of minipig brains exposed to different oxemic and barometric conditions. Panel (a), (c), (e) show sections of the left cerebellar cortex at a lower level of magnification [at a scale of 600 microns (µm)] across all three analyzed conditions. Panels (b), (d), (f) show the same regions at a higher level of magnification [at a scale of 200 microns (µm)]. Note the higher astroglial response in the cerebellar “arbor vitae” of HYPOBAR vs. the other two groups. SL sea level, FiO2 fraction inspired oxygen, HYPOBAR nonhypoxic-hypobaric condition, ft feet, ControlSL SL/21%FiO2, Control 5Kft/21%FiO2.
Figure 4
Figure 4
Immunohistochemistry (IHC) outcomes of IBA1 antibody. Panels (ac) are at a scale of 200 microns (µm). Note in panel c the presence of rod-shape microglia cells in the cerebellar “arbor vitae” in the 30Kft/100%FiO2 (HYPOBAR) group in comparison to the other two groups (SL/21%FiO2 and 5Kft/21%FiO2). SL sea level, FiO2 fraction inspired oxygen, HYPOBAR nonhypoxic-hypobaric condition, ft feet, ControlSL SL/21%FiO2, Control 5Kft/21%FiO2.
Figure 5
Figure 5
Hyperphosphorylated-Tau (pTau) accumulates in neurons after Hypobaric Exposure. Figure shows immunofluorescence reactivity for AT8 in hippocampal neurons of a HYPOBAR animal (ac). AT8 did not colocalize with either astroglial (df) or microglial cells (gi). Thin white arrows show AT8+, NeuN+, GFAP+ and IBA1+ positive cells in the hippocampal cortex of a HYPOBAR animal. Notice the specific accumulation of pTau (AT8) in neurons (Thick white arrows, c).
Figure 6
Figure 6
Stereological Counts for AT8 positive neurons in the Dentate Gyrus (DG) of the left Hippocampus. (a) Histogram representing the neuronal counting of AT8 positive neurons measured in the DG region of HYPOBAR (red spot) vs. C (blue spots) of a total of 4 animals for each experimental condition. (b) Histological images and contours of the region of interest analyzed for the stereology-based counting assessment. Of note are the relative higher frequency of AT8 positive neurons along the granular layer of the DG. DG dentate gyrus of the hippocampus.
Figure 7
Figure 7
Phosphorylated and Total Tau Protein Expression following Hypobaric Exposure. (a) Histograms representing the densitometric ratio of levels of pTau-AT8 (Ser202 and Thr205), pTau (Ser202) and HT7 with respect to GAPDH in the Control (blue spots) vs. HYPOBAR (red squares) group as measured in the frontal cortex, hippocampus, cerebellum and brainstem. All gels were run in duplicate and data represents the average of 2 runs per sample. Error bars represent standard error of the mean (SEM). *p < 0.05; **p < 0.01 (two-tailed unpaired t-test). (b) Representative western blots for antibodies used. Full length blots are shown in Supplementary Figs. 3–9.
Figure 8
Figure 8
GFAP and IBA-1 Protein Expression Following Hypobaric Exposure. (a) Histograms representing the densitometric ratio of levels of GFAP and IBA1 with respect to GAPDH in the Control (blue spots) vs. HYPOBAR (red squares) group as measured in the frontal cortex, hippocampus, cerebellum and brainstem. All gels were run in duplicate and data represents the average of 2 runs per sample. Error bars represent standard error of the mean (SEM). *p < 0.05; **p < 0.01 (two-tailed unpaired t-test). (b) Representative western blots for antibodies used. Full length blots are shown in Supplementary Figs. 3–9.
Figure 9
Figure 9
APP and MBP protein expression following hypobaric exposure. (a) Histograms representing the densitometric ratio of levels of APP and MBP with respect to GAPDH in the Control (blue spots) vs. HYPOBAR (red squares) group as measured in the frontal cortex, hippocampus, cerebellum and brainstem. All gels were run in duplicate and data represents the average of 2 runs per sample. Error bars represent standard error of the mean (SEM). *p < 0.05; **p < 0.01 (two-tailed unpaired t-test). (b) Representative western blots for antibodies used. Full length blots are shown in Supplementary Figs. 3–9.

References

    1. Zafren K, Honigman B. High-altitude medicine. Emerg. Med. Clin. N. Am. 1997;151:191–222. doi: 10.1016/s0733-8627(05)70291-1. - DOI - PubMed
    1. Johnson NJ, Luks AM. High-altitude medicine. Med. Clin. N. Am. 2016;100(2):357–369. doi: 10.1016/j.mcna.2015.09.002. - DOI - PubMed
    1. Burtscher M, Niedermeier M, Burtscher J, Pesta D, Suchy J, Strasser B. Preparation for endurance competitions at altitude: Physiological, psychological, dietary and coaching aspects. A narrative review. Front. Physiol. 2018;9(1504):1–14. doi: 10.3389/fphys.2018.01504. - DOI - PMC - PubMed
    1. Ju JD, et al. Acute altitude acclimatization in young healthy volunteers: Nocturnal oxygenation increases over time, whereas periodic breathing persists. High Alt. Med. Biol. 2021;22:14–23. doi: 10.1089/ham.2020.0009. - DOI - PMC - PubMed
    1. Storz JF, Scott GR. Phenotypic plasticity, genetic assimilation, and genetic compensation in hypoxia adaptation of high-altitude vertebrates. Comp. Biochem. Physiol. Part A Mol. Integr. Physiol. 2021;253:110865. doi: 10.1016/j.cbpa.2020.110865. - DOI - PMC - PubMed

Publication types