. 2022 Apr;4(4):476-494.
doi: 10.1038/s42255-022-00561-5. Epub 2022 Apr 25.

Dysregulation of macrophage PEPD in obesity determines adipose tissue fibro-inflammation and insulin resistance

Affiliations

Dysregulation of macrophage PEPD in obesity determines adipose tissue fibro-inflammation and insulin resistance

V Pellegrinelli et al. Nat Metab. 2022 Apr.

Abstract

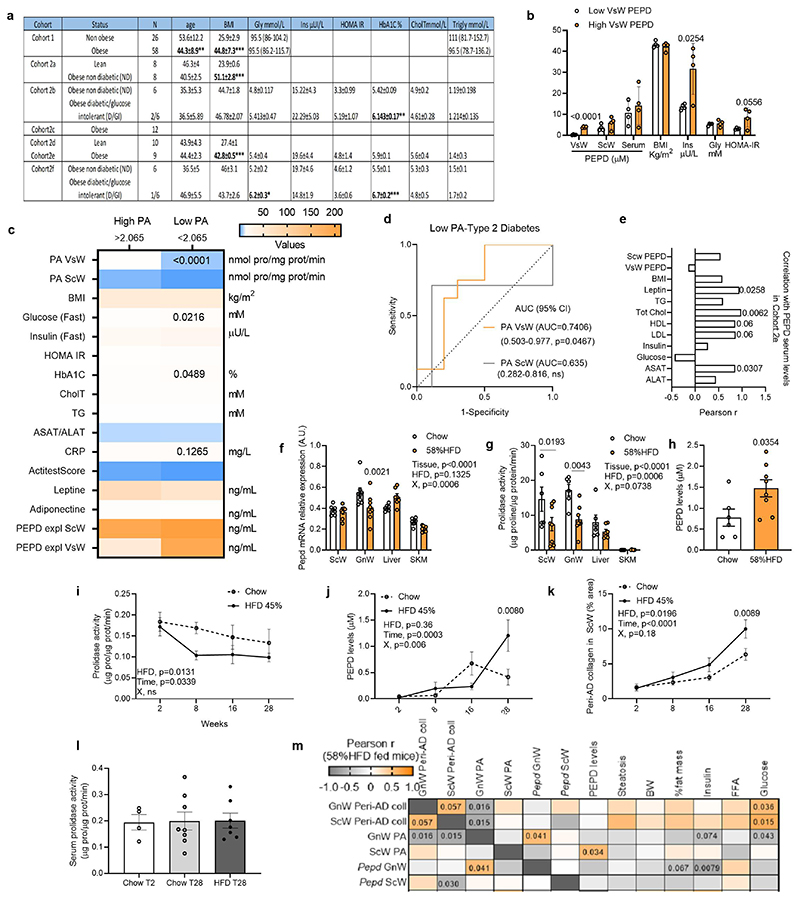
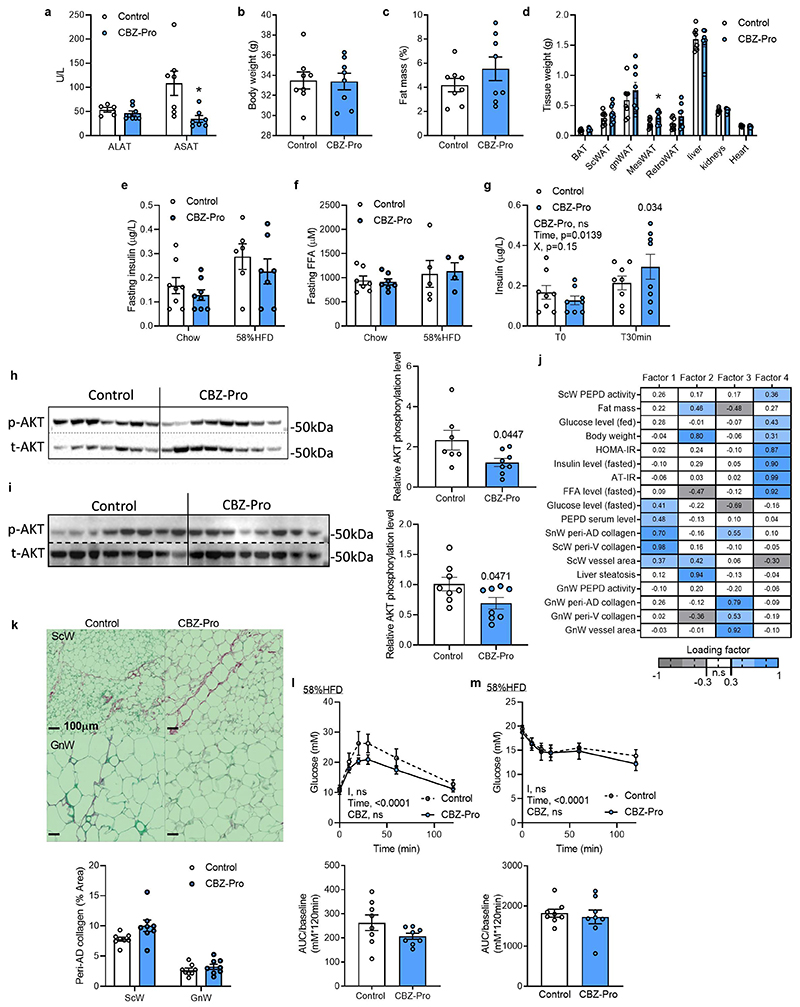
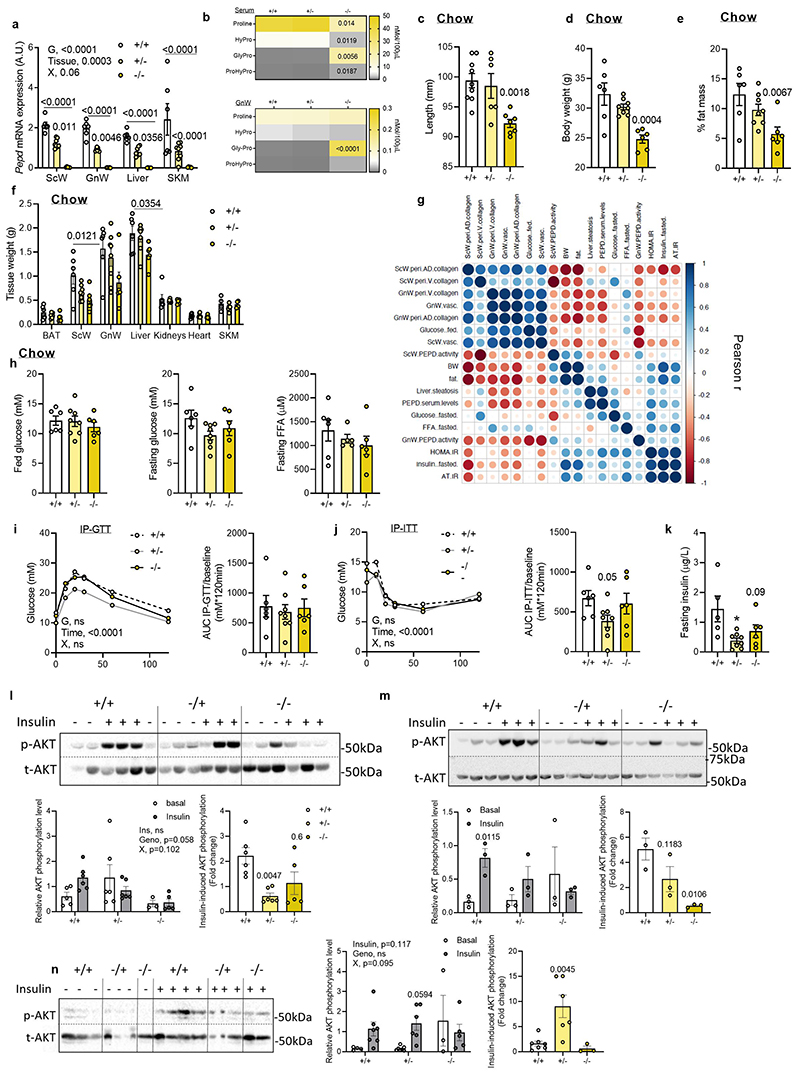
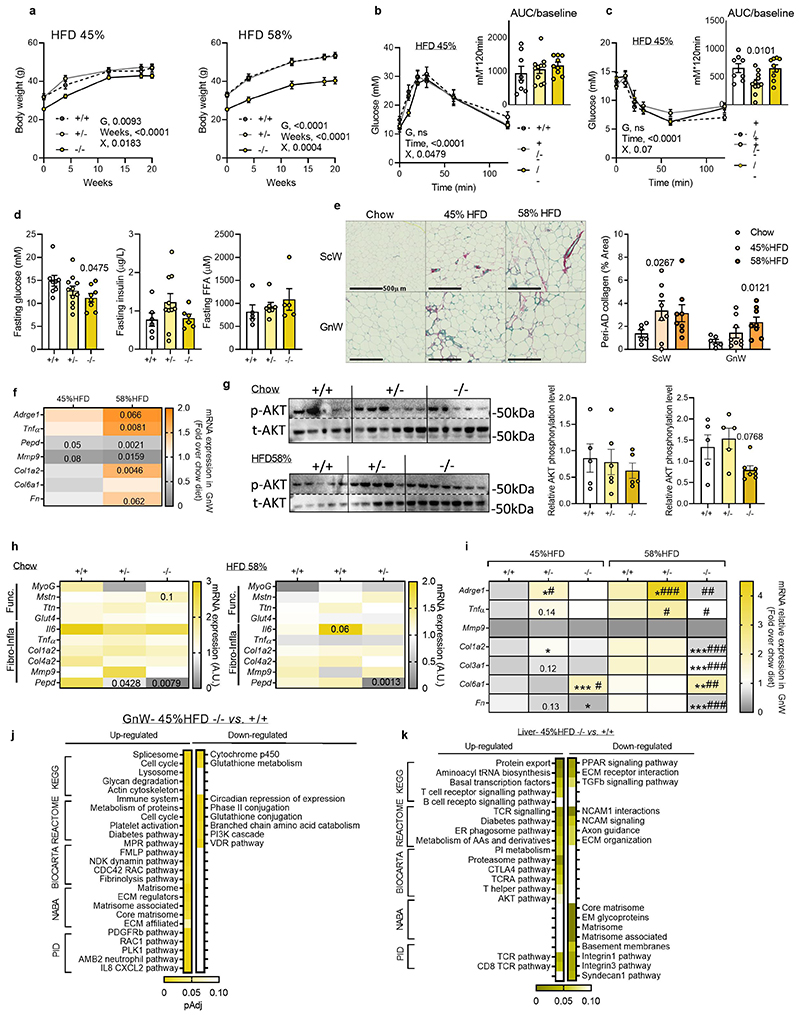
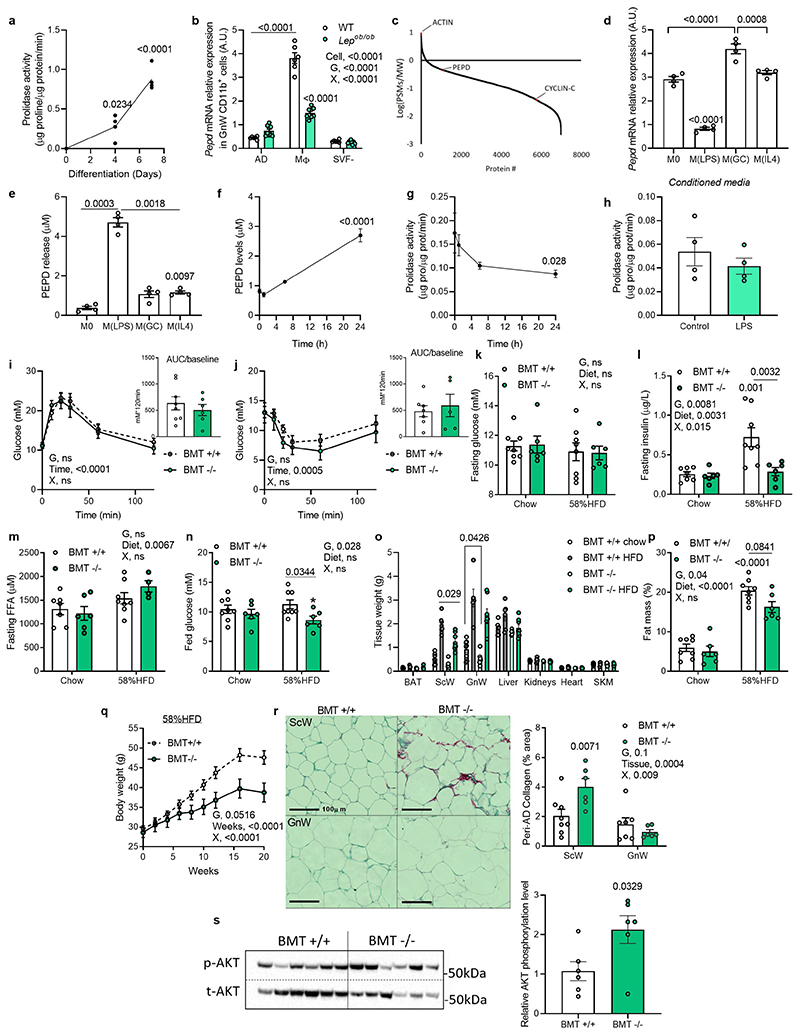
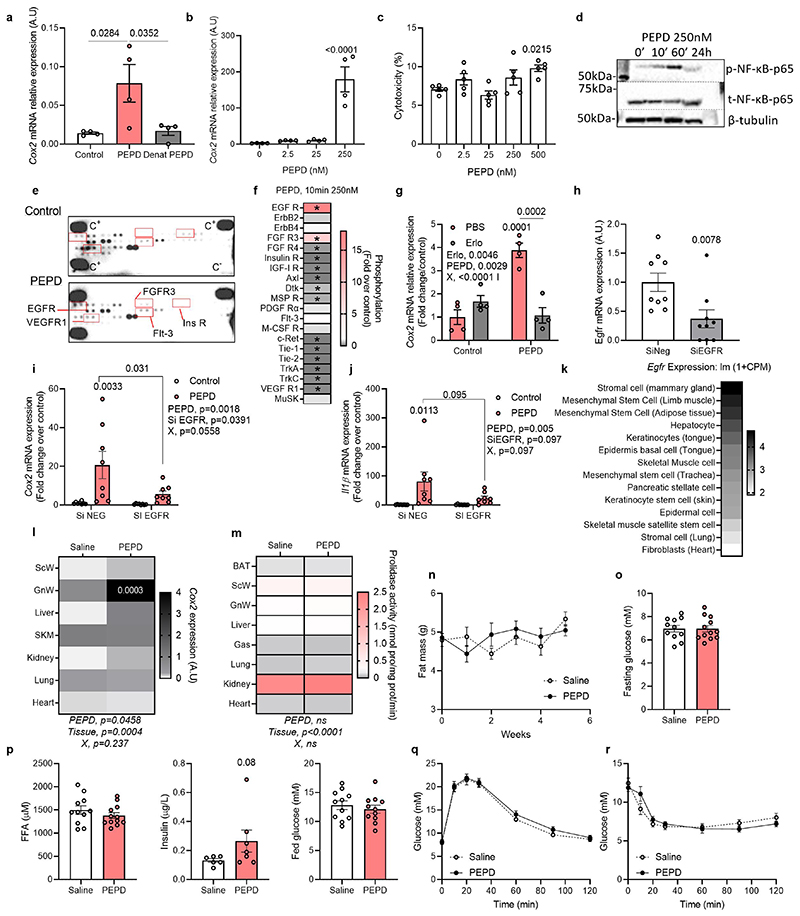
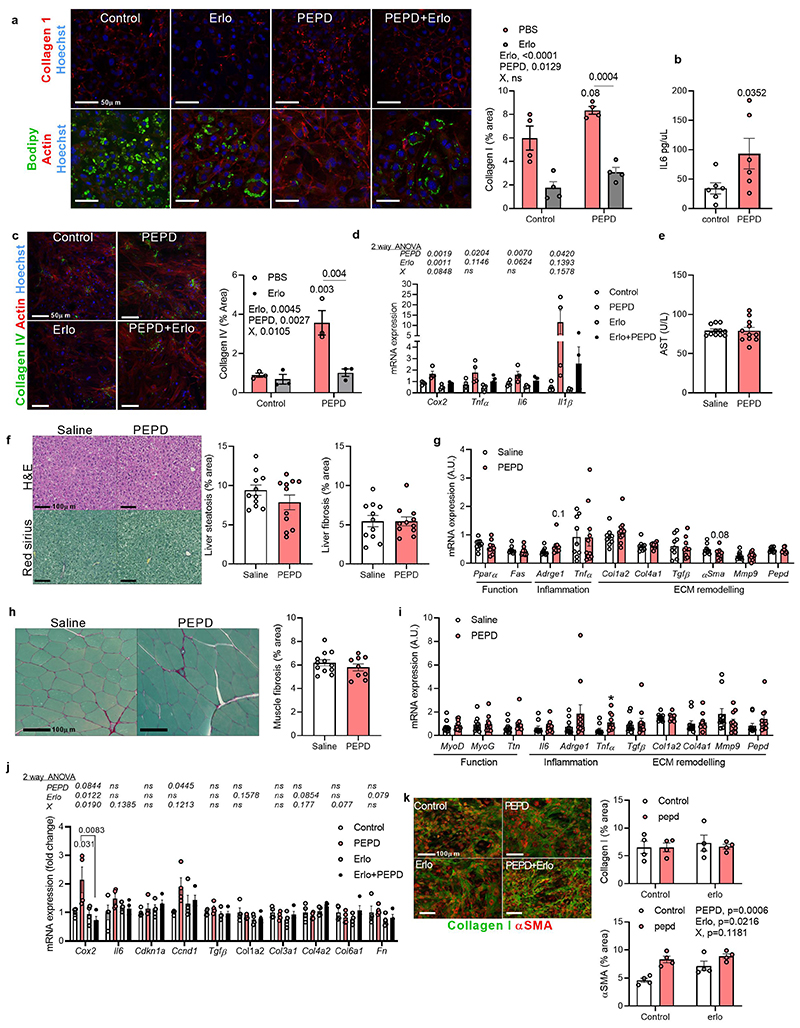
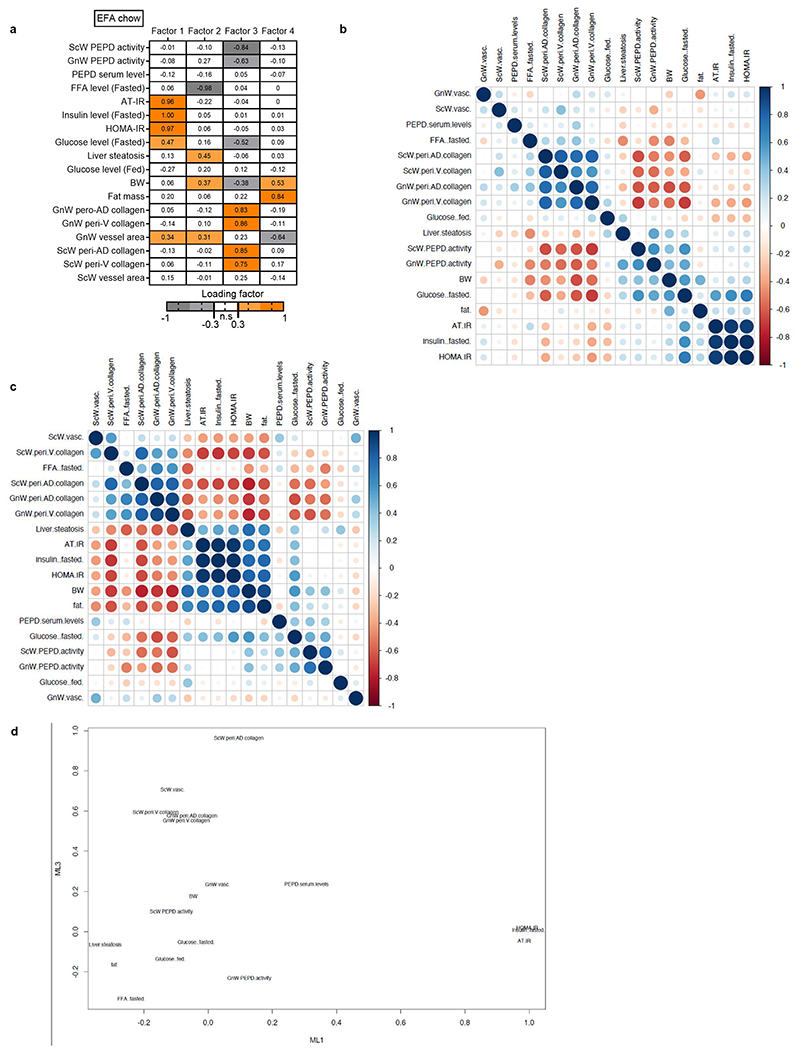
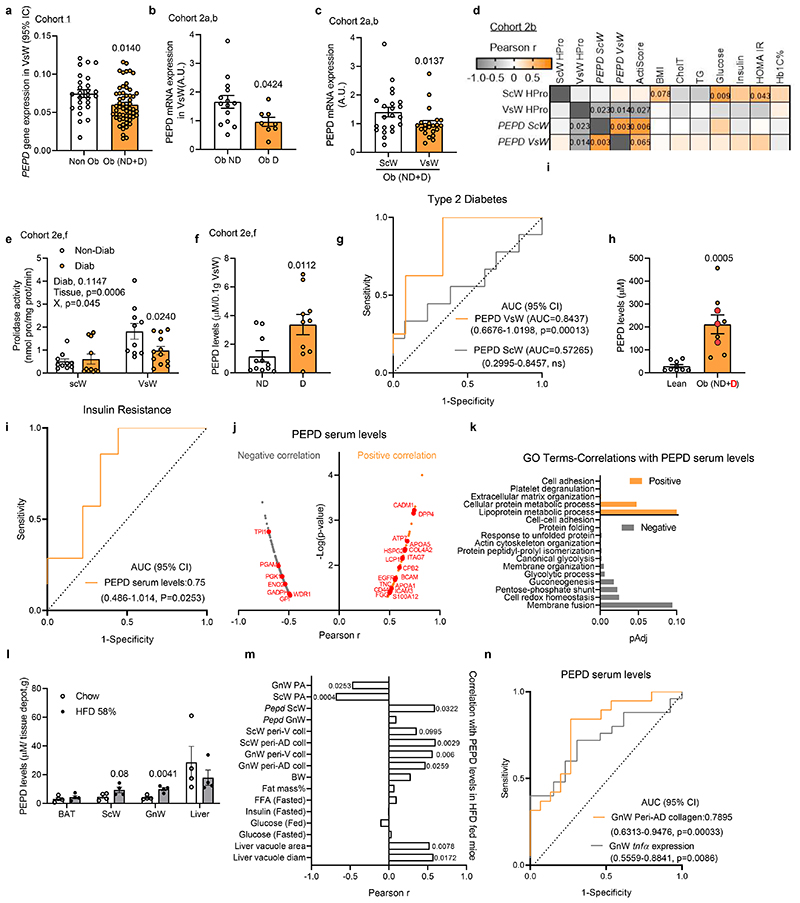
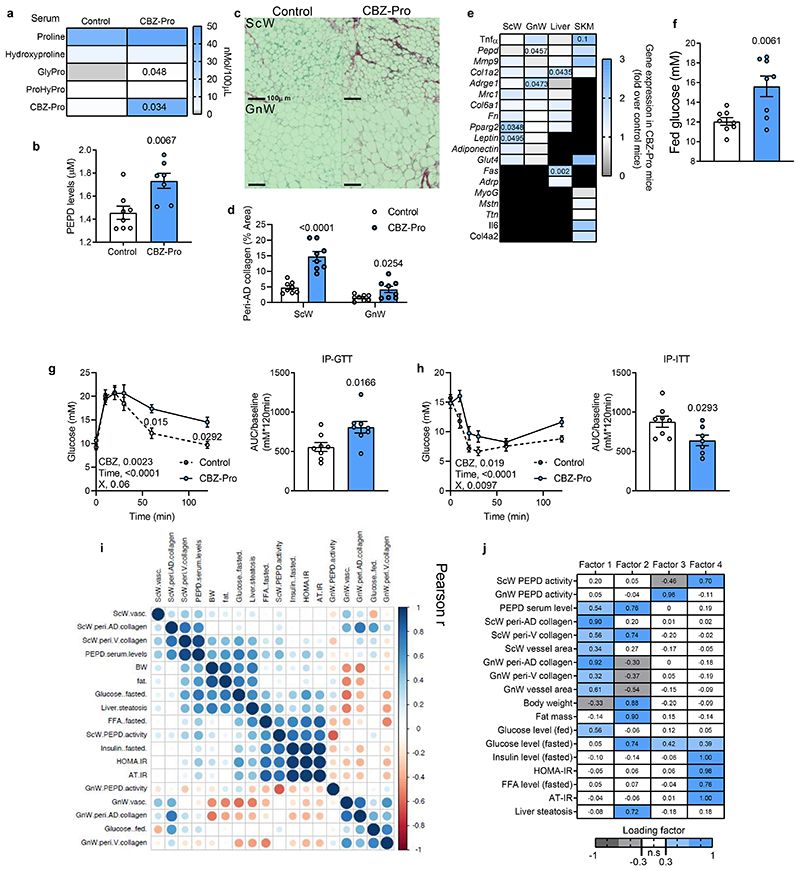
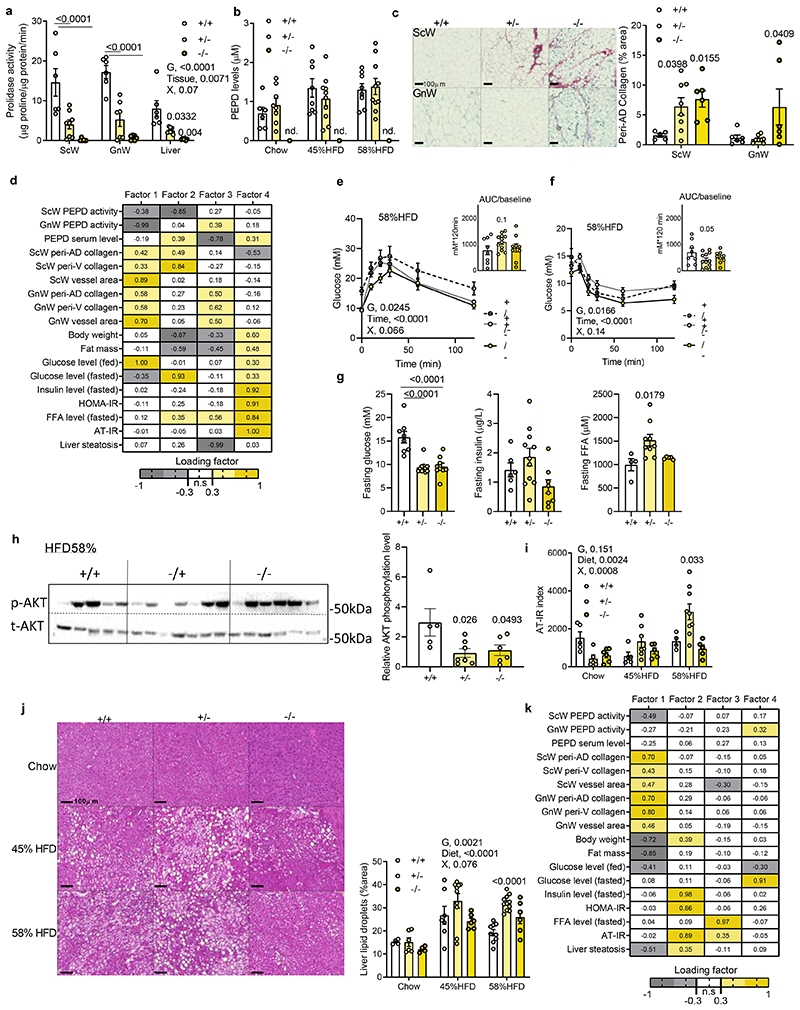
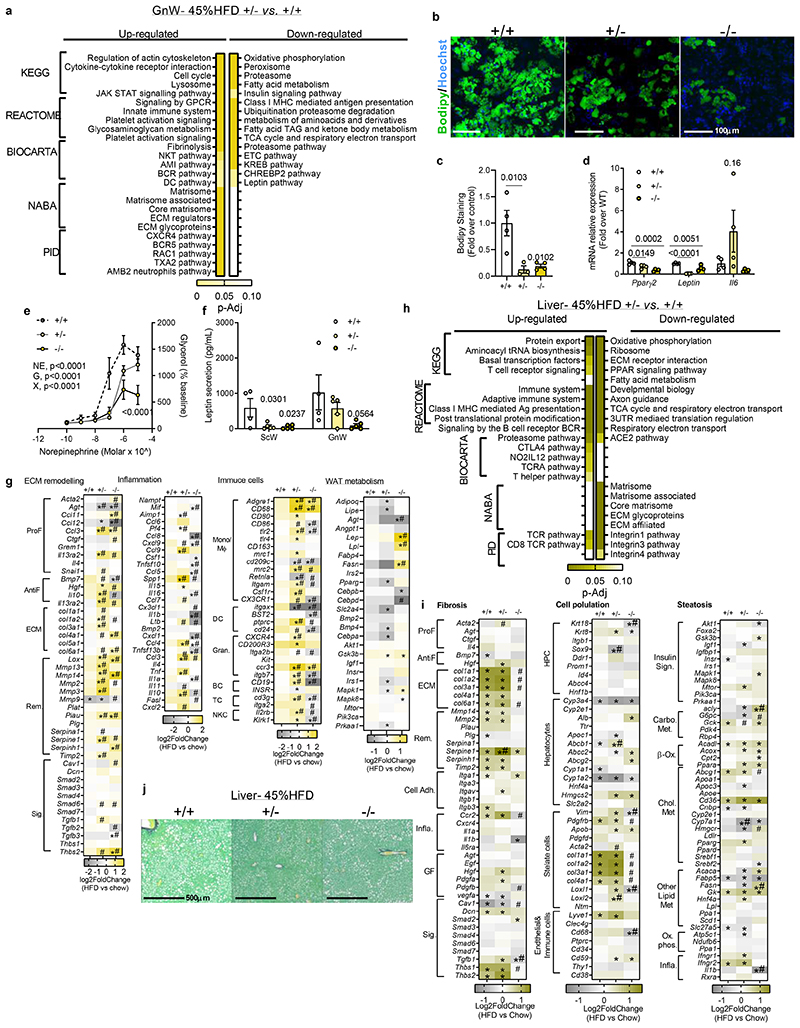
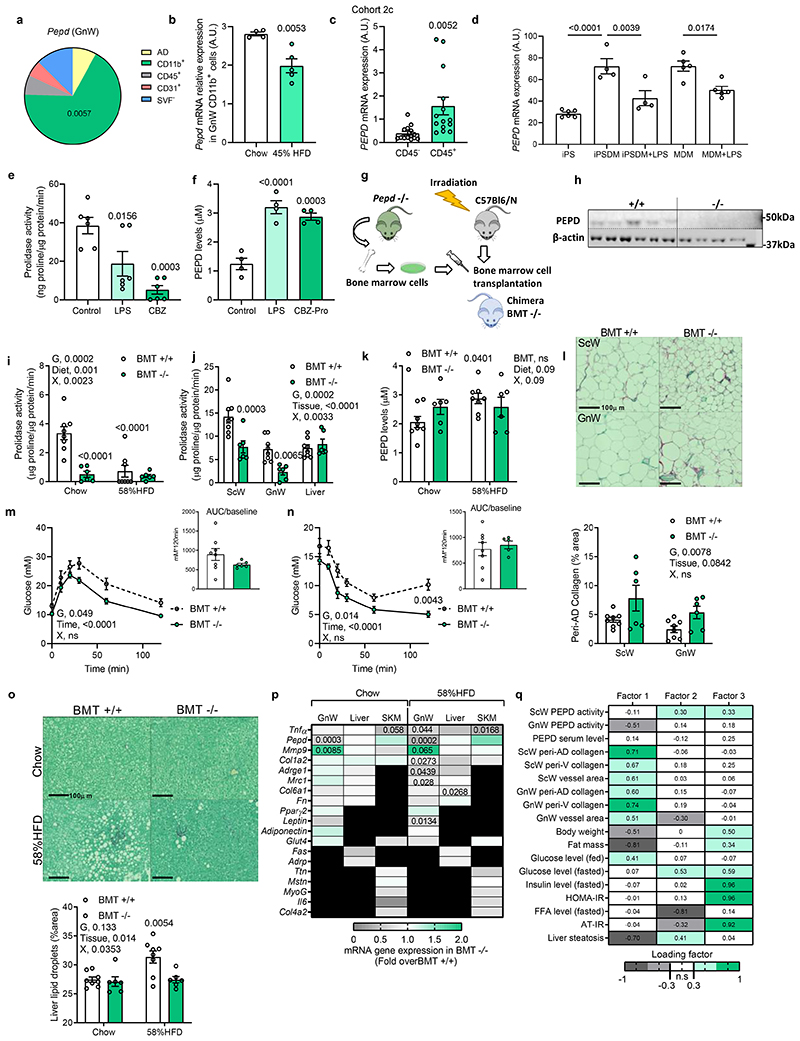
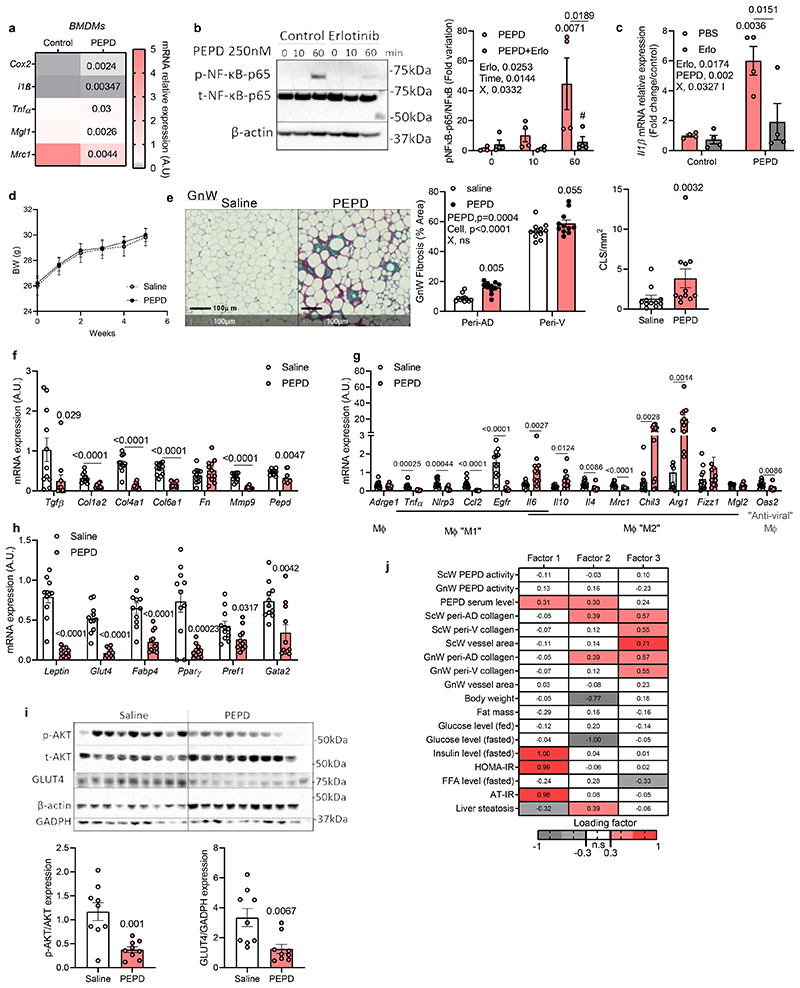
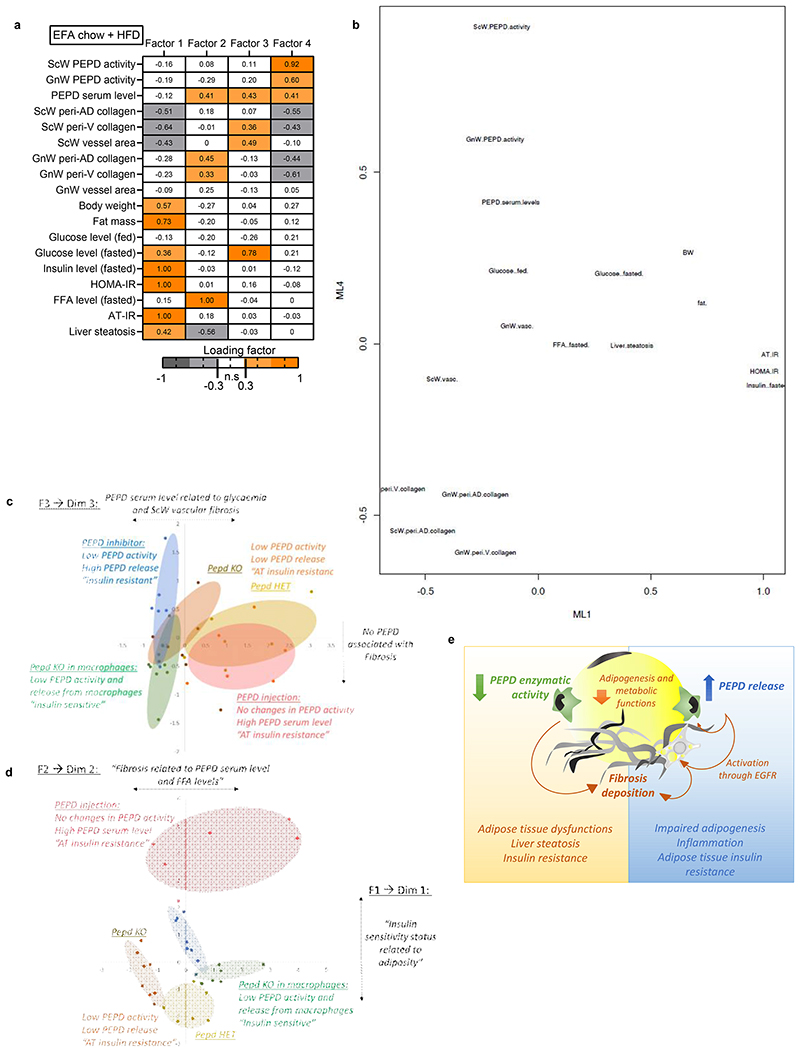
Resulting from impaired collagen turnover, fibrosis is a hallmark of adipose tissue (AT) dysfunction and obesity-associated insulin resistance (IR). Prolidase, also known as peptidase D (PEPD), plays a vital role in collagen turnover by degrading proline-containing dipeptides but its specific functional relevance in AT is unknown. Here we show that in human and mouse obesity, PEPD expression and activity decrease in AT, and PEPD is released into the systemic circulation, which promotes fibrosis and AT IR. Loss of the enzymatic function of PEPD by genetic ablation or pharmacological inhibition causes AT fibrosis in mice. In addition to its intracellular enzymatic role, secreted extracellular PEPD protein enhances macrophage and adipocyte fibro-inflammatory responses via EGFR signalling, thereby promoting AT fibrosis and IR. We further show that decreased prolidase activity is coupled with increased systemic levels of PEPD that act as a pathogenic trigger of AT fibrosis and IR. Thus, PEPD produced by macrophages might serve as a biomarker of AT fibro-inflammation and could represent a therapeutic target for AT fibrosis and obesity-associated IR and type 2 diabetes.


Conflict of interest statement

Declaration of interests

The authors declare no competing interests.

Figures

Extended Data Fig. 1
Extended Data Fig. 1. Obesity reduces AT PEPD activity and promotes PEPD release in association with AT fibrosis and insulin resistance
a, Age, BMI, glycaemic and lipidic status in the different human cohorts. b, PEPD serum/ScW levels, BMI and metabolic parameters in obese subjects from cohort cohort 2e (n=9) with low vs. high VsW PEPD levels. c, PEPD activity/ecplants levels, BMI, blood chemistry parameters and liver Actitest score in obese subjects (cohort 2e,f) with high (>2.065 nmol pro/mg prot/min) vs. low (<2.065 nmol pro/mg prot/min) PEPD peptidase activity in VsW. d, Area under the receiver operating curve (AUC) values (95% CI) for VsW and ScW PEPD peptidase activity (PA) to discriminate subjects with type 2 diabetes (cohort 2e,f).e, Pearson correlation between PEPD serum levels and, ScW and VsW ECM remodelling markers and metabolic parameters in obese subjects from cohort 2b (n=14 biologically independent samples). f, g, Pepd mRNA relative expression (f), and PEPD prolidase activity (g) in ScW, GnW and liver from C57Bl/6 mice in chow (n=6) and 58% HFD (n=8, 20 weeks) conditions.* compared to chow diet. h, ELISA analysis of PEPD protein in serum from C57/Bl6 mice fed chow (n=6) or 20 weeks 58% HFD (n=8). I-k. ScW prolidase activity (i), PEPD serum level (j) and ScW peri-ad collagen in C57Bl/6 mice fed 2, 8, 16 or 28 weeks (n=8/group) with chow diet (ch) of HFD 45% (HF). l, Prolidase activity in the serum of C57Bl6 mice fed chow (2, 28 weeks) or HFD 58% (28 weeks). m, Pearson correlation matrix between ScW and GnW ECM remodelling markers and metabolic parameters in chow and HFD conditions (n=22). Data presented as mean values +/- SEM. Data was analysed using a two-tailed Student’s t-test (b, c, h) or a 2-way ANOVA followed by a Sidak post-hoc multiple comparisons test (f, g, i-k).
Extended Data Fig. 2
Extended Data Fig. 2. PEPD pharmacological inhibition promotes AT fibro-inflammation independently from obesity
a-d. ALAT and ASAT serum levels (a), body weight (b), and fat mass % (c), and tissue weight (d) in mice treated 10 weeks or not (control) with CBZ-Pro (n=8 biologically independent animals per group). e, f. Fasting insulin and FFA blood levels from CBZ-Pro-treated mice compared to control mice (n=8 biologically independent animals per group) fed chow and HFD 58% for 16 weeks. g. Fasting insulin blood level before and 30min after glucose injection (2g/kg) in CBZ-Pro-treated mice compared to controls (n=8 biologically independent animals per group). h,i. Representative images of blots and quantification of total and basal phosphorylated (Ser473) AKT in GnW (h) and gastrocnemius muscle (i) of CBZ-Pro- treated mice compared to controls (n=8 biologically independent animals per group). j. Heat map representing the four factors extracted through exploratory factor analysis. The columns report the factors loadings of the observed variables. k. Representative images of red Sirius staining in ScW and GnW of control and CBZ-Pro treated mice (n=8 biologically independent animals per group) fed HFD 58%, and corresponding quantification of peri-adipocyte collagen content (peri-AD) represented in % Area (excluding perivascular staining). l, m. Blood glucose levels up to 120 min. after an intraperitoneal injection of glucose (2g/kg) in a glucose tolerance test (l) or insulin (0.75 IU/kg) in an insulin tolerance test (m) in control and CBZ-Pro treated mice (n=8 biologically independent animals per group) fed HFD 58%. Respective AUC are represented. Data is presented as mean values +/- SEM. Data was analysed using a two-tailed Student’s t-test (a-d, h, i l, m) or a 2-way ANOVA followed by a Turkey (e-g) or Sidak (k-m) post-hoc multiple comparisons test.
Extended Data Fig. 3
Extended Data Fig. 3. Pepd silencing promotes AT fibrosis but does not affect metabolic parameters in chow fed mice.
a. Pepd RNA relative expression in ScW, GnW, liver and gastrocnemius (SKM) from pepd WT (n=6), HET (n=8) and KO mice (n=5). b. Level of amino acids related to proline metabolism in the serum or GnW explant medium from pepd WT (n=6), HET (n=8) and KO mice (n=5). c-f, h, k. Body length (c), body weight (d), fat mass % (e), tissue weight (f), fed glucose, fasting glucose and FFA (blood levels h), and fasting insulin blood level (k) in pepd WT (n=6), HET (n=8) and KO (n=5) mice fed chow diet. g. Pearson correlations matrix between ScW and GnW ECM remodelling markers, PEPD serum levels and metabolic parameters in pepd mice fed chow (n=19 biologically independent samples). i, j. Blood glucose levels up to 120 minutes after an intraperitoneal injection of glucose (2g/kg) in a glucose tolerance test (i, IP-GTT) or insulin (0.75 IU/kg) in an insulin tolerance test (j, IP-ITT), and respective AUC adjusted to basal, in pepd WT (n=6), HET (n=8) and KO (n=5)mice fed chow diet. l-n. Representative images of blots and quantification of total and phosphorylated (Ser473) AKT in GnW (l), liver (m) and gastrocnemius (n) of pepd WT (n=6-11), HET (n=6-12) and KO n=6-8) mice fed chow diet after i.p injection of saline or insulin. 2way ANOVA with Dunnett’s (a) or Sidak’s (I, k, l-n) post-hoc multiple comparisons test; G, genotype; X, interaction. Data is presented as mean values +/- SEM. Data was analysed using a One way ANOVA followed by a Dunnett (b-f, h, k) or Sidak (i, j, l-n) post-hoc multiple comparisons test.
Extended Data Fig. 4
Extended Data Fig. 4. Pepd silencing exacerbates metabolic disturbances in HFD 58%-fed mice.
Body weight curves and fat mass % curves of pepd WT, HET and KO mice after 20 weeks HFD 45% (n=8, 11, 9 biologically independent animals per group, respectively) and HFD 58% (n=8, 11, 8 biologically independent animals per group, respectively). b, c. Blood glucose levels up to 120 min. after an intraperitoneal injection of glucose in a glucose tolerance test (b) or insulin (0.75 IU/kg) in an insulin tolerance test (c) with the representative AUC in pepd WT (n=9), HET (n-11) and KO (n=9) mice fed HFD 45%. d. Fasting glucose, insulin and FFA blood levels in pepd WT (n=8), HET (n=11) and KO (n=8) mice fed HFD 45%. e. Representative images of red Sirius staining in ScW and GnW from C57Bl/6 mice fed chow (n=6), 45%HFD (n=8) and HFD 58% (n=8, 20 weeks) conditions and quantification of peri-adipocyte collagen content (peri-AD) represented in % Area (excluding perivascular staining).f. Heat map of gene expression in GnW from C57Bl/6 mice fed 20 weeks with chow (n=6), 45%HFD (n=8) and HFD 58% (n=8). Results are expressed as fold change over chow diet. g. Representative images of blots and quantification of total and basal phosphorylated (Ser473) AKT in gastrocnemius muscle of pepd WT, HET and KO mice fed chow (n=5, 6, 5 biologically independent animals per group, respectively), and HFD 58% conditions (n= 5, 5, 7 biologically independent animals per group, respectively). h. Heat map of gene expression of fibro-inflammatory and functional markers in gastrocnemius of pepd WT, HET and KO mice fed chow (n=6, 7, 6 biologically independent animals per group, respectively), and HFD 58% conditions (n= 8, 7, 8 biologically independent animals per group, respectively). i. Heat map of gene expression in GnW from pepd WT, HET and KO fed HFD 45% (n=6, 10, 9 biologically independent animals per group, respectively) and HFD 58% (n=8, 9, 9 biologically independent animals per group, respectively) expressed as fold change variation over chow diet; *p<0.05 compared to chow, #p<0.05 compared to WT. j, k. Pathway enrichment analysis of the DEGs in GnW (i) and liver (j) from pepd KO mice (n=9) compared to WT mice (n=8) fed HFD 45%, using different data bases (KEGG, Reactome, Biocarta, NABA and PID). The heat maps indicate the level of significant changes (false discovery rate-adjusted p-value). Data is presented as mean values +/- SEM. Data was analysed using a 2-way ANOVA followed by a Turkey post-hoc multiple comparisons test; G, genotype; X, interaction (a-c, i), or a one way ANOVA followed by a Sidak (b, c, e) or Dunnett (d, g, h) post-hoc multiple comparisons test. A two-tailed Student’s t-test was also used to analyse the data (f).
Extended Data Fig. 5
Extended Data Fig. 5. Pepd silencing in hematopoietic cells prevent obesity and associated metabolic disturbances.
a. Prolidase activity in BMDMs during differentiation (n=4 biologically independent samples). b. Pepd mRNA relative expression in adipocytes (AD), Mϕ (CD11b positive cells) and negative stroma-vascular fraction (SVF-) isolated from GnW of WT (n=6) and LepOb/Ob mice (n=9). *compared to AD WT, # compared to Mϕ WT. c. Abundance of PEPD measured by mass spectrometry in unstimulated human iPS-derived Mϕ differentiated from FPS10C iPS line. Relative abundance of PEPD in comparison of other detected protein in the same sample is plotted in the graph-where actin and cyclin are representing examples of high and low abundant proteins respectively. d, e. Pepd mRNA expression (d) or PEPD ELISA in culture media from BMDMs treated or not (M0) 6h (d) or 24 (e) with LPS, dexamethasone (GC) or IL4 (n=4 biologically independent samples). BMDMs were treated with LPS for 1,6 or 24h: f, g. PEPD level in culture media (f) and prolidase activity in BMDMs (g). h. Prolidase activity in culture media from BMDMs treated without (control) or with LPS (100ng/ml, 24h) (n=4 biologically independent samples). I, j. Blood glucose levels up to 120 min. after an intraperitoneal injection of glucose (2g/kg) in a glucose tolerance test (i) or insulin (0.75 IU/kg) in an insulin tolerance test (j) in BMT WT (n=8) and KO mice (n=6) fed chow. Respective AUC are represented. k-n. Fasting glucose (k), fasting insulin (l), fasting FFA (m) and fed glucose (n) blood levels in BMT-WT (n=8) mice compared to BMTKO mice (n=6) fed chow and HFD 58% (20 weeks). . o, p. Tissue weight (o) and Fat mass % (p) in BMT +/+ (n=8) and -/- (n=6) mice fed chow and HFD 58% for 20 weeks. q. Body weight curve in BMT-WT (n=8) mice compared to BMTKO mice (n=6) mice between 0 and 20 weeks HFD 58%. r. Representative images of red Sirius staining ScW and GnW from BMT-WT (n=8) mice compared to BMTKO mice (n=6) fed HFD 58% and quantification of peri-AD collagen represented as %. s. Representative images of blots and quantification of total and basal phosphorylated (Ser473) AKT in GnW of of BMT WT and KO mice fed HFD 58% (n=6/group). Data is presented as mean values +/- SEM. Data was analysed using a One way ANOVA followed by a Dunnett (a, f, g) or Tuckey (d, e) post-hoc multiple comparisons test, or using a 2-way ANOVA followed by a Tukey (b, k—p, r) or Sidak (I, j, q) post-hoc multiple comparisons test; G, genotype; X, interaction. A two-tailed Student’s t-test was also used to analyse the data (h-j, s).
Extended Data Fig. 6
Extended Data Fig. 6. Purified PEPD protein promotes fibro-inflammation in macrophages through EGFR signalling
a. Cox2 mRNA relative expression in BMDMs treated or not (control) 4h with purified PEPD protein active or denaturated (denat PEPD) (n=3 biologically independent samples).b. Dose response effect of 4h treatment with purified PEPD protein on cox2 mRNA relative expression in BMDMs (n=4 biologically independent samples). c. % of cytotoxicity in BMDMs after 4h treatment with purified PEPD protein (n=4 biologically independent samples). d. Representative images of blots of total and phosphorylated (Ser 536) NF-kB protein and beta-tubulin in BMDMs (n=4 biologically independent samples) treated with purified PEPD protein (0, 10, 60min or 24h, 250nM). e, f. Tyrosine-kinase receptor phospho-Array of multiple analytes (e) and quantification (f) of phosphorylation levels in cell extract from BMDMs treated without (control) or with purified PEPD protein (10 min, 250nM). Data from one experiment of a pool of 4 independent macrophage preparations. g. Cox2 mRNA relative expression in BMDMs (n=4 biologically independent samples) pre-treated (Erlo) or not (PBS) with Erlotinib 5μM, prior 24h treatment with (PEPD) or without (control) purified PEPD protein. * compared to control PBS, # compared to PEPD PBS. h-j. mRNA expression of Egfr (h), Cox2 (i) and Il1β (j) in RAW macrophages transfected with Si-EGFR or its negative control (Si-NEG) prior treatment with (PEPD) or without (control) purified PEPD protein (250nM,24h). k. Tissue and cell distribution of egfr expression from Tabula muris DataBase; l, m. Heat map of Cox2 mRNA expression (l) and prolidase activity (m) in different tissues from C57Bl/6 mice injected with saline or purified PEPD (n=11 biologically independent animals per group). n-p. Fat mass (n), fasting glucose (o), free fatty acids (FFA, p) and insulin levels (p), and fed glucose level (p) in PEPD-injected mice compared to controls (n=11 biologically independent animals per group). q, r. Blood glucose levels up to 120 minutes after an intraperitoneal injection of glucose (2g/kg) in a glucose tolerance test (q, IP-GTT) or insulin (0.75 IU/kg) in an insulin tolerance test (r, IP-ITT) in PEPD-injected mice compared to controls (n=11 biologically independent animals per group). Data is presented as mean values +/- SEM. Data was analysed using a One-way ANOVA followed by a Dunnett (b, c) or Tuckey (a) post-hoc multiple comparisons test, or using a 2-way ANOVA followed by a Tukey (g, I, j) or Sidak (l-n, q, r) post-hoc multiple comparisons test. A two-tailed Student’s t-test was also used to analyse the data (h, o, p).
Extended Data Fig. 7
Extended Data Fig. 7. Purified PEPD protein promotes fibro-inflammation in pre-adipocytes and stellate cells through EGFR signaling.
a. Representative images of confocal analysis of anti-Collagen type I (in red,) and Bodipy staining (lipid accumulation in green) (i) and corresponding quantifications of collagen I staining (j) in 3T3-L1 adipocytes (n=4 biologically independent samples) pre-treated (Erlo) or not (PBS) with Erlotinib (5μM) prior treatment with (PEPD) or without (control) purified PEPD protein (250nM) during the first 5 days of adipogenic differentiation. * compared to control PBS, # compared to PEPD PBS. X, interaction. b. Il-6 level in culture media of mature adipocytes isolated from ScW of C57Bl/6 mice treated or not (control) with purified PEPD protein (250nM, 24h, n=6 biologically independent animals per group). c. Representative images of confocal analysis of anti-Collagen type IV (in green,) and Actin staining (in red) and corresponding quantifications of collagen IV staining in stellate cells (n=3 biologically independent samples) pre-treated (Erlo) or not (PBS) with Erlotinib (5μM) prior treatment with (PEPD) or without (control) purified PEPD protein (250nM). d. Gene expression profile in stellate cells (n=4) pre-treated (Erlo) or not (PBS) with Erlotinib (5μM) prior treatment with (PEPD) or without (control) purified PEPD protein (250nM). e. AST serum level in PEPD-injected mice compared to controls (n=11/group). f. Representative images of H&E and Sirius staining in the liver from PEPD-injected mice compaired to control (n=11 biologically independent animals per group, a), and quantification of lipid droplet (steatosis) and collagen contents (fibrosis). g. Liver gene expression profile in PEPD-injected mice compared to controls (n=11 biologically independent animals per group). h. Representative images of red Sirius staining in gastrocnemius from PEPD-injected mice compaired to control (n=11 biologically independent animals per group), and quantification of collagen content (fibrosis). i. Gastrocnemius gene expression profile in PEPD-injected mice compared to controls (n=11 biologically independent animals per group). j. Gene expression profile in muscle fibroblasts pre-treated (Erlo) or not (PBS) with Erlotinib (5μM) prior treatment with (PEPD) or without (control) purified PEPD protein (250nM, 5 days). k. Representative images of confocal analysis of anti-Collagen type I (in green,) and αSMA staining (in red), and corresponding quantifications of collagen I and αSMA stainings in muscle fibroblasts (n=4 biologically independent samples) pre-treated (Erlo) or not (PBS) with Erlotinib (5μM) prior treatment with (PEPD) or without (control) purified PEPD protein (250nM, 5 days). Data is presented as mean values +/- SEM. Data was analysed using a 2-way ANOVA followed by aTukey post-hoc multiple comparisons test (a, c, d, j, k), or using a two-tailed Student’s t-test (b, e-i).
Extended Data Fig. 8
Extended Data Fig. 8. High PEPD serum levels is associated with AT insulin resistance and drives the differences between the pharmacologic and genetic animal models of PEPD down-regulation.
a. Heat map representing the four factors extracted through EFA performed among mice fed chow. The columns report the factors loadings of the observed variables. b, c. Pearson correlation matrix between ScW and GnW ECM remodelling markers, PEPD serum levels and metabolic parameters in the mice from the four models (PEPD, CBZ-Pro, BMT and PEPD-injection) fed chow (b) or chow+HFD (c). Metabolic/fibro-inflammatory parameters from the four animal models (i.e. CBZ-Pro, PEPD, BMT and PEPD-injection) were plotted according to factor 1 and 3.
Figure 1
Figure 1. Obesity reduces AT PEPD activity and promotes PEPD release associated with AT fibrosis and insulin resistance.
a-c. PEPD gene expression in VsW from non-obese (n=26) and obese (n=58) subjects from cohort 1 (a), in ScW and VsW (visceral, omental depot) obese nondiabetic (Ob ND, 14) and diabetic (Ob D, n=8) subjects from cohort 2a, b (b, c). d. Pearson correlation matrix between ScW and VsW ECM remodelling markers and metabolic parameters in obese subjects from cohort 2b (n=14). e. Prolidase activity in ScW and VsW of obese diabetic (D, n=10) and non-diabetic(ND, n=12) subjects from cohort 2e, f. f. ELISA analysis of PEPD levels from VsW explants medium of obese diabetic (D, n=9) and non-diabetic (ND, n=12) subjects from cohort 2e, f. g. Area under the receiver operating curve (AUC) values (95% CI) for PEPD VsW and ScW levels from cohort 2e, f to discriminate subjects with type 2 diabetes. h. ELISA analysis of PEPD levels in serum from lean (n=9) and obese nondiabetic (ND) or diabetic (D, red dots) (n=9) subjects from cohort 2d, e. i. Area under the receiver operating curve (AUC) values (95% CI) for PEPD serum levels from Hyungwon Choi et al. cohortto discriminate subjects with insulin resistance. j, k. PEPD-protein correlations for Hyungwon Choi et al. cohort, shown as volcano plots (j) and GO enrichment analysis of the corresponding proteins (k). l. ELISA analysis of PEPD levels from tissue explants medium (i.e. BAT, ScW, GnW and liver) of C57/Bl6 mice fed chow or 20 weeks 58% HFD (n=4 biologically independent animals per group). m. Pearson correlations between PEPD serum levels and metabolic parameters in chow and HFD conditions (n=22 biologically independent animals). n. Area under the receiver operating curve (AUC) values (95% CI) for PEPD serum levels to predict a high degree of fibro-inflammation in GnW (i.e. GnW peri-AD collagen and GnW Tnfα expression) from mice fed chow and 58%HFD (n=34 biologically independent animals). Data are presented as mean values +/- SEM.*p<0.05 compared to non-obese (a), Ob ND (b), ScW(c), ND (f), lean (h), chow (l) using a two-tailed Student’s t-test. 2way ANOVA with Sidak’s post-hoc multiple comparisons test has been performed; Diab, diabetic status; X, interaction (e).
Figure 2
Figure 2. Pharmacological inhibition of PEPD promotes AT fibro-inflammation and insulin resistance in lean mice.
a, b, f. Proline metabolism-related amino acids serum level (a), PEPD serum levels (b) and fed glucose levels (f) in CBZ-Pro-treated mice and littermate’s controls (n=8 biologically independent animals per group). c, d. Representative images of red Sirius staining in ScW and GnW of control and CBZ-Pro treated mice (n=8 biologically independent animals per group) (c) and corresponding quantification (d) of peri-adipocyte collagen deposition represented in % Area (peri-AD collagen). g, h. Blood glucose levels up to 120 minutes after an intraperitoneal injection of glucose (2g/kg) in a glucose tolerance test (g) or insulin (0.75 IU/kg) in an insulin tolerance test (h) with the representative AUC (g) or AOC (h) in control and CBZ-Pro treated mice (n=8 biologically independent animals per group). i. Pearson correlations between ScW and GnW ECM remodelling markers, PEPD serum levels and metabolic parameters in control and CBZ-Pro-treated mice (n=16 biologically independent animals). j. Heat map representing the four factorsextracted through exploratory factor analysis. The columns report the factors loadings of the observed variables. Data are presented as mean values +/- SEM. *p<0.05 compared to control (a, b, d-h) using a two-tailed Student’s t-test. 2way ANOVA with Sidak’s post-hoc multiple comparisons tests (g, h) has been used.
Figure 3
Figure 3. Pepd silencing exacerbates AT fibro-inflammation and metabolic dysfunctions in DIO mice.
a. Prolidase activity in ScW, GnW and liver from pepd WT (n=6), HET (n=8) and KO mice (n=5); b. ELISA analysis of PEPD levels in the serum of pepd WT (6) and HET (10) fed chow. c. Representative images of red Sirius staining in ScW and GnW from pepd WT (n=6), HET (n=8) and KO (n=6) mice fed chow and quantification of peri-adipocyte collagen % area (peri-AD collagen). d, k. Heat map representing the four factors extracted through exploratory factor analysis in pepd mice fed chow (d) and HFD58% (k). The columns report the factors loadings of the observed variables. e, f. Blood glucose levels up to 120 min. after an intraperitoneal injection of glucose in a glucose tolerance test (e) or insulin (0.75 IU/kg) in an insulin tolerance test (f) with the representative AUC (e) or AOC (f) in pepd WT (n=8), HET (n=11) and KO (n=9) mice fed HFD 58%. g. Fasting glucose, insulin and FFA levels in pepd WT (n=8), HET (n=11) and KO (n=9) mice fed HFD 58%. h. Representative images of blots of total and phosphorylated (Ser 473) AKT protein and beta-Actin in GnW from pepd WT (n=8), HET (n-11) and KO (n=9) mice fed HFD 58%. i, AT-IR index in pepd WT, HET and KO mice in chow (n=6, 8, 6 biologically independent animals per group, respectively), 45%HFD (n=9, 11, 9 biologically independent animals per group, respectively) and HFD 58% conditions (n= 8,11,9 biologically independent animals per group, respectively). j, Representative images of H&E staining in liver from pepd WT, HET and KO mice fed chow (n=4, 6, 4, respectively), HFD 45% (n=7, 10, 6 biologically independent animals per group, respectively) and HFD 58% conditions (n= 9, 11, 6 biologically independent animals per group, respectively) and quantification of liver steatosis. k, Heat map representing the four factors extracted through exploratory factor analysis. The columns report the factors loadings of the observed variables. Data are presented as mean values +/- SEM. Data have been analysed using 2way ANOVA with Turkey’s post-hoc multiple comparisons test; G, genotype; X, interaction (a, b, e, f, i, j).*p<0.05 compared to +/+ using One way ANOVA with Sidak’s (e, f) or Dunnett’s (c, g, h) post-hoc multiple comparisons test.
Figure 4
Figure 4. “Fibro-inflammatory” and “AT dysfunction”-related pathways are enriched in the GnW from pepd HET mice.
a, h. Pathway enrichment analysis of the DEGs in GnW (a) and liver (h) from pepd HET (C, n=10) and KO (D, n=9) mice compared to WT mice (n=8) fed HFD 45%, using different data bases (KEGG, Reactome, Biocarta, NABA and PID). The heat maps indicate the level of significant changes (false discovery rate-adjusted p-value). b, c. Representative image of confocal analysis (Bodipy staining in green, b) and quantification of lipid accumulation (c) in primary differentiated adipocytes isolated from GnW of pepd WT, HET and KO mice (n=4 biologically independent animals per group). d. Gene expression in primary differentiated adipocytes isolated from GnW of pepd WT, HET and KO mice (n=4 biologically independent animals per group). e. Lipolytic dose-response curves for mature adipocytes isolated from GnW of from pepd WT (n=5), HET (n=7) and KO mice (n=6) in chow condition in response to 2h treatment with Norepinephrine. f. ELISA analysis of leptin secretion from ScW and GnW explants from pepd WT (n=4), HET (n=5) and KO (n=5) mice in chow condition. g, i. Heat maps of fibro-inflammatory- (g, i), metabolism- (g) and steatosis (i) -related DEGs in GnW (g) and liver (i) of pepd WT, HET and KO mice in HFD 45% (8, 10, 9 biologically independent animals per group, respectively) expressed as Log2 fold change (Log2FC) variation over chow diet (n=4, 8, 5 biologically independent animals per group, respectively). ProF (pro-fibrotic); AntiF (anti-fibrotic); Rem (ECM remodelling); Sig. (ECM-related signalling); Mono/Mϕ (monocyte/macrophage); DC (dendritic cell); Gran. (granulocyte); BC (B cell); TC (T cell); NKC (natural killer cell). j, Representative images of red Sirius staining in the liver from pepd WT (n=6), HET (n=8) and KO (n=6) mice fed HFD45%. Data are presented as mean values +/- SEM. *p<0.05 compared to WT using One way ANOVA with Dunnett’s post-hoc multiple comparisons test (c, d, f). 2way ANOVA with Turkey’s post-hoc multiple comparisons test has been used (e). *p-Adj<0.1, significant DEG compared to chow diet. #q<0.05 compared to pepd WT (+/+). Statistical analysis of the RNAseq data is detailed in the methods section.
Figure 5
Figure 5. Hematopoietic-specific pepd silencing reduced AT fibro-inflammation and improved insulin sensitivity in obese mice.
a. Pie chart illustration of Pepd mRNA relative expression distribution in GnW from C57Bl/6 mice fed a chow diet (n=4 biologically independent animals). AD, adipocytes; CD11b+, Mϕ; CD45+, immune cells; CD31+ endothelial cells and SVF-, negative stroma-vascular fraction. b. Pepd mRNA relative expression in CD11b positive fraction (MΦ) of the GnW from C57Bl/6 mice fed chow (n=4) and HFD 45% (n=5) (20 weeks). c. Pepd mRNA relativeexpression in CD45+ and CD45- cells isolated from VsW of obese subjects from cohort 2c (n=14 biologically independent samples). d. Global transcriptome of iPS cells (n=6), iPS-derived Mϕ (iPSDM, n=4), and monocyte-derived Mϕ MDM (n=5) were compared by RNAseq; and transcript per million (TPM) value of PEPD mRNA for each condition is plotted as bar diagram. iPSDM and MDM were treated with either 2.5 ng LPS for 6h or left untreated. e, f. Prolidase activity (e) and PEPD released level from BMDMs treated or not (control) 24h with LPS or CBZ-Pro (n=6 biologically independent samples per group).g. Scheme of the bone marrow transplant strategy. h, Representative image of western blot analysis of PEPD and Actin protein expression in BMDMs from pepd WT (n=5) and KO mice (n=4). i, j. Prolidase activity in peritoneal Mϕ (i), BAT, SCW, GnW, liver and SKM (gastrocnemius) (j) from BMT WT (n=8) mice compared to BMT KO mice (n=6). k. ELISA analysis of PEPD levels in the serum of BMT WT (n=8) and KO (n=6) mice fed chow and HFD 58%. l. Representative images of red Sirius staining ScW and GnW from BMT-WT (n=8) mice compared to BMTKO mice (n=6) fed chow and quantification of peri-AD collagen represented as %). m, n. Blood glucose levels up to 120 min. after an intraperitoneal injection of glucose (2g/kg) in a glucose tolerance test (m) or insulin (0.75 IU/kg) in an insulin tolerance test (n) in BMT WT (n=8) and KO mice (n=6) fed HFD 58% for 20 weeks. Respective AUC (m) or AOC (n) are represented. o. Representative images of red Sirius staining in Liver and quantification of liver steatosis expressed as % lipid droplets area in BMT WT (n=8) and KO mice (n=6) fed HFD 58% for 20 weeks. *Compared to BMT +/+ chow. #p<0.05 compared to BMT +/+ HFD 58%. p. Heat map of gene expression in GnW, liver and SKM (gastrocnemius) from BMTKO mice (n=6) fed chow and HFD 58% (20 weeks) expressed as fold change variation over BMT WT mice (n=8). q. Heat map representing the four factors extracted through exploratory factor analysis. The columns report the factors loadings of the observed variables. Data are presented as mean values +/- SEM. *p<0.05, compared to AD (a), control (e, f) using a One way ANOVA with Dunnett’s or Tukey’s (d) post-hoc multiple comparisons test. *p<0.05 compared to chow (b, c), BMT +/+ (m, n, p) using a two-tailed Student’s t-test. 2way ANOVA with Turkey’s (I, o), Sidak’s (j, l-n) or Dunnett’s (k) multiple comparisons test have been used; G, genotype; X, interaction.
Figure 6
Figure 6. Purified PEPD protein induces fibro-inflammation and AT insulin resistance.
a. Heat map of gene expression in BMDMs after 4h treatment with purified PEPD protein (n=4 biologically independent samples). b. Representative images of blots and quantification of total andphosphorylated (Ser 536) NF-kB protein and beta-Actin in BMDMs (n=4 biologically independent samples) pre-treated or not with Erlotinib (Erlo, 5μM) prior treatment with purified PEPD protein (0, 10 and 60min, 250nM), and quantification. *compared to PEPD 0min, # compared to PEPD 60min. X, interaction. c. IL1β mRNA relative expression in BMDMs (n=4 biologically independent samples) pre-treated (Erlo) or not (PBS) with Erlotinib 5μM prior treatment with (PEPD) or without (control) purified PEPD protein (250nM) for 24h. * compared to control PBS, # compared to PEPD PBS. d. Body weight curve in PEPD-treated mice compared to control (saline) mice (n=11 biologically independent animals per group) fed chow diet between 0 and 6 weeks treatment. e. Representative images of red Sirius staining in GnW PEPD-treated mice compared to control (saline) mice (n=11 biologically independent animals per group) fed chow diet and quantification of peri-AD collagen (represented as %) and crown like structures (CLS). f-h. mRNA expression of ECM remodelling (d), macrophage polarization markers (g) and adipocyte markers (h) in GnW (from PEPD-injected mice compared to controls (n=11 biologically independent animals per group). i. Representative images of blots of total and phosphorylated (Ser 473) AKT protein, GLUT4, GADPH and beta-Actin in GnW from PEPD-injected mice compared to controls (n=11 biologically independent animals per group). j. Heat map representing the four factors extracted through exploratory factor analysis. The columns report the factors loadings of the observed variables. Data are presented as mean values +/- SEM. *p<0.05 compared to control (a) or saline (e-i) using a two-tailed Student’s t-test. 2way ANOVA with Turkey’s (b, c) or Sidak’s (e) multiple comparisons test have been used; Erlo, Erlotinib; X, interaction.
Figure 7
Figure 7. High PEPD serum levels are associated with AT insulin resistance and drives the differences between the pharmacologic and genetic animal models of PEPD down-regulation.
a. Heat map representing the four factors extracted through EFA performed among the mice from the four animal models (i.e. PEPD, CBZ-Pro, BMT and PEPD-injection) fed chow+HFD. The columns report the factors loadings of the observed variables. b-d. Metabolic/fibro-inflammatory parameters (b) and mice from the four animal models (i.e. CBZ-Pro, PEPD, BMT and PEPD-injection) (c) were plotted according to factor 1 and 4 (b), to factor 1 and 2 (c), or factor 3 and 4 (d). e. Summary of proposed roles of PEPD in obesity-associated AT dysfunctions and metabolic complications.

References

    1. Sun K, Tordjman J, Clément K, Scherer PE. Fibrosis and adipose tissue dysfunction. Cell Metab. 2013;18:470–477. doi: 10.1016/j.cmet.2013.06.016. - DOI - PMC - PubMed
    1. Vidal-Puig A. Adipose tissue expandability, lipotoxicity and the metabolic syndrome. Endocrinol Nutr. 2013;60(Suppl 1):39–43. - PubMed
    1. Crewe C, An YA, Scherer PE. The ominous triad of adipose tissue dysfunction: inflammation, fibrosis, and impaired angiogenesis. J Clin Invest. 2017;127:74–82. doi: 10.1172/JCI88883. - DOI - PMC - PubMed
    1. Sorisky A, Molgat ASD, Gagnon A. Macrophage-induced adipose tissue dysfunction and the preadipocyte: should I stay (and differentiate) or should I go? Adv Nutr. 2013;4:67–75. doi: 10.3945/an.112.003020. - DOI - PMC - PubMed
    1. Abdennour M, et al. Association of Adipose Tissue and Liver Fibrosis with Tissue Stiffness in Morbid Obesity: Links with Diabetes and BMI Loss after Gastric Bypass. J Clin Endocrinol Metab. 2014:jc20133253. - PubMed

Publication types