. 2022 Jul;12(7):1388-1405.
doi: 10.1002/2211-5463.13418. Epub 2022 May 6.

The cytotoxic action of BCI is not dependent on its stated DUSP1 or DUSP6 targets in neuroblastoma cells

Affiliations

The cytotoxic action of BCI is not dependent on its stated DUSP1 or DUSP6 targets in neuroblastoma cells

Elliott M Thompson et al. FEBS Open Bio. 2022 Jul.

Abstract

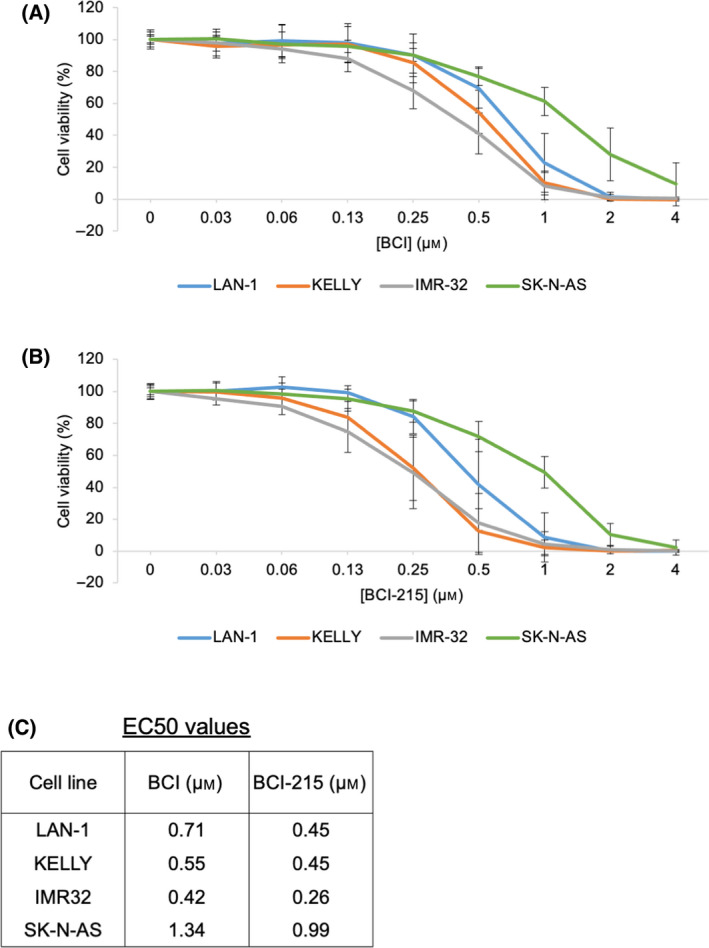
Neuroblastoma (NB) is a heterogeneous cancer of the sympathetic nervous system, which accounts for 7-10% of paediatric malignancies worldwide. Due to the lack of targetable molecular aberrations in NB, most treatment options remain relatively nonspecific. Here, we investigated the therapeutic potential of BCI, an inhibitor of DUSP1 and DUSP6, in cultured NB cells. BCI was cytotoxic in a range of NB cell lines and induced a short-lived activation of the AKT and stress-inducible MAP kinases, although ERK phosphorylation was unaffected. Furthermore, a phosphoproteomic screen identified significant upregulation of JNK signalling components and suppression in mTOR and R6K signalling. To assess the specificity of BCI, CRISPR-Cas9 was employed to introduce insertions and deletions in the DUSP1 and DUSP6 genes. Surprisingly, BCI remained fully cytotoxic in NB cells with complete loss of DUSP6 and partial depletion of DUSP1, suggesting that BCI exerts cytotoxicity in NB cells through a complex mechanism that is unrelated to these phosphatases. Overall, these data highlight the risk of using an inhibitor such as BCI as supposedly specific DUSP1/6, without understanding its full range of targets in cancer cells.

Keywords: CRISPR-Cas9; MAPK signalling; chemical inhibition; dual-specificity phosphatase; neuroblastoma; phosphoproteomics.


Conflict of interest statement

The authors declare no conflict of interest.

Figures

Fig. 1
Fig. 1
BCI and BCI‐215 are cytotoxic in a range of NB cell lines. NB cell line cells were treated with increasing doses of (A) BCI or (B) BCI‐215 followed by a cell viability assay. Data were normalised to cells treated with DMSO and then expressed as a mean ± SD (n ≥ 3) to generate the plotted curves. (C) Mean EC50 values were determined from the curves and are shown in the table.
Fig. 2
Fig. 2
BCI triggers apoptosis in KELLY cells (A) NB cells treated with 2 or 4 µm BCI for 3 days demonstrate a dose‐dependent increase in cellular cytotoxicity. Scale bar = 50 µm. (B) KELLY cells were treated with 2 or 4 µm BCI for 24 h and then cleaved Cas3 expression was identified via immunofluorescence. Selected images are representative examples. (C) Quantification of cleaved Cas3‐positive cells reveals that 4 µm BCI increases apoptosis after 24 h (n = 3). One‐way ANOVA compared with DMSO; ***P ≤ 0.0005. (D) Enlargement of white dashed boxes in B demonstrates nuclear fragmentation induced by 4 µm BCI. Scale bar = 50 µm.
Fig. 3
Fig. 3
BCI and BCI‐215 induce a short‐lived activation of the stress‐inducible MAPKs. (A) KELLY cells were treated with 2 µm BCI or BCI‐215 for 2, 4, 8 and 24 h and then assessed via an immunoblot for phosphorylated ERK (T185/Y187 (ERK1) or T202/Y204 (ERK2)), JNK (T183/Y185), p38 (T180/Y182) and AKT (S473) (n ≥ 3). Each detection is a re‐probe of the same membrane. Molecular sizes of 37 and 50 KDa markers are indicated. (B) For quantification, phosphoproteins were normalised to their respective total proteins, and data were then expressed as a mean ± SD. One‐way ANOVA compared with DMSO; *P ≤ 0.05.
Fig. 4
Fig. 4
JNK or p38 inhibition does not antagonise BCI‐mediated cell death. (A) KELLY cells were treated with increasing doses of a p38 inhibitor (SB202190) or a JNK inhibitor (SP600125) followed by a cell viability assay. Data were normalised to cells treated with DMSO and then expressed as a mean ± SD (n ≥ 3). (B) KELLY cells were treated for 6 days with a range of concentrations of either SB202190 (190) or SP600125 (125) concurrently with BCI, followed by a cell viability assay. Data are presented as synergy plots using the zero interaction potency (ZIP) model. Positive values (red regions) and negative values (green regions) are indicative of synergy and antagonism, respectively. The ZIP synergy score is an average of all the dose combination measurements. Data were generated using synergyfinder (v2.0) [23].
Fig. 5
Fig. 5
Phosphoproteomic analysis of NB cells after treatment with BCI. (A) Cells were cultured in the presence of 2 µm BCI for 2 h before lysates were collected and subject to pTyr and pSer/Thr phosphoproteomic analysis (n = 4). Significant thresholds for differential phosphorylation were set as Log2 fold change > 1 and P value < 0.1 (red data points). Volcano plots are shown of KELLY and IMR‐32 cells where each data point represents a phosphosite. (B) Venn diagram of significant phosphoproteins in IMR‐32 and KELLY cells.
Fig. 6
Fig. 6
Biological pathway enrichment of phosphoproteome after BCI treatment. Biological pathway enrichment was performed on differentially phosphorylated proteins using the FUNRICH platform. The top 15 differentially upregulated and downregulated pathways in (A) KELLY and (B) IMR‐32 cells are presented with the Bonferroni‐adjusted P values adjacent to each bar. Differentially phosphorylated proteins were identified in Fig. 5A (red data points).
Fig. 7
Fig. 7
Regulation of JNK and mTOR/R6K signalling pathways by BCI. (A) A KSEA was performed on the phosphoproteomic data. Enriched kinase substrates significant in one or both cell lines are shown. All kinase substrates identified are displayed in Dataset S2. Also shown are networks of proteins related to (B) JNK and (C) mTOR/S6K signalling based on STRING and visualised in Cytoscape. Inner and outer rings represent Log2 fold changes in KELLY and IMR‐32, respectively. Red to blue colour indicates increased and decreased Log2 fold change, respectively, with great colour intensity reflecting greater fold changes.
Fig. 8
Fig. 8
Generation of DUSP6‐null iKELLY and iIMR‐32 cells. (A) IMR‐32 and (B) KELLY cells were transduced with an inducible Cas9 expression vector under the control of a Dox‐inducible promoter, generating iIMR‐32 and iKELLY derivatives. Subsequent transfection of these cells with a DUSP6 gRNA and treatment with Dox resulted in a significant depletion of DUSP6 protein in the overall populations. Cells were treated with 0.5 µg·mL−1 Dox for 4–9 days (n = 3). Dividing line in B separates the identical exposure of two sections of the same membrane. For quantification, DUSP6 protein was normalised to GAPDH, and data were then expressed as a mean ± SD. (C) Removal of DUSP6 protein expression via CRISPR‐Cas9 was confirmed using immunoblots in two separate, single‐cell cloned sublines from iKELLY (KELD6‐1 and KELD6‐2) and one of iIMR‐32 cells (IMRD6‐1). (D) Sequence alignments of a region of the wild‐type DUSP6 sequence alongside both alleles in KELD6‐1 and KELD6‐2 and in IMRD6‐1 subclones. Highlighted in red is the DUSP6 gRNA sequence and the indels present in each subclone are displayed next to each alignment. Each vertically stacked set of immunoblots shows detections after reprobing the same membrane.
Fig. 9
Fig. 9
Loss of DUSP1 and DUSP6 does not attenuate BCI‐mediated cell death. (A) IKELLY and iIMR‐32 cells and DUSP6‐null subclones IMRD6‐1 and KELD6‐1 were treated with increasing doses of BCI, and cell viability assays were performed. An independent‐samples t‐test was performed at ~EC50 values (0.5 and 0.25 µm for iKELLY and iIMR‐32 cells, respectively) and was not significant. (B) ICE analysis of mixed populations, showing indel frequencies in the DUSP1 gene in iKELLY, KELD6‐1 and KELD6‐2 after transfection with the DUSP1 gRNA (n = 3). (C) Derivatives of iKELLY wild‐type cells and DUSP6‐null subclones KELD6‐1 and KELD6‐2 containing (i) mixed population indels in the DUSP1 gene or (ii) control populations treated with empty, negative control plasmid, were subject to BCI treatment and a cell viability assay. Data were normalised to cells treated with DMSO and then expressed as a mean ± SD (n ≥ 3). A one‐way ANOVA was performed and comparisons between equivalent BCI treatments showed no significant changes.

References

    1. Brodeur GM. Neuroblastoma: biological insights into a clinical enigma. Nat Rev Cancer. 2003;3:203. - PubMed
    1. Kholodenko IV, Kalinovsky DV, Doronin II, Deyev SM, Kholodenko RV. Neuroblastoma origin and therapeutic targets for immunotherapy. J Immunol Res. 2018;2018:7394268. - PMC - PubMed
    1. Park JR, Bagatell R, London WB, Maris JM, Cohn SL, Mattay KM, et al. Children's Oncology Group's 2013 blueprint for research: neuroblastoma. Pediatr Blood Cancer. 2013;60:985–93. - PubMed
    1. Pinto NR, Applebaum MA, Volchenboum SL, Matthay KK, London WB, Ambros PF, et al. Advances in risk classification and treatment strategies for neuroblastoma. J Clin Oncol. 2015;33:3008. - PMC - PubMed
    1. Tolbert VP, Matthay KK. Neuroblastoma: clinical and biological approach to risk stratification and treatment. Cell Tissue Res. 2018;372:195–209. - PMC - PubMed

Publication types

MeSH terms