. 2021 Jun 21;11(35):21760-21766.
doi: 10.1039/d1ra03615g. eCollection 2021 Jun 15.

Enzyme cascade-amplified immunoassay based on the nanobody-alkaline phosphatase fusion and MnO2 nanosheets for the detection of ochratoxin A in coffee

Affiliations

Enzyme cascade-amplified immunoassay based on the nanobody-alkaline phosphatase fusion and MnO2 nanosheets for the detection of ochratoxin A in coffee

Zeling Zhang et al. RSC Adv. .

Abstract

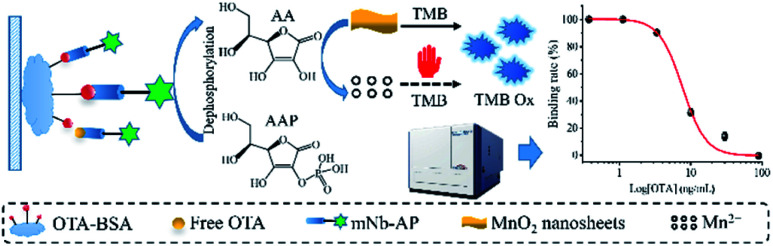
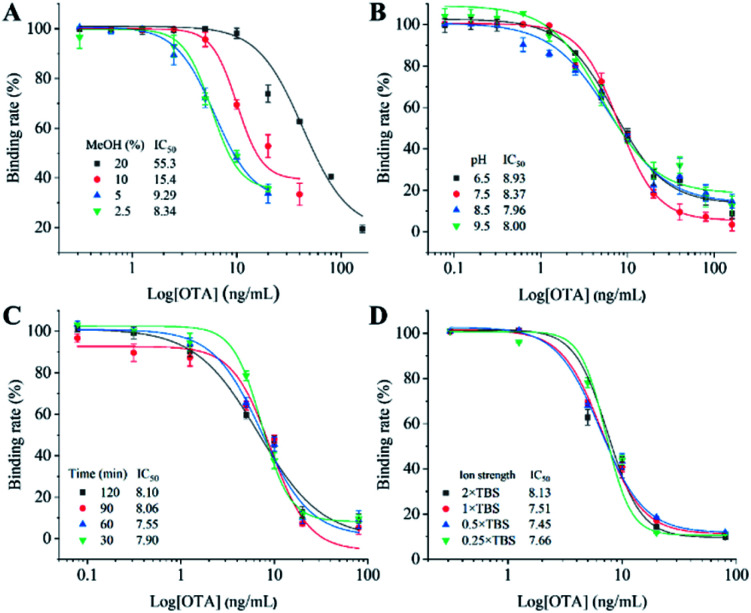
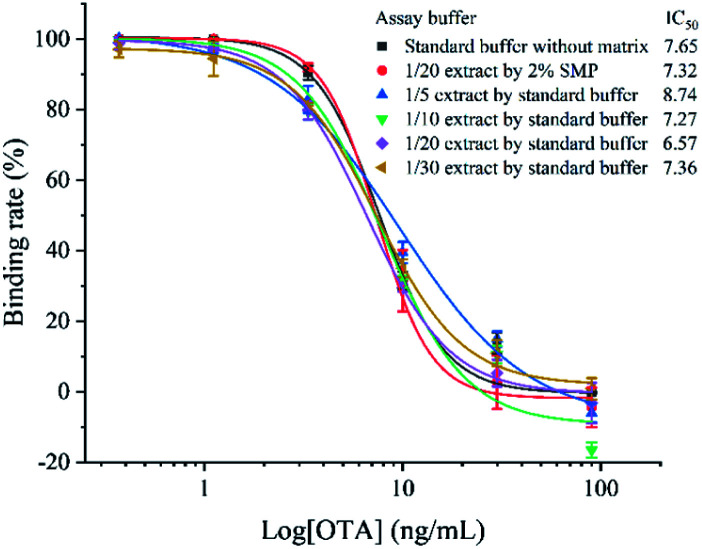
Ochratoxin A (OTA) is a common food contaminant with multiple toxicities and thus rapid and accurate detection of OTA is indispensable to minimize the threat of OTA to public health. Herein a novel enzyme cascade-amplified immunoassay (ECAIA) based on the mutated nanobody-alkaline phosphatase fusion (mNb-AP) and MnO2 nanosheets was established for detecting OTA in coffee. The detection principle is that the dual functional mNb-AP could specifically recognize OTA and dephosphorylate the ascorbic acid-2-phosphate (AAP) into ascorbic acid (AA), and the MnO2 nanosheets mimicking the oxidase could be reduced by AA into Mn2+ and catalyze the 3,3',5,5'-tetramethyl benzidine into blue oxidized product for quantification. Using the optimal conditions, the ECAIA could be finished within 132.5 min and shows a limit of detection of 3.38 ng mL-1 (IC10) with an IC50 of 7.65 ng mL-1 and a linear range (IC20-IC80) of 4.55-12.85 ng mL-1. The ECAIA is highly selective for OTA. Good recovery rates (84.3-113%) with a relative standard deviation of 1.3-3% were obtained and confirmed by high performance liquid chromatography with a fluorescence detector. The developed ECAIA was demonstrated to be a useful tool for the detection of OTA in coffee which provides a reference for the analysis of other toxic small molecules.


Conflict of interest statement

There are no conflicts to declare.

Figures

Scheme 1
Scheme 1. Schematic illustration of the enzyme cascade-amplified immunoassay based on Nb–AP fusion and MnO2 nanosheets for colorimetric detection of OTA in coffee.
Fig. 1
Fig. 1. Construction and characterization of the mNb–AP. (A) Analysis of the amplified gene fragments by DNA agarose gel electrophoresis. Lane 1: mNb gene, lane 2: AP gene, lane 3: assembled Nb–linker–AP fragment by SOE-PCR; lane M: DNA ladder; (B) SDS-PAGE analysis of the mNb–AP. Lane M: protein ladder; lane 1: whole cell proteins before auto-induction, lane 2: whole cell proteins after auto-induction, lane 3: supernatant of broken auto-induced cells by ultrasonication; lane 4: purified mNb–AP by Ni-NTA resin; (C) western blot analysis of the mNb–AP. Lane M: protein ladder; lane 1: purified mNb–AP.
Fig. 2
Fig. 2. UV-vis absorption spectra and corresponding photographs (inset) of different combinations of the components in the colorimetric sensing system. (a) mNb–AP; (b) MnO2 nanosheets; (c) TMB; (d) AAP + MnO2 nanosheets; (e) Mn2+ + TMB; (f) MnO2 nanosheets + TMB; (g) MnO2 nanosheets + AA + TMB; (h) MnO2 nanosheets + AAP + TMB; (i) mNb–AP + MnO2 nanosheets + AAP + TMB. The working conditions are listed as follows: 0.25 μM AAP, 250 μM MnO2 nanosheets, 250 μM TMB, 2.5 μM AA, 250 μM Mn2+, 0.066 μg mL−1 mNb–AP, 50 mM Tris–HCl containing 5 mM MgCl2 (pH 10.0), and 40 mM NaAc-HAc (pH 3.8).
Fig. 3
Fig. 3. Analytical performance of the optimized colorimetric sensing system for mNb–AP. (A) Absorption spectra of the colorimetric system with different concentrations of mNb–AP; (B) plot of the difference of absorbance at 650 nm (ΔA) versus the concentration of mNb–AP. Inset: correlation analysis between the ΔA and the concentration of mNb–AP with the regression equation of y = 0.00117 + 0.09301x (R2 = 0.99868). Error bars denote the standard deviations of three independent experiments.
Fig. 4
Fig. 4. Evaluation of the effects of methanol (A), pH (B), competitive reaction time (C), and ion strength (D) on the performance of the ECAIA. Error bars denote the standard deviations of three independent experiments.
Fig. 5
Fig. 5. Standard competitive inhibition curves of the NSH-EIA for OTA based on the standard buffer, 20-fold diluted coffee extract using 2% SMP, and different dilutions of coffee extract by standard assay.

Similar articles

Cited by

References

    1. Van Der Merwe K. J. Steyn P. S. Fourie L. Scott D. B. Theron J. J. Nature. 1965;205:1112–1113. doi: 10.1038/2051112a0. - DOI - PubMed
    1. Amézqueta S. Schorr-Galindo S. Murillo-Arbizu M. González-Peñas E. López de Cerain A. Guiraud J. P. Food Control. 2012;26:259–268. doi: 10.1016/j.foodcont.2012.01.042. - DOI
    1. Malir F. Ostry V. Pfohl-Leszkowicz A. Malir J. Toman J. Toxins. 2016;8:191. doi: 10.3390/toxins8070191. - DOI - PMC - PubMed
    1. International Agency for Research on Cancer (IARC), 1993
    1. Zhang X. Li M. Cheng Z. Ma L. Zhao L. Li J. Food Chem. 2019;297:124850. doi: 10.1016/j.foodchem.2019.05.124. - DOI - PubMed