. 2022 Mar 18:10:817180.
doi: 10.3389/fcell.2022.817180. eCollection 2022.

Therapeutic Potential of Stem Cell-Derived Extracellular Vesicles on Atherosclerosis-Induced Vascular Dysfunction and Its Key Molecular Players

Affiliations

Therapeutic Potential of Stem Cell-Derived Extracellular Vesicles on Atherosclerosis-Induced Vascular Dysfunction and Its Key Molecular Players

Ioana Karla Comariţa et al. Front Cell Dev Biol. .

Abstract

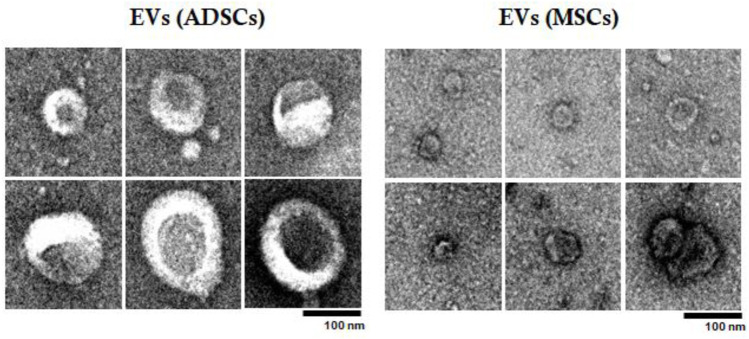
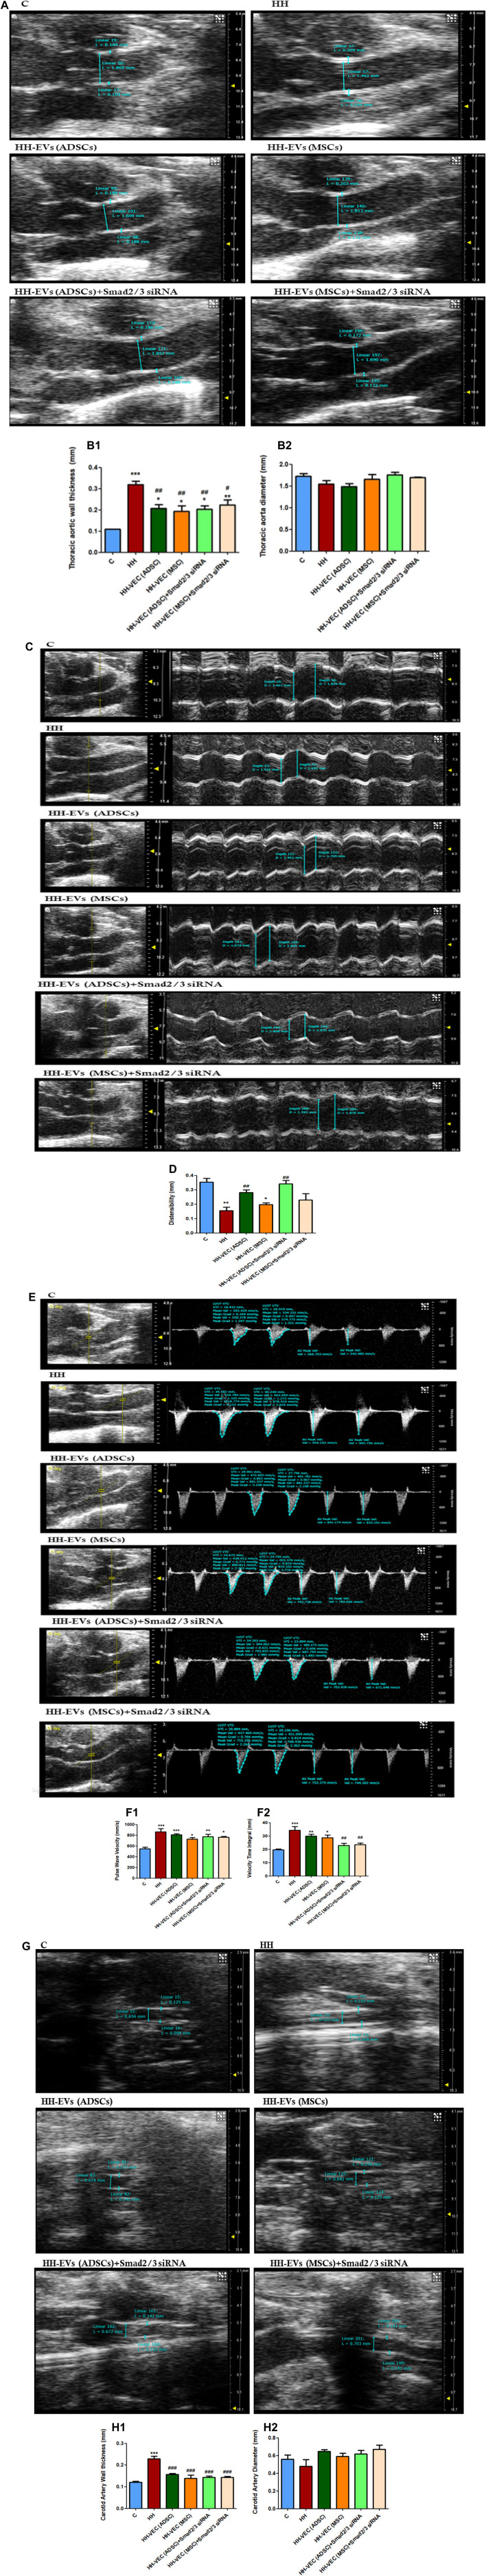
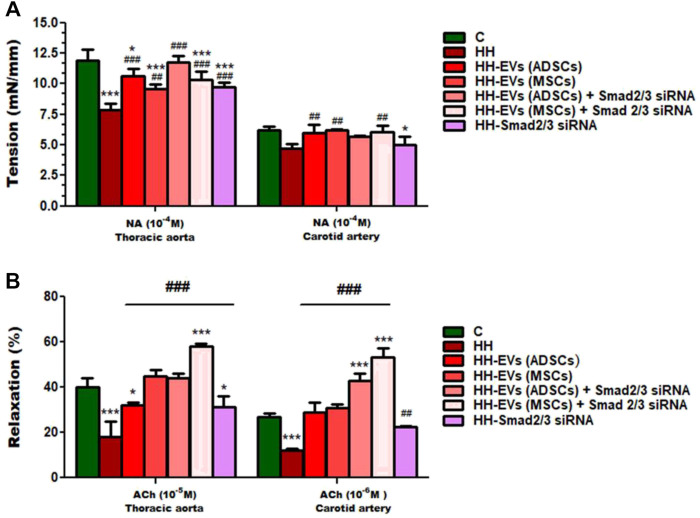
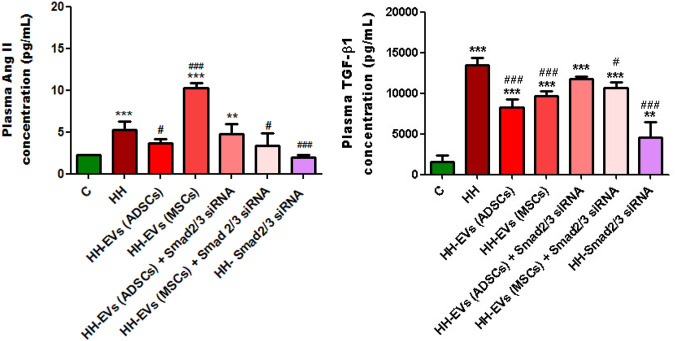
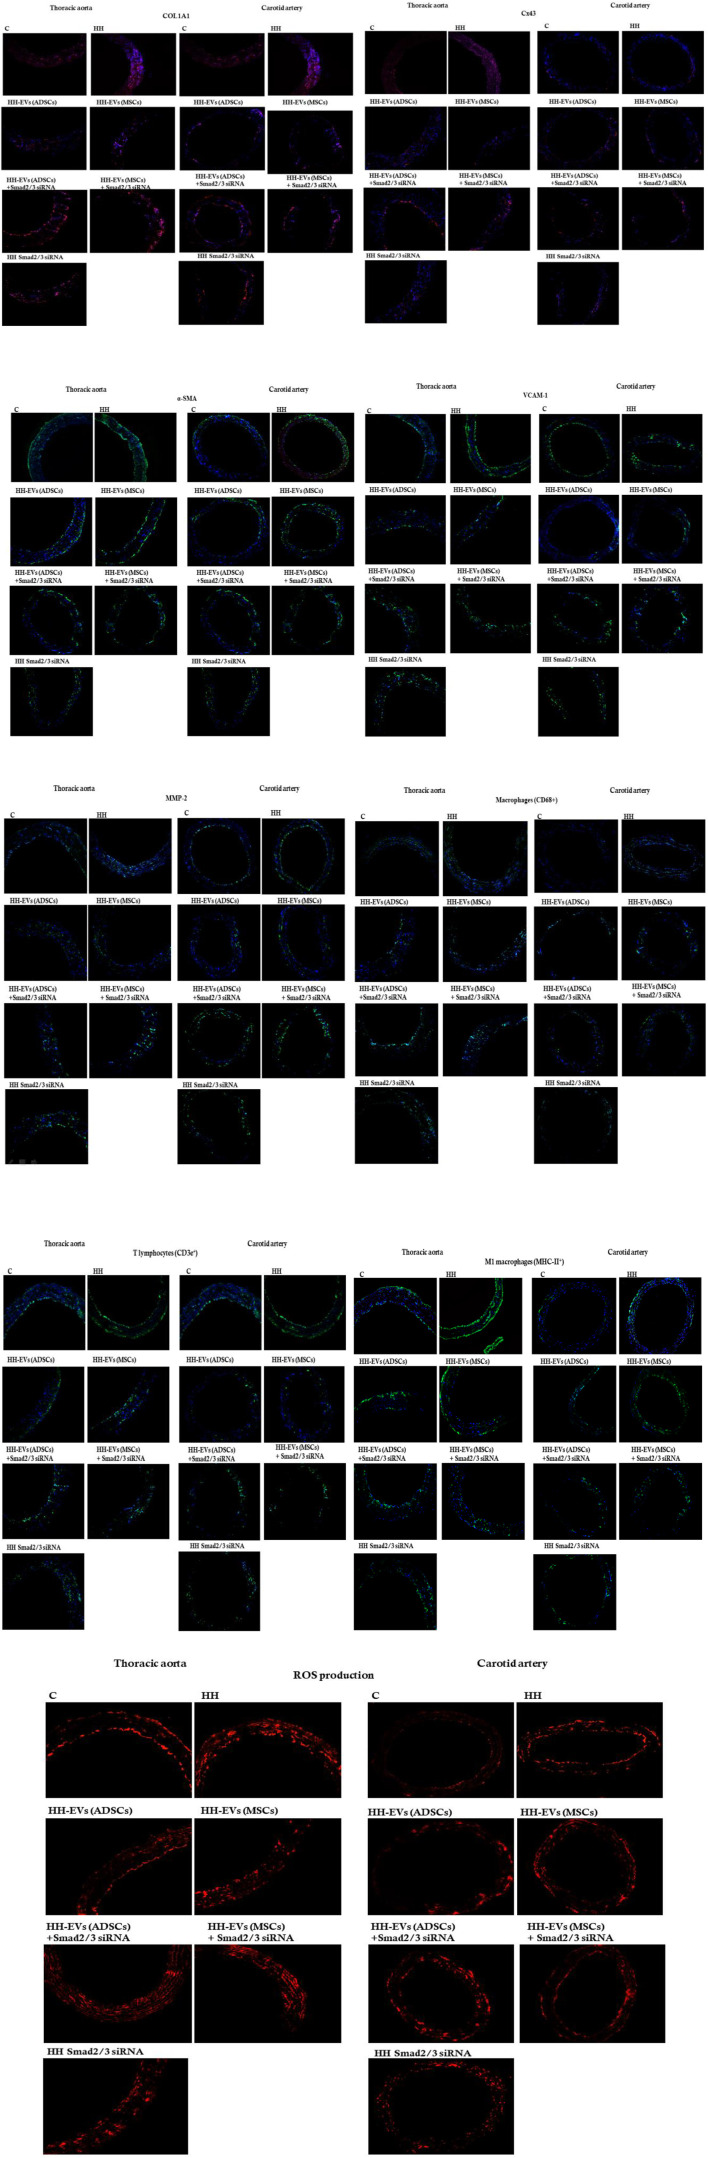
Atherosclerosis is a progressive, chronic inflammatory disease of the large arteries caused by the constant accumulation of cholesterol, followed by endothelial dysfunction and vascular inflammation. We hypothesized that delivery of extracellular vesicles (EVs), recognized for their potential as therapeutic targets and tools, could restore vascular function in atherosclerosis. We explored by comparison the potential beneficial effects of EVs from subcutaneous adipose tissue stem cells (EVs (ADSCs)) or bone marrow mesenchymal stem cells (EVs (MSCs)) on the consequences of atherogenic diet on vascular health. Also, the influences of siRNA-targeting Smad2/3 (Smad2/3siRNA) on endothelial dysfunction and its key molecular players were analyzed. For this study, an animal model of atherosclerosis (HH) was transplanted with EVs (ADSCs) or EVs (MSCs) transfected or not with Smad2/3siRNA. For controls, healthy or HH animals were used. The results indicated that by comparison with the HH group, the treatment with EVs(ADSCs) or EVs(MSCs) alone or in combination with Smad2/3siRNA of HH animals induced a significant decrease in the main plasma parameters and a noticeable improvement in the structure and function of the thoracic aorta and carotid artery along with a decrease in the selected molecular and cellular targets mediating their changes in atherosclerosis: 1) a decrease in expression of structural and inflammatory markers COL1A1, α-SMA, Cx43, VCAM-1, and MMP-2; 2) a slight infiltration of total/M1 macrophages and T-cells; 3) a reduced level of cytosolic ROS production; 4) a significant diminution in plasma concentrations of TGF-β1 and Ang II proteins; 5) significant structural and functional improvements (thinning of the arterial wall, increase of the inner diameter, enhanced distensibility, diminished VTI and Vel, and augmented contractile and relaxation responses); 6) a reduced protein expression profile of Smad2/3, ATF-2, and NF-kBp50/p65 and a significant decrease in the expression levels of miR-21, miR-29a, miR-192, miR-200b, miR-210, and miR-146a. We can conclude that 1) stem cell-derived EV therapies, especially the EVs (ADSCs) led to regression of structural and functional changes in the vascular wall and of key orchestrator expression in the atherosclerosis-induced endothelial dysfunction; 2) transfection of EVs with Smad2/3siRNA amplified the ability of EVs(ADSCs) or EVs(MSCs) to regress the inflammation-mediated atherosclerotic process.

Keywords: atherosclerosis; cardiovascular diseases; extracellular vesicles; inflammation; siRNA Smad2/3; vascular dysfunction.


Conflict of interest statement

The authors declare that the research was conducted in the absence of any commercial or financial relationships that could be construed as a potential conflict of interest.

Figures

FIGURE 1
FIGURE 1
Schematic representation of experimental animal models obtained for a period of 4 months. Golden Syrian hamsters (67 males and 3 months old) were divided into seven experimental groups: (1) control (C group); (2) simultaneously hypertensive–hyperlipidemic (HH group); (3,4) HH hamsters with retro-orbital sinus injection containing 100 μg/ml EVs from both ADSCs and BM-MSCs (HH-EVs (ADSCs) group and HH-EVs (MSCs) group)); (5,6) HH hamsters with retro-orbital sinus injection containing 100 μg/ml EVs (from ADSCs or BM-MSCs) transfected with 100 nM Smad2/3 siRNA (HH-EVs (ADSCs)+Smad2/3 siRNA group and HH-EVs (MSCs)+ Smad2/3 siRNA group); (7) HH hamsters with subcutaneous injection containing 100 nM Smad2/3 siRNA (HH-Smad2/3 siRNA group). The HH group was obtained by combining the atherogenic and high-salt diet.
FIGURE 2
FIGURE 2
Particle size distribution of EVs secreted in the culture medium by ADSCs and BM-MSCs showed two different populations represented by the two peaks; the first peak at the small size range (∼50–100 nm) specific to exosomes and the second at the high-size range (∼100–1000 nm) specific to microvesicles (Y-axis represents the number of EVs, and the X-axis represents the size of EVs).
FIGURE 3
FIGURE 3
Detection and characterization by flow cytometry of EVs isolated from the culture medium from ADSCs/BM-MSCs of healthy hamsters highlight the presence of both exosomes (CD63+, CD9+, and CD81+) and microvesicles (AnnexinV+). (A) Representative dot plots double-stained with purified EVs from ADSC fraction with CD81+ (labeled with PE)/Annexin V+ (labeled with FITC), CD9+ (labeled with PE)/Annexin V+ (labeled with FITC), and CD63+ (labeled with AF647)/Annexin V+ (labeled with FITC); (B) representative dot plots double-stained with purified EVs from the BM-MSC fraction with CD81+ (labeled with PE)/Annexin V+ (labeled with FITC), CD9+ (labeled with PE)/Annexin V+ (labeled with FITC), and CD63+ (labeled with AF647)/Annexin V+ (labeled with FITC) (C) Percentage of EV specific markers for both exosomes and microvesicles.
FIGURE 4
FIGURE 4
Examination of EVs (ADSCs) and EVs (MSCs) by transmission electron microscopy (TEM). EVs were collected from the secretome of healthy hamster adipose tissue-derived stem cells (ADSCs) or of bone marrow-derived stem cells (BM-MSCs). The effect of atherogenic diet and treatment on main plasma parameters were investigated.
FIGURE 5
FIGURE 5
Changes in the blood flow and structure of the thoracic aorta and carotid artery were isolated from the investigated experimental groups (C, HH, HH-EVs(ADSCs), HH-EVs(MSCs), HH-EVs(ADSCs)+Smad2/3siRNA, and HH-EVs(MSCs)+Smad2/3siRNA) as a measure of vascular rigidity. (A) Representative B-mode recordings, which highlight the wall thickness and the inner diameter of the thoracic aorta; (B) graphical representation of wall thickness (mm) (B.1) and inner diameter (mm) (B.2) in the case of the thoracic aorta; (C) representative records obtained in M-mode, which highlight the diameter in systole and diastole of the thoracic aorta; (D) graphical representation of thoracic aortic distensibility (mm); (E) representative recordings obtained in pulsed Doppler-mode, which highlight the velocity time integral (VTI) and velocity (Vel) of the thoracic aorta; (F) graphical representation of velocity (mm/s) (F.1) and velocity time integral (mm) (F.2) at the level of the thoracic aorta; (G) representative B-mode recordings, which highlight the wall thickness and the inner diameter of the carotid artery; (H) graphical representation of wall thickness (mm) (H.1) and inner diameter (mm) (H.2) in the case of the carotid artery. Data are shown as the mean ± SD of each experimental group after 4 months of diet and treatment. The statistical significance, noticeably different, is represented as ***p < 0.005, **p < 0.01, *p < 0.05 versus control group and ### p < 0.005, ## p < 0.01, # p < 0.05 versus HH group. The values were calculated by two-way ANOVA and Bonferroni post-test.
FIGURE 6
FIGURE 6
Representative images with myograph recordings at selected time points: for the contraction function to NA (10−8 M ÷ 10−4 M) and relaxation to ACh (10−8 M ÷ 10−4 M) in the thoracic aorta (red) and carotid artery (purple) in all investigated experimental groups: C, HH, HH-EVs(ADSCs), HH-EVs(MSCs), HH-EVs(ADSCs)+Smad2/3siRNA, HH-EVs(MSCs)+Smad2/3siRNA, and HH-Smad2/3siRNA. Images were recorded with LabChart 7 software.
FIGURE 7
FIGURE 7
Measures of vascular reactivity of the thoracic aorta (left) and carotid artery (right) explanted from all hamster groups (C, HH, HH-EVs(ADSCs), HH-EVs(MSCs), HH-EVs(ADSCs)+Smad2/3siRNA, HH-EVs(MSCs)+Smad2/3siRNA, and HH-Smad2/3siRNA) by using the myograph technique, in terms of (A) contraction to NA and (B) relaxation to ACh. Maximal contractile force developed by the thoracic aorta and carotid artery was measured to be 10−4 M NA, and maximal relaxation values were recorded to be 10−5 M ACh for the thoracic aorta and 10−6 M ACh for the carotid artery. Data are mean ± SD of four independent experiments for each investigated treated group and five independent experiments for control and HH groups. The statistical significance, noticeably different, was represented as ***p < 0.005 and *p < 0.05 versus control group and ### p < 0.005 and ## p < 0.01 versus HH group. The values were calculated by two-way ANOVA and Bonferroni post-test. Enhanced plasma TGF-β1 and AngII levels in atherosclerosis are reduced after the administration of EVs (ADSCs) or EVs (MSCs) transfected or not with Smad2/3 siRNA.
FIGURE 8
FIGURE 8
Analysis of plasma TGF-β1 and AngII levels by the enzyme-linked immunosorbent assay (ELISA) method, for all experimental groups: C, HH, HH-EVs(ADSCs), HH-EVs(MSCs), HH-EVs(ADSCs)+Smad2/3siRNA, HH-EVs(MSCs)+Smad2/3siRNA, and HH-Smad2/3siRNA. The measurements were performed in triplicate, and the results were depicted as mean ± SD. The statistical significance, noticeably different, was represented as ***p < 0.005, **p < 0.01 versus control group and ### p < 0.005, # p < 0.05 versus HH group. The values were calculated by two-way ANOVA and Bonferroni post-test.
FIGURE 9
FIGURE 9
Representative immunofluorescence images for the evaluation of inflammatory markers specific to vascular dysfunction after 4 months of the hyperlipemic–hypertensive diet and the stem cell-derived EV-based treatment or siRNA-based treatment. The thin cryosections from the thoracic aorta (on the left) and carotid artery (on the right) harvested from all experimental groups (C, HH, HH-EVs (ADSCs), HH-EVs (MSCs), HH-EVs(ADSCs)+Smad2/3siRNA, HH-EVs(MSCs)+Smad2/3siRNA, and HH-Smad2/3siRNA) were immuno-labeled for the following: 1) structural proteins: collagen type I (COL1A1) alpha smooth muscle actin (α-SMA), and connexin 43 (Cx43); 2) proteins involved in cell adhesion and vascular remodeling: matrix metalloproteinase-2 (MMP-2) and vascular cell adhesion molecule-1 (VCAM-1); 3) immune cell infiltrate: T cells (CD3e+), total macrophages (CD68+), and M1 macrophages (MHC-II+); and 4) cytosolic ROS production (dihydroethidium (DHE) was oxidized by cytosolic ROS to fluorescent ethidium bromide that intercalates DNA yielding a bright red nuclear fluorescence). Nuclei were shown in blue fluorescence by DAPI dye staining. Each experiment point was performed in triplicate, from two different sets of experiments. A total of five different microscopic fields for each experimental point were analyzed. Total magnification: ×20. The images were quantified using the ImageJ program.
FIGURE 10
FIGURE 10
Representative Western blotting images of the expression levels of pATF-2, ATF-2, pSMAD2/3, SMAD2/3, NF-kBp50, NF-kBp65, and β-actin in both thoracic aorta (left) and carotid artery (right) explanted from all seven experimental animal groups.
FIGURE 11
FIGURE 11
Western Blot analysis for relative expression of specific pro-inflammatory molecules (proteins): pATF-2, ATF-2, pSMAD2/3, SMAD2/3, and NF-kBp50/p65. Histograms show a quantitative representation of the protein levels obtained from all investigated groups of four independent experiments after 4 months of diet and treatment. Each value represents the mean ± SD. The statistical significance, noticeably different, was represented as ***p < 0.005, **p < 0.01 values versus control group and ### p < 0.005, ## p < 0.01, # p < 0.05 values versus HH group. Statistical analysis was conducted using two-way ANOVA and Bonferroni post-test. The gray intensity of related proteins was analyzed by the TotalLab TL120 program. The housekeeping β-actin protein was used as an internal control for protein normalization and monitor for equal loading. Note that the β-actin expression fluctuated upon the treatment or under physiological and pathological conditions.
FIGURE 12
FIGURE 12
Relative expression levels of six miRNAs (miRNA-21, miRNA-192, miRNA-200b, miRNA-29a, miRNA-210, and miRNA-146a) extracted from two types of tissue (A) thoracic aorta (B) and carotid artery, explanted from all groups of investigated animals. Total RNA was extracted and used for RT-qPCR. The expression of the miRNA panel was validated using three tissue samples from each artery and matched normal tissue samples. The miRNA expression was normalized using snRU6 as a reference gene. p-values of significant differences between the groups were calculated and represented as ***p < 0.005, **p < 0.01, *p < 0.05 for values vs. control group and ### p < 0.005, ## p < 0.01, # p < 0.05 for values vs. HH group (two-way ANOVA Bonferroni post-test analysis). The mean fold change in expression of the target miRNA was calculated using ∆∆Ct = ΔCt (a target sample) − ΔCt (a reference sample). For the control sample, ∆∆Ct equals 0 and 2° equals 1; therefore, fold change in gene expression relative to control equals 1.

References

    1. Ait-Oufella H., Taleb S., Mallat Z., Tedgui A. (2011). Recent Advances on the Role of Cytokines in Atherosclerosis. Atvb 31 (5), 969–979. 10.1161/ATVBAHA.110.207415 - DOI - PubMed
    1. Alexandru N., Andrei E., Niculescu L., Dragan E., Ristoiu V., Georgescu A. (2017). Microparticles of Healthy Origins Improve Endothelial Progenitor Cell Dysfunction via microRNA Transfer in an Atherosclerotic Hamster Model. Acta Physiol. 221 (4), 230–249. 10.1111/apha.12896 - DOI - PubMed
    1. Alexandru N., Andrei E., Safciuc F., Dragan E., Balahura A. M., Badila E., et al. (2020). Intravenous Administration of Allogenic Cell-Derived Microvesicles of Healthy Origins Defends against Atherosclerotic Cardiovascular Disease Development by a Direct Action on Endothelial Progenitor Cells. Cells 9 (2), 423. 10.3390/cells9020423 - DOI - PMC - PubMed
    1. Alexandru N., Constantin A., Nemecz M., Comariţa I. K., Vîlcu A., Procopciuc A., et al. (2019). Hypertension Associated with Hyperlipidemia Induced Different MicroRNA Expression Profiles in Plasma, Platelets, and Platelet-Derived Microvesicles; Effects of Endothelial Progenitor Cell Therapy. Front. Med. 6, 280. 10.3389/fmed.2019.00280 - DOI - PMC - PubMed
    1. Alexandru N., Procopciuc A., Vîlcu A., Comariţa I. K., Bӑdilӑ E., Georgescu A. (2021). Extracellular Vesicles-Incorporated microRNA Signature as Biomarker and Diagnosis of Prediabetes State and its Complications. Rev. Endocr. Metab. Disord. 1, 1. 10.1007/s11154-021-09664-y - DOI - PubMed