

Transcriptome alterations in spermatogonial stem cells exposed to bisphenol A
- PMID: 35479511
- PMCID: PMC9037227
- DOI: 10.1080/19768354.2022.2061592
Transcriptome alterations in spermatogonial stem cells exposed to bisphenol A
Abstract
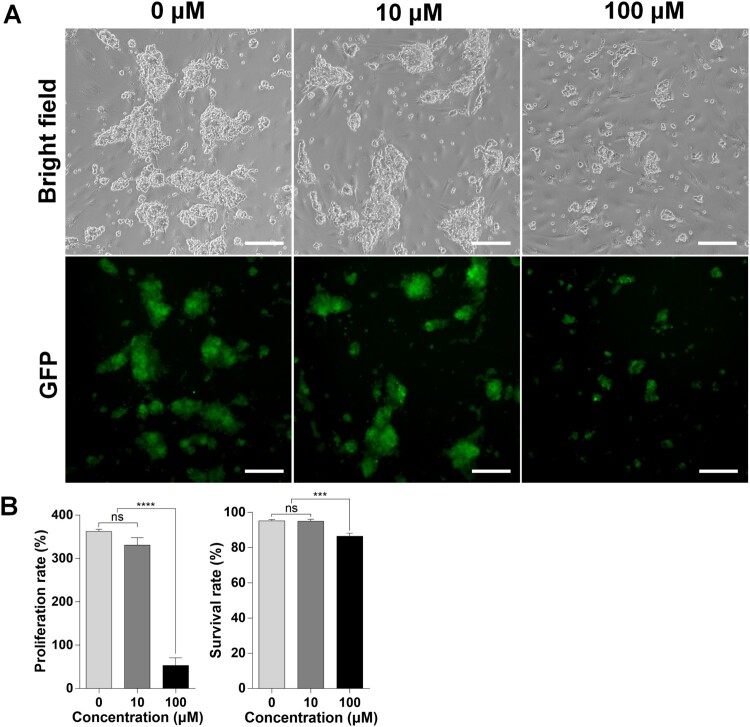
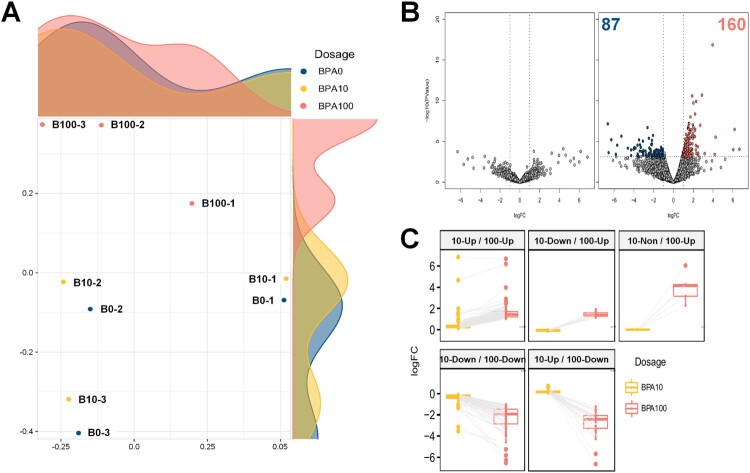
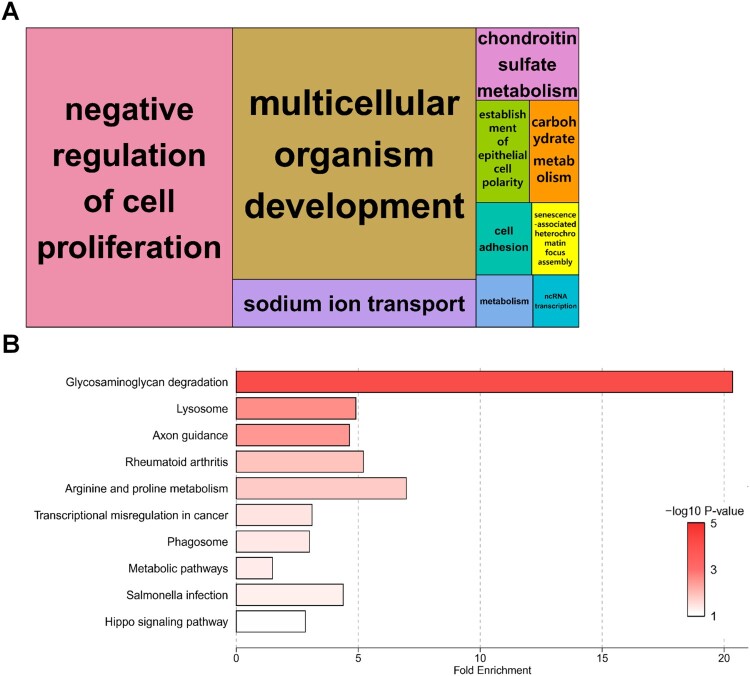
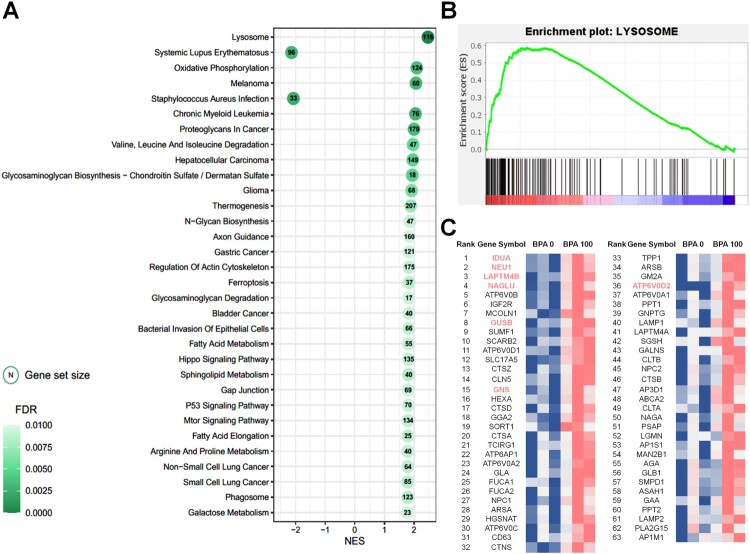
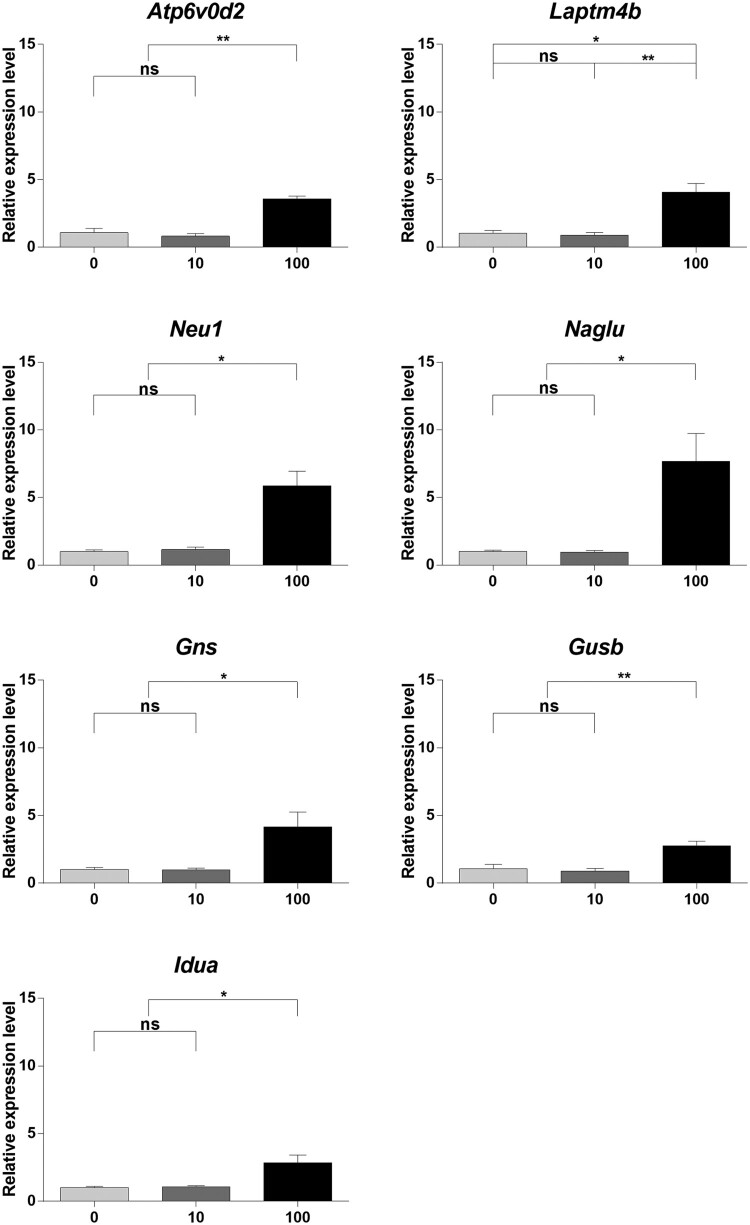
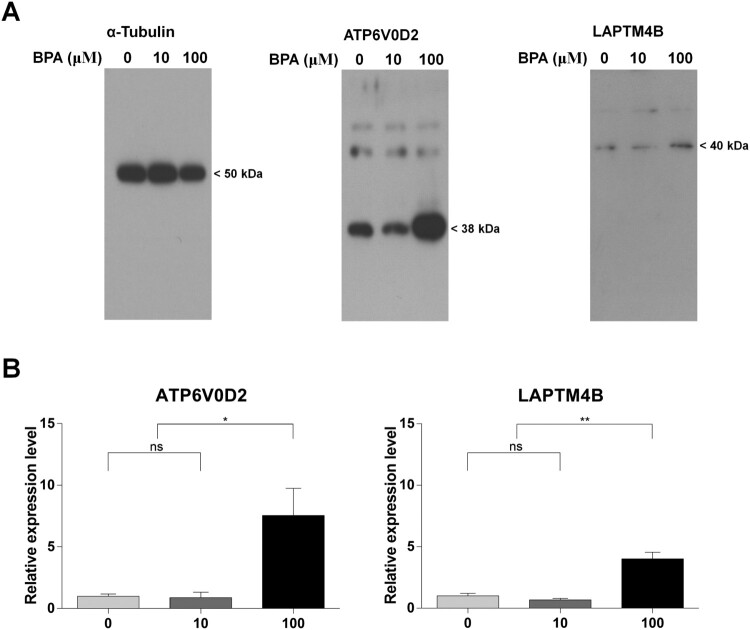
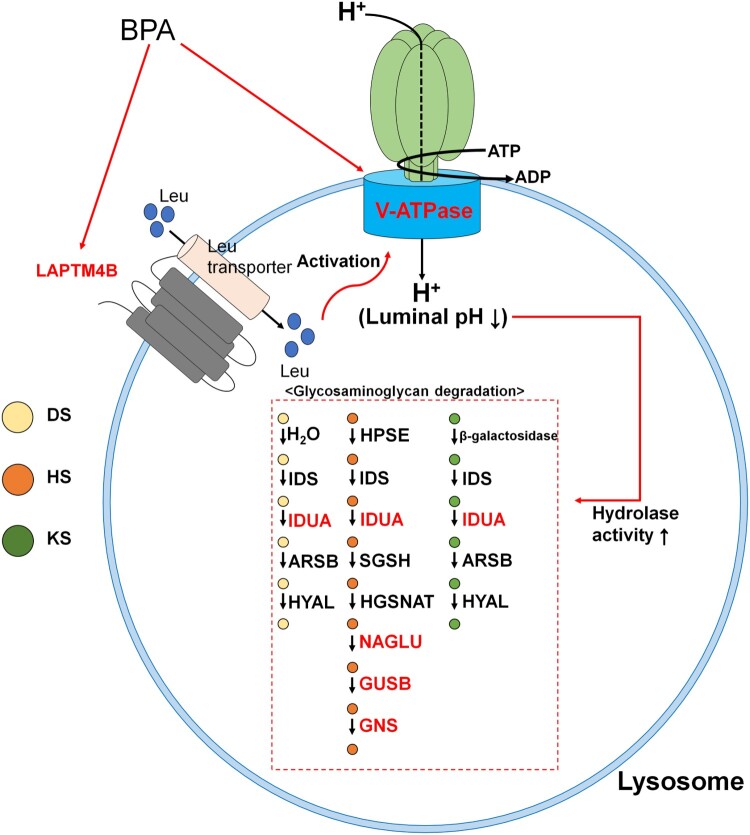
Owing to their self-renewal and differentiation abilities, spermatogonial stem cells (SSCs) are essential for maintaining male fertility and species preservation through spermatogenesis. With an increase in exposure to plasticizers, the risk of endocrine-disrupting chemicals exerting mimetic effects on estrogen receptors, such as bisphenol A (BPA), has also increased. This has led to concerns regarding the preservation of male fertility. BPA impairs spermatogenesis and the maintenance of SSCs; however, the transcriptome differences caused by BPA in SSCs are poorly understood. Thus, this study aimed to investigate the transcriptome differences in SSCs exposed to BPA, using RNA sequencing (RNA-Seq) analysis. We found that cell proliferation and survival were suppressed by SSC exposure to BPA. Therefore, we investigated transcriptome differences through RNA-Seq, functional annotation, and gene set enrichment analysis. Our results showed repetitive and abundant terms related to two genes of lysosomal acidification and five genes of glycosaminoglycan degradation. Furthermore, we validated the transcriptome analyses by detecting mRNA and protein expression levels. The findings confirmed the discovery of differentially expressed genes (DEGs) and the mechanism of SSCs following exposure to BPA. Taken together, we expect that the identified DEGs and lysosomal mechanisms could provide new insights into the preservation of male fertility and related research.
Keywords: Bisphenol A; RNA sequencing; autophagy; spermatogonial stem cells.
© 2022 The Author(s). Published by Informa UK Limited, trading as Taylor & Francis Group.
Conflict of interest statement
No potential conflict of interest was reported by the author(s).
Figures
Similar articles
-
Bisphenol A induced apoptosis and transcriptome differences of spermatogonial stem cells in vitro.Acta Biochim Biophys Sin (Shanghai). 2017 Sep 1;49(9):780-791. doi: 10.1093/abbs/gmx075. Acta Biochim Biophys Sin (Shanghai). 2017. PMID: 28910977
-
Bisphenol Analogs Downregulate the Self-Renewal Potential of Spermatogonial Stem Cells.World J Mens Health. 2025 Jan;43(1):154-165. doi: 10.5534/wjmh.230166. Epub 2024 Mar 28. World J Mens Health. 2025. PMID: 38606862 Free PMC article.
-
Transcriptome Analysis in High Temperature Inhibiting Spermatogonial Stem Cell Differentiation In Vitro.Reprod Sci. 2023 Jun;30(6):1938-1951. doi: 10.1007/s43032-022-01133-4. Epub 2022 Dec 20. Reprod Sci. 2023. PMID: 36538028
-
Recent advances in isolation, identification, and culture of mammalian spermatogonial stem cells.Asian J Androl. 2022 Jan-Feb;24(1):5-14. doi: 10.4103/aja.aja_41_21. Asian J Androl. 2022. PMID: 34135169 Free PMC article. Review.
-
New insights into male gametogenesis: what about the spermatogonial stem cell niche?Folia Histochem Cytobiol. 2007;45(3):141-7. Folia Histochem Cytobiol. 2007. PMID: 17951161 Review.
Cited by
-
Retinal transcriptome profiling identifies novel candidate genes associated with visual impairment in a mouse model of multiple sclerosis.Anim Cells Syst (Seoul). 2023 Oct 4;27(1):219-233. doi: 10.1080/19768354.2023.2264354. eCollection 2023. Anim Cells Syst (Seoul). 2023. PMID: 37808551 Free PMC article.
-
Integrative transcriptomic profiling uncovers immune and functional responses to bisphenol a across multiple tissues in male mice.Anim Cells Syst (Seoul). 2024 Oct 24;28(1):519-535. doi: 10.1080/19768354.2024.2419473. eCollection 2024. Anim Cells Syst (Seoul). 2024. PMID: 39464840 Free PMC article.
-
NUCB2/nesfatin-1 suppresses the acrosome reaction in sperm within the mouse epididymis.Anim Cells Syst (Seoul). 2023 May 13;27(1):120-128. doi: 10.1080/19768354.2023.2212741. eCollection 2023. Anim Cells Syst (Seoul). 2023. PMID: 37197085 Free PMC article.
-
Environmentally-relevant doses of bisphenol A and S exposure in utero disrupt germ cell programming across generations resolved by single nucleus multi-omics.bioRxiv [Preprint]. 2024 Dec 10:2024.12.05.627072. doi: 10.1101/2024.12.05.627072. bioRxiv. 2024. Update in: Environ Health Perspect. 2025 Jun 3. doi: 10.1289/EHP16981. PMID: 39713385 Free PMC article. Updated. Preprint.
-
Comparative transcriptome analysis between long- and short-term survival after pig-to-monkey cardiac xenotransplantation reveals differential heart failure development.Anim Cells Syst (Seoul). 2023 Oct 4;27(1):234-248. doi: 10.1080/19768354.2023.2265150. eCollection 2023. Anim Cells Syst (Seoul). 2023. PMID: 37808548 Free PMC article.
References
-
- Barnett MW, Fisher CE, Perona-Wright G, Davies JA.. 2002. Signalling by glial cell line-derived neurotrophic factor (GDNF) requires heparan sulphate glycosaminoglycan. J Cell Sci. 115(Pt 23):4495–4503. - PubMed
-
- Beyenbach KW, Wieczorek H.. 2006. The V-type H+ ATPase: molecular structure and function, physiological roles and regulation. J Exp Biol. 209(Pt 4):577–589. - PubMed
LinkOut - more resources
Full Text Sources
Other Literature Sources