

Activation of Complement Pathways in Kidney Tissue May Mediate Tubulointerstitial Injury in Diabetic Nephropathy
- PMID: 35479942
- PMCID: PMC9037626
- DOI: 10.3389/fmed.2022.845679
Activation of Complement Pathways in Kidney Tissue May Mediate Tubulointerstitial Injury in Diabetic Nephropathy
Abstract
Introduction: Key genes involved in tubulointerstitial injury may influence the development and progression of diabetic nephropathy (DN). We investigated whether complement-related genes are linked to the mechanism underlying tubulointerstitial injury in DN.
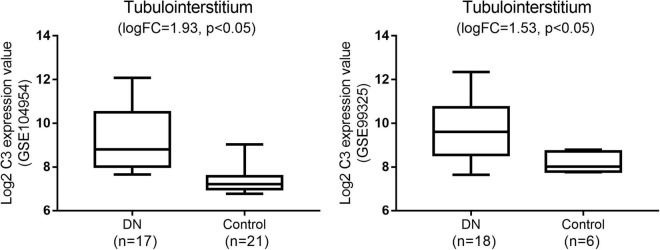
Methods: We analyzed the microarray data of 17 tubulointerstitial tissue samples from DN patients and 21 normal controls from the Gene Expression Omnibus. A gene co-expression network was constructed, and genes were divided into modules by weighted gene co-expression network analysis (WGCNA). We also investigated the association of C3 and C1q deposits in kidney tissues with a composite outcome of end-stage renal disease or a 50% reduction in the estimated glomerular filtration rate (eGFR) in DN patients. Finally, we performed immunohistochemical analyses of C3, C1q, C5b-9, mannose-binding lectin (MBL), and factor B in kidney tissues.
Results: Nine co-expression modules were constructed using 12,075 genes from the 38 human tubulointerstitial tissue samples. Black module with more genes was positively correlated with tubulointerstitial injury in DN. C3, one of the top 10 genes in tubulointerstitial injury, was verified in an independent dataset; C3 was significantly overexpressed in tubulointerstitial tissue from patients with DN compared to the normal controls. The mRNA level of C3 in renal tubulointerstitium was negatively correlated with eGFR in DN patients (r = -0.75; p = 0.001). Analysis of the follow-up data of 54 DN patients demonstrated that codeposits of C3 and C1q in kidney tissues were independently associated with the renal outcome in DN (hazard ratio, 2.3, 95% confidence interval, 1.01-5.2, p < 0.05). Immunohistochemical analysis showed that patients with higher C1q, C3, C5b-9, MBL, or factor B expression in renal tubulointerstitium were more likely to progress to kidney failure.
Conclusion: Local complement activation of the classical, lectin and alternative pathways appears linked to tubulointerstitial injury and disease progression in DN.
Keywords: WGCNA; complement system; diabetic nephropathy; prognosis; tubulointerstitial injury.
Copyright © 2022 Jiang, Jiao, Zou, Gao, Zhuo and Li.
Conflict of interest statement
The authors declare that the research was conducted in the absence of any commercial or financial relationships that could be construed as a potential conflict of interest.
Figures


References
-
- International Diabetes Federation. IDF Diabetes Atlas. 10th ed. Brussels: International Diabetes Federation; (2021).
LinkOut - more resources
Full Text Sources
Research Materials
Miscellaneous