m6A Regulator-Mediated RNA Methylation Modification Patterns are Involved in the Pathogenesis and Immune Microenvironment of Depression
- PMID: 35480327
- PMCID: PMC9035487
- DOI: 10.3389/fgene.2022.865695
m6A Regulator-Mediated RNA Methylation Modification Patterns are Involved in the Pathogenesis and Immune Microenvironment of Depression
Abstract
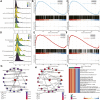
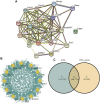
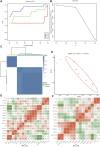
Depression is a genetical disease characterized by neuroinflammatory symptoms and is difficult to diagnose and treat effectively. Recently, modification of N6-methyladenosine (m6A) at the gene level was shown to be closely related to immune regulation. This study was conducted to explore the effect of m6A modifications on the occurrence of depression and composition of the immune microenvironment. We downloaded gene expression profile data of healthy and depressed rats from the Gene Expression Omnibus. We described the overall expression of m6A regulators in animal models of depression and constructed risk and clinical prediction models using training and validation sets. Bioinformatics analysis was performed using gene ontology functions, gene set enrichment analysis, gene set variation analysis, weighted gene co-expression network analysis, and protein-protein interaction networks. We used CIBERSORT to identify immune-infiltrating cells in depression and perform correlation analysis. We then constructed two molecular subtypes of depression and assessed the correlation between the key genes and molecular subtypes. Through differential gene analysis of m6A regulators in depressed rats, we identified seven m6A regulators that were significantly upregulated in depressed rats and successfully constructed a clinical prediction model. Gene Ontology functional annotation showed that the m6A regulators enriched differentially expressed genes in biological processes, such as the regulation of mRNA metabolic processes. Further, 12 hub genes were selected from the protein-protein interaction network. Immune cell infiltration analysis showed that levels of inflammatory cells, such as CD4 T cells, were significantly increased in depressed rats and were significantly correlated with the depression hub genes. Depression was divided into two subtypes, and the correlation between hub genes and these two subtypes was clarified. We described the effect of m6A modification on the pathogenesis of depression, focusing on the role of inflammatory infiltration.
Keywords: N6-methyladenosine; biomarker; depression; epigenetics; immune microenvironment.
Copyright © 2022 Wang, Wang, Yang, Hua and Wang.
Conflict of interest statement
The authors declare that the research was conducted in the absence of any commercial or financial relationships that could be construed as a potential conflict of interest.
Figures


Similar articles
-
m6A regulator-mediated RNA methylation modification patterns are involved in immune microenvironment regulation of coronary heart disease.Front Cardiovasc Med. 2022 Aug 25;9:905737. doi: 10.3389/fcvm.2022.905737. eCollection 2022. Front Cardiovasc Med. 2022. PMID: 36093132 Free PMC article.
-
Characterization of ligamentum flavum hypertrophy based on m6A RNA methylation modification and the immune microenvironment.Am J Transl Res. 2022 Dec 15;14(12):8800-8827. eCollection 2022. Am J Transl Res. 2022. PMID: 36628248 Free PMC article.
-
m6A regulator-mediated RNA methylation modification patterns and immune microenvironment infiltration characterization in patients with intracranial aneurysms.Front Neurol. 2022 Aug 5;13:889141. doi: 10.3389/fneur.2022.889141. eCollection 2022. Front Neurol. 2022. PMID: 35989938 Free PMC article.
-
Landscape analysis of m6A modification regulators related biological functions and immune characteristics in myasthenia gravis.J Transl Med. 2023 Mar 2;21(1):166. doi: 10.1186/s12967-023-03947-5. J Transl Med. 2023. PMID: 36864526 Free PMC article.
-
Role of m6A Methylation in the Occurrence and Development of Heart Failure.Front Cardiovasc Med. 2022 Jun 24;9:892113. doi: 10.3389/fcvm.2022.892113. eCollection 2022. Front Cardiovasc Med. 2022. PMID: 35811741 Free PMC article. Review.
Cited by
-
Exploration of N6-methyladenosine modification in ascorbic acid 2-glucoside constructed stem cell sheets.J Mol Histol. 2024 Oct;55(5):909-925. doi: 10.1007/s10735-024-10240-2. Epub 2024 Aug 12. J Mol Histol. 2024. PMID: 39133390
-
N6-methyladenosine methylation: a novel key to unlocking mental disorders.Int J Neuropsychopharmacol. 2025 Jul 23;28(7):pyaf044. doi: 10.1093/ijnp/pyaf044. Int J Neuropsychopharmacol. 2025. PMID: 40590504 Free PMC article. Review.
References
LinkOut - more resources
Full Text Sources
Research Materials

