. 2022 Mar 11;3(4):100583.
doi: 10.1016/j.xcrm.2022.100583. eCollection 2022 Apr 19.

Comparative transmissibility of SARS-CoV-2 variants Delta and Alpha in New England, USA

Collaborators, Affiliations

Comparative transmissibility of SARS-CoV-2 variants Delta and Alpha in New England, USA

Rebecca Earnest et al. Cell Rep Med. .

Abstract

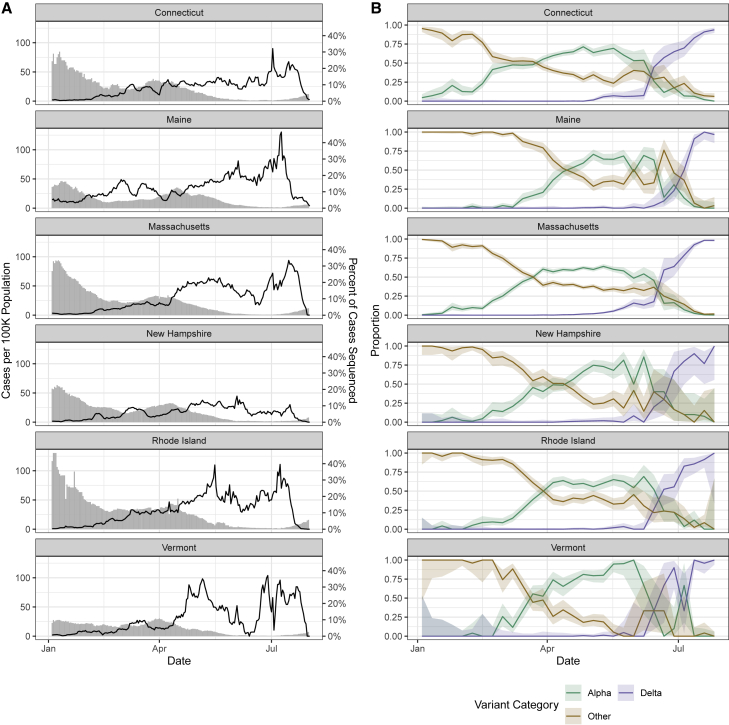
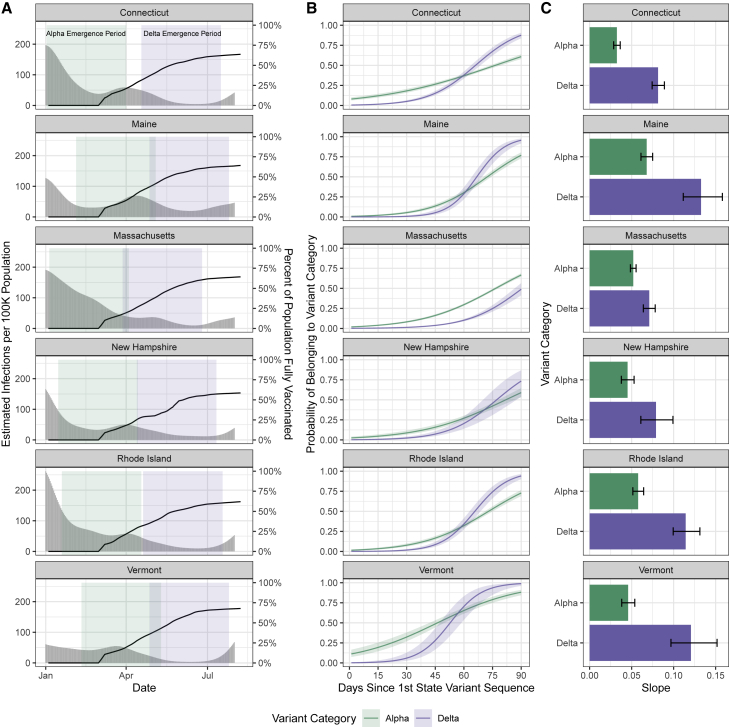
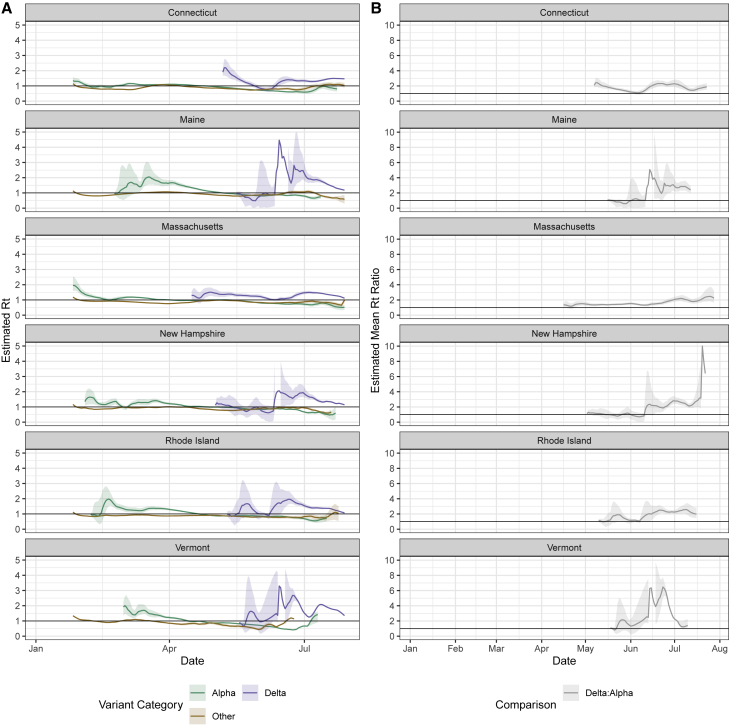
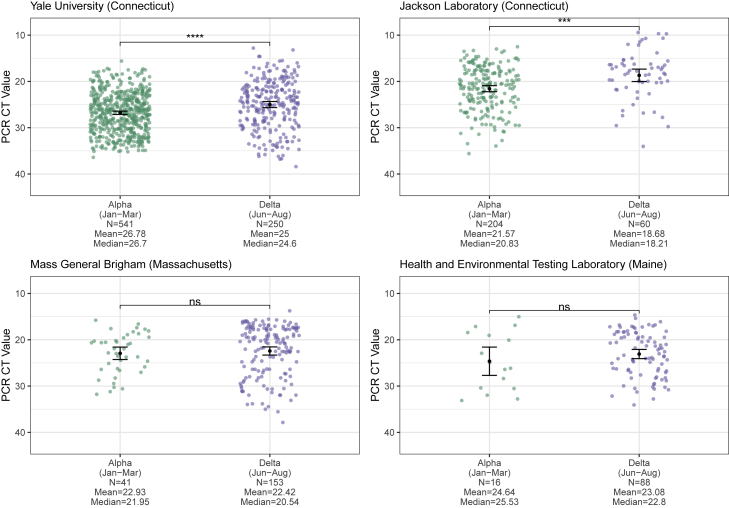
The SARS-CoV-2 Delta variant rose to dominance in mid-2021, likely propelled by an estimated 40%-80% increased transmissibility over Alpha. To investigate if this ostensible difference in transmissibility is uniform across populations, we partner with public health programs from all six states in New England in the United States. We compare logistic growth rates during each variant's respective emergence period, finding that Delta emerged 1.37-2.63 times faster than Alpha (range across states). We compute variant-specific effective reproductive numbers, estimating that Delta is 63%-167% more transmissible than Alpha (range across states). Finally, we estimate that Delta infections generate on average 6.2 (95% CI 3.1-10.9) times more viral RNA copies per milliliter than Alpha infections during their respective emergence. Overall, our evidence suggests that Delta's enhanced transmissibility can be attributed to its innate ability to increase infectiousness, but its epidemiological dynamics may vary depending on underlying population attributes and sequencing data availability.

Keywords: COVID-19; SARS-CoV-2; VOC; genomic epidemiology; transmissibility; variant of concern; viral emergence; viral sequencing.


Conflict of interest statement

N.D.G. is a paid consultant for Tempus Labs and the National Basketball Association and has received speaking fees from Goldman Sachs. P.C.S. is a co-founder of, shareholder in, and scientific advisor to Sherlock Biosciences, Inc., as well as a board member of and shareholder in Danaher Corporation. The remaining authors declare no competing interests.

Figures

None
Graphical abstract
Figure 1
Figure 1
SARS-CoV-2 sequencing coverage and variant frequency tracking (A) Confirmed cases per 100,000 population (bars) and percentage of cases sequenced (lines) by state (7 day rolling average), January to August 2021. The variability in percentage of cases sequenced represents changing sample availability and suitability for sequencing. The drop in percentage sequenced at the end of August does not reflect real decreases in sequencing coverage but instead (1) the 1 to 3 week delays between sample collection and sequence availability and (2) how the data are plotted using 7 day rolling averages. (B) Weekly proportion of sequenced genomes belonging to each variant category with 95% confidence intervals, January to August 2021. A breakdown of the number of genomes (n = 33,408) by state and lineage is included in Tables S1–S3.
Figure 2
Figure 2
Variant logistic growth rates during their respective emergence periods in the context of infections and vaccination (A) Estimated infections per 100,000 population (gray bars, left axis) and percentage of the population fully vaccinated (black lines, right axis) (7 day rolling average), with the colored rectangles indicating the 90 day emergence periods for each variant. (B) Predicted probability of a given sequence belonging to each variant category over time determined by a binomial logistic regression for the variant category as the outcome and the number of days since the first detection as the predictor, estimating the logistic growth rate for Alpha versus Delta. Shown with 95% confidence intervals. The analysis is restricted to the first 90 days of emergence in each state as shown in (A). During the Alpha emergence period, we had the following number of Alpha genomes for each state: Connecticut, n = 1;221; Maine, n = 508; Massachusetts, n = 2;062; New Hampshire, n = 298; Rhode Island, n = 641; and Vermont, n = 466. During the Delta emergence period, we had the following number of Delta genomes for each state: Connecticut, n = 301; Maine, n = 108; Massachusetts, n = 268; New Hampshire, n = 30; Rhode Island, n = 136; and Vermont, n = 82. (C) The regression coefficients (slopes) of the logistic growth rate from (B) with 95% confidence intervals. A sensitivity analysis varying the emergence periods by ±30 days is presented in Figure S1 and Table S4.
Figure 3
Figure 3
Comparison of variant effective reproductive numbers to estimate relative transmissibility (A) Estimated effective reproductive number (Rt) over time for each variant category calculated from the inferred number of infections using EpiEstim., We used a multi-step bootstrap sampling approach to generate 1,000 samples containing the estimated number of variant-specific infections. We obtained mean Rt estimates for each of the 1,000 bootstrapped samples and plotted the overall mean and 95% confidence intervals (2.5% and 97.5% quantiles across the bootstrapped samples). Note that the y axis differs from that in (B). (B) Daily mean ratios of Rt values for Delta compared with Alpha from (A). For each bootstrapped sample described in (A), we calculated the daily ratio of the Delta to Alpha Rt estimates. We plotted the mean across the 1,000 bootstrapped samples and the 95% confidence intervals, calculated the same as in (A). For (A) and (B), the upper limit of Delta’s confidence intervals in Maine, New Hampshire, and Vermont are not plotted but are displayed in Figures S2B and S2C.
Figure 4
Figure 4
Cross-sectional PCR data from Alpha and Delta samples PCR CT values (inverted y axis) plotted by institute and variant category, limiting Alpha samples to January to March 2021 and Delta samples to June to August 2021 to account for their respective emergence periods. Monthly CT values for Alpha and Delta for Yale University are shown in Figures S4A and S4B. For each institute, the means of the two variant categories were compared using a t test, with statistical significance symbols corresponding to the following values: ns (p > 0.05), ∗∗∗p ≤ 0.001, and ∗∗∗∗p ≤ 0.0001. Data from the full month of August were not available for most of the institutes at the time of analysis. The Yale University (Connecticut) Alpha (n = 541) and Delta (n = 250) data are from the N1 primer/probe set (originally from the “CDC assay”) of a research use-only RT-PCR assay to discriminate among variants (data shown as virus RNA copies per milliliter in Figure S4C). The Jackson Laboratory (Connecticut) Alpha (n = 204) and Delta (n = 60) data are from the N gene primer/probe set of the TaqPath COVID-19 Combo Kit (Thermo Fisher Scientific). The Mass General Brigham (Massachusetts) Alpha (n = 41) and Delta (n = 153) data are from the E gene of the Roche Cobas SARS-CoV-2 test (ORF1a data shown in Figure S4D). The Health and Environmental Testing Laboratory (Maine) Alpha (n = 16) and Delta (n = 88) data are from the N1 primer/probe set (originally from the “CDC assay”) of the OPTI SARS-CoV-2 RT-PCR Test (OPTI Medical Systems).

Update of

  • Comparative transmissibility of SARS-CoV-2 variants Delta and Alpha in New England, USA.
    Earnest R, Uddin R, Matluk N, Renzette N, Siddle KJ, Loreth C, Adams G, Tomkins-Tinch CH, Petrone ME, Rothman JE, Breban MI, Koch RT, Billig K, Fauver JR, Vogels CBF, Turbett S, Bilguvar K, De Kumar B, Landry ML, Peaper DR, Kelly K, Omerza G, Grieser H, Meak S, Martha J, Dewey HH, Kales S, Berenzy D, Carpenter-Azevedo K, King E, Huard RC, Smole SC, Brown CM, Fink T, Lang AS, Gallagher GR, Sabeti PC, Gabriel S, MacInnis BL; New England Variant Investigation Team; Tewhey R, Adams MD, Park DJ, Lemieux JE, Grubaugh ND. Earnest R, et al. medRxiv [Preprint]. 2021 Oct 7:2021.10.06.21264641. doi: 10.1101/2021.10.06.21264641. medRxiv. 2021. Update in: Cell Rep Med. 2022 Mar 11;3(4):100583. doi: 10.1016/j.xcrm.2022.100583. PMID: 34642698 Free PMC article. Updated. Preprint.

References

    1. CDC SARS-CoV-2 variant classifications and definitions. 2021. https://www.cdc.gov/coronavirus/2019-ncov/variants/variant-info.html
    1. Lauring A.S., Hodcroft E.B. Genetic variants of SARS-CoV-2—what do they mean? JAMA. 2021;325:529–531. - PubMed
    1. Rambaut A., Loman N., Pybus O., Barclay W., Barrett J., Carabelli A., Connor T., Peacock T., Robertson D.L., Volz E., et al. Preliminary genomic characterisation of an emergent SARS-CoV-2 lineage in the UK defined by a novel set of spike mutations. 2020. https://virological.org/t/preliminary-genomic-characterisation-of-an-eme...
    1. Alpert T., Brito A.F., Lasek-Nesselquist E., Rothman J., Valesano A.L., MacKay M.J., Petrone M.E., Breban M.I., Watkins A.E., Vogels C.B.F., et al. Early introductions and transmission of SARS-CoV-2 variant B.1.1.7 in the United States. Cell. 2021;184:2595–2604.e13. - PMC - PubMed
    1. Tao K., Tzou P.L., Nouhin J., Gupta R.K., de Oliveira T., Kosakovsky Pond S.L., Fera D., Shafer R.W. The biological and clinical significance of emerging SARS-CoV-2 variants. Nat. Rev. Genet. 2021;22:757–773. - PMC - PubMed

Publication types

Supplementary concepts