Reducing the resistance for the use of electrochemical impedance spectroscopy analysis in materials chemistry
- PMID: 35480766
- PMCID: PMC9038008
- DOI: 10.1039/d1ra03785d
Reducing the resistance for the use of electrochemical impedance spectroscopy analysis in materials chemistry
Abstract
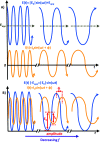
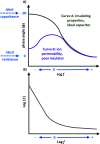
Electrochemical impedance spectroscopy (EIS) is a highly applicable electrochemical, analytical, and non-invasive technique for materials characterization, which allows the user to evaluate the impact, efficiency, and magnitude of different components within an electrical circuit at a higher resolution than other common electrochemical techniques such as cyclic voltammetry (CV) or chronoamperometry. EIS can be used to study mechanisms of surface reactions, evaluate kinetics and mass transport, and study the level of corrosion on conductive materials, just to name a few. Therefore, this review demonstrates the scope of physical properties of the materials that can be studied using EIS, such as for characterization of supercapacitors, dye-sensitized solar cells (DSSCs), conductive coatings, sensors, self-assembled monolayers (SAMs), and other materials. This guide was created to support beginner and intermediate level researchers in EIS studies to inspire a wider application of this technique for materials characterization. In this work, we provide a summary of the essential background theory of EIS, including experimental design, signal responses, and instrumentation. Then, we discuss the main graphical representations for EIS data, including a scope of the foundation principles of Nyquist, Bode phase angle, Bode magnitude, capacitance and Randles plots, followed by detailed step-by-step explanations of the corresponding calculations that evolve from these graphs and direct examples from the literature highlighting practical applications of EIS for characterization of different types of materials. In addition, we discuss various applications of EIS technique for materials research.
This journal is © The Royal Society of Chemistry.
Conflict of interest statement
There are no conflicts to declare.
Figures


Similar articles
-
Electrochemical Impedance Spectroscopy-A Tutorial.ACS Meas Sci Au. 2023 Mar 8;3(3):162-193. doi: 10.1021/acsmeasuresciau.2c00070. eCollection 2023 Jun 21. ACS Meas Sci Au. 2023. PMID: 37360038 Free PMC article. Review.
-
Combinatorial materials research applied to the development of new surface coatings X: a high-throughput electrochemical impedance spectroscopy method for screening organic coatings for corrosion inhibition.J Comb Chem. 2008 Sep-Oct;10(5):704-13. doi: 10.1021/cc8000458. Epub 2008 Jun 27. J Comb Chem. 2008. PMID: 18582116
-
Electrochemical impedance spectroscopy study of corrosion characteristics of palladium-silver dental alloys.J Biomed Mater Res B Appl Biomater. 2021 Nov;109(11):1777-1786. doi: 10.1002/jbm.b.34837. Epub 2021 Apr 4. J Biomed Mater Res B Appl Biomater. 2021. PMID: 33817975
-
Electrochemical impedance spectroscopy: from breakthroughs to functional utility in supercapacitors and batteries - a comprehensive assessment.Phys Chem Chem Phys. 2024 Oct 17;26(40):25748-25761. doi: 10.1039/d4cp02148g. Phys Chem Chem Phys. 2024. PMID: 39361027 Review.
-
Electrochemical Techniques for Intercalation Electrode Materials in Rechargeable Batteries.Acc Chem Res. 2017 Apr 18;50(4):1022-1031. doi: 10.1021/acs.accounts.7b00031. Epub 2017 Mar 16. Acc Chem Res. 2017. PMID: 28300397
Cited by
-
Enhancing the Performance of Nanocrystalline SnO2 for Solar Cells through Photonic Curing Using Impedance Spectroscopy Analysis.Nanomaterials (Basel). 2024 Sep 17;14(18):1508. doi: 10.3390/nano14181508. Nanomaterials (Basel). 2024. PMID: 39330665 Free PMC article.
-
A flexible solid-state asymmetric supercapacitor device comprising cobalt hydroxide and biomass-derived porous carbon.RSC Adv. 2024 Aug 29;14(37):27465-27474. doi: 10.1039/d4ra05106h. eCollection 2024 Aug 22. RSC Adv. 2024. PMID: 39211909 Free PMC article.
-
An ultra-sensitive electrochemical biosensor using the Spike protein for capturing antibodies against SARS-CoV-2 in point-of-care.Mater Today Bio. 2022 Dec;16:100354. doi: 10.1016/j.mtbio.2022.100354. Epub 2022 Jul 9. Mater Today Bio. 2022. PMID: 35847374 Free PMC article.
-
Circuit response and experimental verification of high energy storage density materials.Sci Rep. 2025 Feb 13;15(1):5432. doi: 10.1038/s41598-025-89300-w. Sci Rep. 2025. PMID: 39948167 Free PMC article.
-
Mechanistic Insights into Anion-Induced Electrochromism of Ru(II)-Based Metallo-Supramolecular Polymer.Polymers (Basel). 2023 Dec 18;15(24):4735. doi: 10.3390/polym15244735. Polymers (Basel). 2023. PMID: 38139986 Free PMC article.
References
-
- Wood J. Mater. Today. 2008;11:40–45. doi: 10.1016/S1369-7021(07)70351-6. - DOI
-
- Itagaki M. Suzuki S. Shitanda I. Watanabe K. Electrochem. 2007;75:649–655. doi: 10.5796/electrochemistry.75.649. - DOI
-
- Janek R. P. Fawcett W. R. Langmuir. 1998;14:3011–3018. doi: 10.1021/la970980+. - DOI
-
- Wang J. Li X. Wang Z. Guo H. Huang B. Wang Z. Yan G. J. Solid State Electrochem. 2015;19:153–160. doi: 10.1007/s10008-014-2586-9. - DOI
Publication types
LinkOut - more resources
Full Text Sources

