. 2021 Jun 24;11(36):22334-22342.
doi: 10.1039/d1ra03584c. eCollection 2021 Jun 21.

Protein detection enabled using functionalised silk-binding peptides on a silk-coated optical fibre

Affiliations

Protein detection enabled using functionalised silk-binding peptides on a silk-coated optical fibre

Patrick K Capon et al. RSC Adv. .

Abstract

We present a new coating procedure to prepare optical fibre sensors suitable for use with protein analytes. We demonstrate this through the detection of AlexaFluor-532 tagged streptavidin by its binding to D-biotin that is functionalised onto an optical fibre, via incorporation in a silk fibroin fibre coating. The D-biotin was covalently attached to a silk-binding peptide to provide SBP-biotin, which adheres the D-biotin to the silk-coated fibre tip. These optical fibre probes were prepared by two methods. The first involves dip-coating the fibre tip into a mixture of silk fibroin and SBP-biotin, which distributes the SBP-biotin throughout the silk coating (method A). The second method uses two steps, where the fibre is first dip-coated in silk only, then SBP-biotin added in a second dip-coating step. This isolates SBP-biotin to the outer surface of the silk layer (method B). A series of fluorescence measurements revealed that only the surface bound SBP-biotin detects streptavidin with a detection limit of 15 μg mL-1. The fibre coatings are stable to repeated washing and long-term exposure to water. Formation of silk coatings on fibres using commercial aqueous silk fibroin was found to be inhibited by a lithium concentration of 200 ppm, as determined by atomic absorption spectroscopy. This was reduced to less than 20 ppm by dialysis against water, and was found to successfully form a coating on optical fibres.


Conflict of interest statement

RAM is a co-founder and a Director of Miniprobes Pty Ltd, a company that develops novel optical imaging systems. Miniprobes Pty Ltd did not contribute to this study.

Figures

Fig. 1
Fig. 1. Top: structure of the functionalised silk-binding peptide, SBP–biotin, prepared by N-terminal attachment of D-biotin (purple) to a SBP (black). Middle: fibre coating method A is a single step process, where the optical fibre tip (shown as an end on cross section) is dipped into an aqueous mixture of silk fibroin protein (light blue) and SBP–biotin. The fibre is then removed and dipped in 90% aqueous methanol. This provides a fibre probe with the SBP–biotin distributed throughout the silk fibroin layer. Method B consists of two fibre dip coating steps, where the optical fibre tip is first dipped in a solution of silk fibroin only followed by 90% methanol (shown by the blue coating). The silk coated fibre tip is then dipped in an aqueous solution of the SBP–biotin to provide a fibre probe with the SBP–biotin decorated on the outer surface of the silk fibroin coating (shown by the purple layer).
Fig. 2
Fig. 2. Top: scanning electron microscopy images in secondary electron mode of (A) a fibre coated by method A, (B) a fibre coated by method B, and (C) a bare fibre, which indicate no difference in topology between methods A and B. (D) backscattered electron (BSE) image of an optical fibre coated with silk fibroin by method A showing a minimal difference between the tip of the fibre and a point approximately 2200 mm down the fibre. (E) BSE image indicating the area in which the energy dispersive X-ray (EDX) line scan was conducted. (F) EDX line scan spectra for C Kα emission line (green) and Si Kα emission line (purple). (G) Schematic of the optical system used for fluorescence spectra collection. Blue: single-mode fibre, orange: multimode fibre, yellow: double-clad fibre. (H) Calibration curve for silk fibroin absorbance at 205 nm against concentration (mg mL−1). The equation of best fit was calculated using GraphPad Prism 9 linear regression with a y intercept set to 0, to give absorbance = 0.01306 * concentration (in mg mL−1). Goodness of fit (Sy.x) 0.05892. Data is plotted as mean ± standard deviation of three reads.
Fig. 3
Fig. 3. (A) Sensing of AlexaFluor-532 tagged streptavidin with SBP–biotin coated fibre probes. One fibre is shown for each coating type, plotted as the mean ± standard deviation of three individual fluorescence reads. Data for all three fibres for each fibre coating type is available in the ESI. Left, white; a control fibre coated with silk fibroin only, where all prewash fluorescence was lost upon washing with phosphate buffer (100 mM, pH 7.2). Middle, blue; a fibre coated with SBP–biotin and silk fibroin by method A, where all prewash fluorescence was again lost upon washing with phosphate buffer. Right, red; a fibre coated with SBP–biotin and silk fibroin by method B, where approximately 30% of the prewash signal was retained after washing with phosphate buffer, then all fluorescence removed by further washing of the fibre with aqueous sodium dodecyl sulfate (SDS, 2%). The excitation wavelength for all spectra was 532 nm, with intensity integrated between 565 and 600 nm for each fluorescence spectrum. (B) Sample full spectra for an optical fibre coated with silk fibroin and SBP–biotin by method B. Black: background fluorescence before exposure to AlexaFluor-532 tagged streptavidin. Purple: fluorescence spectrum after dipping in streptavidin solution. Blue: fluorescence spectrum after washing 3 × 30 s in phosphate buffer (100 mM, pH 7.2). Red, dashed: fluorescence spectrum after washing 3 × 30 s in sodium dodecyl sulfate (SDS, 2% aqueous). Excitation wavelength for all spectra was 532 nm. The region marked by the grey box indicates the area where intensity was integrated to provide the data in panel A.
Fig. 4
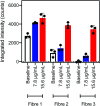
Fig. 4. Integrated intensity between 565 and 600 nm for fibre probes coated with silk fibroin and SBP–biotin by method B. White, the baseline signal obtained before exposure to streptavidin; blue, signal after dipping in AlexaFluor-532 tagged streptavidin at 7.8 μg mL−1; and red, signal after dipping in AlexaFluor-532 tagged streptavidin at 15 μg mL−1. The excitation wavelength was 532 nm for all spectra, data is plotted as mean ± standard deviation of three reads.

Similar articles

Cited by

References

    1. Chan J. Dodani S. C. Chang C. J. Reaction-Based Small-Molecule Fluorescent Probes for Chemoselective Bioimaging. Nat. Chem. 2012;4(12):973–984. doi: 10.1038/nchem.1500. doi: 10.1038/nchem.1500. - DOI - DOI - PMC - PubMed
    1. Fernández A. Vendrell M. Smart Fluorescent Probes for Imaging Macrophage Activity. Chem. Soc. Rev. 2016;45(5):1182–1196. doi: 10.1039/C5CS00567A. doi: 10.1039/C5CS00567A. - DOI - DOI - PubMed
    1. Liu H.-W. Chen L. Xu C. Li Z. Zhang H. Zhang X.-B. Tan W. Recent Progresses in Small-Molecule Enzymatic Fluorescent Probes for Cancer Imaging. Chem. Soc. Rev. 2018;47(18):7140–7180. doi: 10.1039/C7CS00862G. doi: 10.1039/C7CS00862G. - DOI - DOI - PubMed
    1. Kaur A. New E. J. Bioinspired Small-Molecule Tools for the Imaging of Redox Biology. Acc. Chem. Res. 2019;52(3):623–632. doi: 10.1021/acs.accounts.8b00368. doi: 10.1021/acs.accounts.8b00368. - DOI - DOI - PubMed
    1. Jacques S. L. Optical Properties of Biological Tissues: A Review. Phys. Med. Biol. 2013;58(11):R37–R61. doi: 10.1088/0031-9155/58/11/R37. doi: 10.1088/0031-9155/58/11/R37. - DOI - DOI - PubMed