. 2022 Apr 16;11(1):2066609.
doi: 10.1080/2162402X.2022.2066609. eCollection 2022.

Evaluation of radio-immunotherapy sequence on immunological responses and clinical outcomes in patients with melanoma brain metastases (ELEKTRA)

Affiliations

Evaluation of radio-immunotherapy sequence on immunological responses and clinical outcomes in patients with melanoma brain metastases (ELEKTRA)

Jessica C Hassel et al. Oncoimmunology. .

Abstract

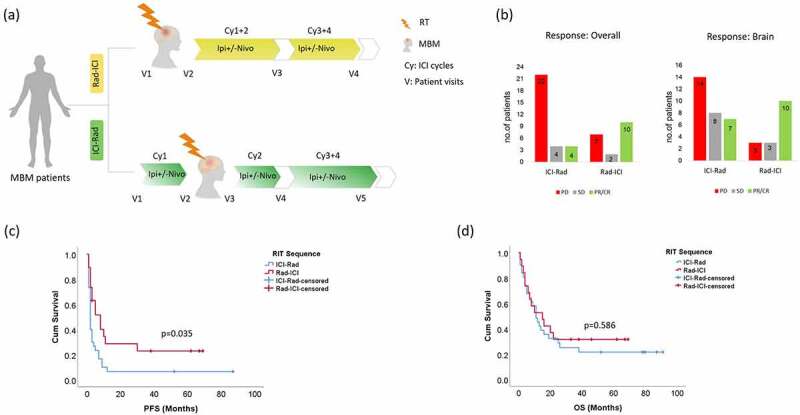
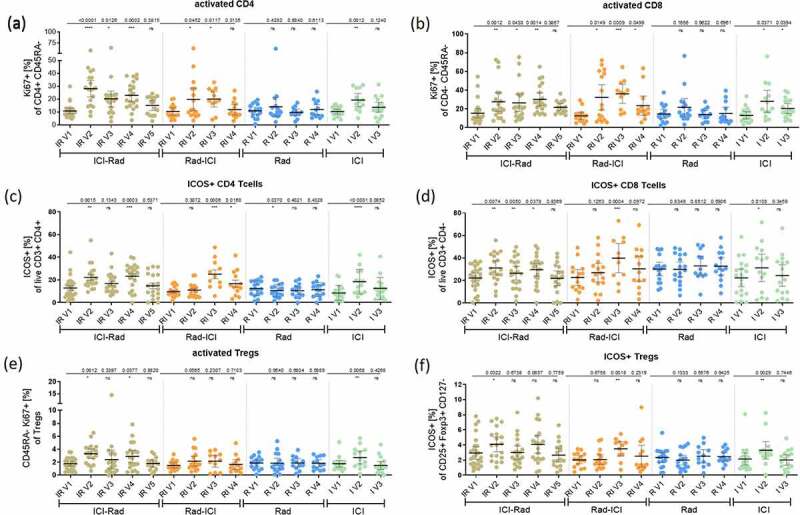
In patients with melanoma brain metastases (MBM), a combination of radiotherapy (RT) with immune checkpoint inhibitors (ICI) is routinely used. However, the best sequence of radio-immunotherapy (RIT) remains unclear. In an exploratory phase 2 trial, MBM patients received RT (stereotactic or whole-brain radiotherapy depending on the number of MBM) combined with ipilimumab (ipi) ± nivolumab (nivo) in different sequencing (Rad-ICI or ICI-Rad). Comparators arms included patients treated with ipi-free systemic treatment or without RT (in MBM-free patients). The primary endpoints were radiological and immunological responses in the peripheral blood. Secondary endpoints were progression-free survival (PFS) and overall survival (OS). Of 106 screened, 92 patients were included in the study. Multivariate analysis revealed an advantage for patients starting with RT (Rad-ICI) for overall response rate (RR: p = .007; HR: 7.88 (95%CI: 1.76-35.27)) and disease control rate (DCR: p = .036; HR: 6.26 (95%CI: 1.13-34.71)) with a trend for a better PFS (p = .162; HR: 1.64 (95%CI: 0.8-3.3)). After RT plus two cycles of ipi-based ICI in both RIT sequences, increased frequencies of activated CD4, CD8 T cells and an increase in melanoma-specific T cell responses were observed in the peripheral blood. Lasso regression analysis revealed a significant clinical benefit for patients treated with Rad-ICI sequence and immunological features, including high frequencies of memory T cells and activated CD8 T cells in the blood. This study supports increasing evidence that sequencing RT followed by ICI treatment may have better effects on the immunological responses and clinical outcomes in MBM patients.

Keywords: Melanoma; biomarkers; brain metastases; immune checkpoint inhibitors; immune monitoring; radiation; treatment sequence.


Conflict of interest statement

TES, HS, JM, DM, KL, MFH, IH, CK, RS, and PB declare no competing interests. JCH received scientific grant support from BMS; honoraria for talks from Almirall, Amgen, BMS, GSK, MSD, Novartis, Pfizer, Pierre Fabre, Roche, Sanofi; advisory board member for MSD, Pierre Fabre; travel grants from BMS, Immunocore, 4SC. MS received honoraria for talks from Novartis; travel grants from Merck, Abbvie, Novartis, Sanofi-Aventis, BMS, Merck Sharp & Dome, Pfizer. CM received a fellowship from the German Research Foundation (DFG) (ME 5482/1-1) 2/2020-5/2021. LK reports personal fees from Accuray Inc., and Novocure GmbH. AE received honoraria for Biotest AG, Meet the Experts, Janssen-Cilag, Klinikum Minden; consulting fees for Biotest AG, MSD, Galderma Laboratorium, Janssen-Cilag, Roche, AbbVie; advisory board member for MSD, Biotest. JD received grants from Viewray Inc, Accuray International Sari, RaySearch Laboratories AB, Vision RT Limited, Astellas Pharma GmbH, Siemens Healthcare GmbH, Solution Akademie GmbH, Egomed PLC Surrey Research Park, Quintiles GmbH, Pharmaceutical Research Associates GmbH, Boehringer Ingelheim Pharma GmbH&CoKG, PTW-Freiburg Dr. Pychlau GmbH, Nanobiotix S.A., Accuray Incorporated.

Figures

Figure 1.
Figure 1.
Flow diagram of the ELEKTRA trial.
Figure 2.
Figure 2.
Clinical results of the ELEKTRA trial (a) Schematic representation of Radioimmunotherapy (RIT) treatment with Rad-ICI (yellow) or ICI-Rad (green) sequence in MBM patients. V1-V5 in the diagram represents study visits and displays the respective time points of immunological evaluation. (b) Overall responses (left) and intracranial responses (right) in MBM patients who received Rad-ICI or ICI-Rad treatment sequence. The red bars represent patients with disease progression (PD), gray bars represent stable disease (SD) and green bars represent a partial or complete response (PR/CR). The numbers at the top edge of the bars represent the number of patients in the respective group (c) Kaplan Meier curves for progression-free survival (PFS; left) and overall survival (OS; right) of MBM patients considering Rad-ICI (red line) or ICI-Rad (blue line) treatment sequence. p-values refer to the log-rank test.
Figure 3.
Figure 3.
Longitudinal analysis of circulating T cell subsets plotted as the percentage of live single CD3 + T cells (a)activated CD4+ cells (b) activated CD8+ cells (c) ICOS+CD4+ cells (d) ICOS+CD8+ cells (e) activated Tregs (f) ICOS+Tregs. V1-V5 in the graphs represents the respective time points of immunological evaluation, as shown in Figure 2a. V1: baseline; V2: after the first dose of ICI (ICI-Rad) or after radiation (Rad-ICI); V3: after radiation (ICI-Rad) or after 2 cycles of ICI (Rad-ICI); V4: After two cycles of ICI (ICI-Rad) or after imaging (Rad-ICI); V5: after imaging (ICI-Rad). Each dot represents a measured value from a single patient at the given time point. The lines represent the mean with upper and lower 95% confidence intervals. Statistical comparisons between time points were made using the paired T-test. p-values < 0.05 were considered significant (****p < .0001, **p < .01, *p < .05). ns stands for no statistical significance.
Figure 4.
Figure 4.
Longitudinal monitoring of IFNγ ELISpot responses to tumor-specific antigens. The magnitude of IFNγ ELISpot responses to 5 tumor-related proteins (Melan-A, Tyrosinase, NA17-A, p53, MDM2) at indicated times during the treatment (a) Rad-ICI (b) ICI-Rad (c) Rad (d) ICI, expressed as log fold change in the average of spot-forming cells (SFC) over baseline values. Statistical comparisons between indicated time points were made using the two-way ANOVA. The lines represent the mean with the standard error of mean. p-values < 0.05 were considered significant (****p < .0001, ***p < .001 **p < .01, *p < .05). ns stands for no statistical significance.
Figure 5.
Figure 5.
Clinical and T cell parameters associated with treatment response. (a) Cross-Validation plot for Lasso regression (Lambda path for all n = 58 features). The plot displays the Cross-Validation error according to the log of the shrinkage parameter λ. The dashed lines indicate the log λ values corresponding to the λmin (left dashed line) and λ1se (right dashed line). λmin represents the value for which the model yields the lowest cross-validation mean squared error, hence minimizing the prediction error. The numbers on top represent the number of non-zero regression coefficients in the model (= the number of included features). From left to right along the x-axis, with increasing λ, fewer variables are included in the model since the penalty for inclusion of features is weighted more heavily. In other words: the log(λ) value at λmin corresponds to the most accurate model with the best predictive ability and the optimal/sparse set of features (n = 24). (b-e) Comparisons between T cell subsets (b) memory CD8 cells (c) activated memory CD8 cells (d) ICOS+ CD8 cells (e) activated Tregs at different time points in patients with progressive disease (PD) or disease control (DCR). The difference in the means of PD and DCR groups was assessed using an unpaired t-test, and p values were corrected for multiple comparisons using the Holm-Sidak method. The difference between the two-time points (baseline vs. two ICI cycles) was performed using 2-way ANOVA (Turkey‘s Multiple comparisons test). Adjusted p values were labeled on the top of the graphs (red for progression and green for disease control). The lines represent the mean with the standard error of the mean. p-values < 0.05 were considered significant.

References

    1. Davies MA, Liu P, McIntyre S, Kim KB, Papadopoulos N, Hwu W-J, Hwu P, Bedikian A.. Prognostic factors for survival in melanoma patients with brain metastases. Cancer. 2011;117(8):1687–12. published Online First: 2010/10/21. doi:10.1002/cncr.25634. - DOI - PubMed
    1. Patel JK, Didolkar MS, Pickren JW, Moore RH. Metastatic pattern of malignant melanoma. A study of 216 autopsy cases. Am J Surg. 1978;135(6):807–810. published Online First: 1978/06/01. doi:10.1016/0002-9610(78)90171-x. - DOI - PubMed
    1. Tawbi HA, Forsyth PA, Algazi A, Hamid O, Hodi FS, Moschos SJ, Khushalani NI, Lewis K, Lao CD, Postow MA, et al. Combined nivolumab and ipilimumab in melanoma metastatic to the brain. The New England Journal of Medicine. 2018;379(8):722–730. doi:10.1056/NEJMoa1805453. - DOI - PMC - PubMed
    1. Wolchok JD, Chiarion-Sileni V, Gonzalez R, Rutkowski P, Grob -J-J, Cowey CL, Lao CD, Wagstaff J, Schadendorf D, Ferrucci PF, et al. Overall survival with combined nivolumab and ipilimumab in advanced melanoma. N Engl J Med. 2017;377(14):1345–1356. published Online First: 2017/09/12. doi:10.1056/NEJMoa1709684. - DOI - PMC - PubMed
    1. Kluger HM, Chiang V, Mahajan A, Zito CR, Sznol M, Tran T, Weiss SA, Cohen JV, Yu J, Hegde U, et al. Long-Term survival of patients with melanoma with active brain metastases treated with pembrolizumab on a phase II Trial. J Clin Oncol. 2019;37(1):52–60. [published Online First: 2018/11/09]. doi:10.1200/jco.18.00204. - DOI - PMC - PubMed

Publication types