. 2022 May;31(5):e4286.
doi: 10.1002/pro.4286.

Structural insights into DNA binding domain of vancomycin-resistance-associated response regulator in complex with its promoter DNA from Staphylococcus aureus

Affiliations

Structural insights into DNA binding domain of vancomycin-resistance-associated response regulator in complex with its promoter DNA from Staphylococcus aureus

Jangam Vikram Kumar et al. Protein Sci. 2022 May.

Abstract

In Staphylococcus aureus, vancomycin-resistance-associated response regulator (VraR) is a part of the VraSR two-component system, which is responsible for activating a cell wall-stress stimulon in response to an antibiotic that inhibits cell wall formation. Two VraR-binding sites have been identified: R1 and R2 in the vraSR operon control region. However, the binding of VraR to a promoter DNA enhancing downstream gene expression remains unclear. VraR contains a conserved N-terminal receiver domain (VraRN ) connected to a C-terminal DNA binding domain (VraRC ) with a flexible linker. Here, we present the crystal structure of VraRC alone and in complex with R1-DNA in 1.87- and 2.0-Å resolution, respectively. VraRC consisting of four α-helices forms a dimer when interacting with R1-DNA. In the VraRC -DNA complex structure, Mg2+ ion is bound to Asp194. Biolayer interferometry experiments revealed that the addition of Mg2+ to VraRC enhanced its DNA binding affinity by eightfold. In addition, interpretation of NMR titrations between VraRC with R1- and R2-DNA revealed the essential residues that might play a crucial role in interacting with DNA of the vraSR operon. The structural information could help in designing and screening potential therapeutics/inhibitors to deal with antibiotic-resistant S. aureus via targeting VraR.

Keywords: DNA binding domain; NMR; Staphylococcus aureus; response regulator; two-component system; vancomycin resistance; x-ray crystal structure.


Conflict of interest statement

The authors declare that there is no conflict of interest regarding the publication of this paper.

Figures

FIGURE 1
FIGURE 1
AUC‐SV profiles showing sedimentation coefficient distribution. All the data were analyzed by using Sedfit for assessing molecular weights. (a) The c(S) distribution of unbound R1‐DNA is at 2.69 S and active VraR in complex with R1‐DNA had a peak shift at 5.07 S. (b) The c(S) distribution of inactive VraR and unbound R1‐DNA are at 2.7 S and a minor peak at 5.2 S for inactive VraR–DNA complex
FIGURE 2
FIGURE 2
Structural overview of VraRC in complex with promoter DNA. (a) Upstream and downstream binding of two VraRC subunits binding to R1‐DNA are shown in blue and orange, respectively. Secondary structural elements on both the subunits are labeled and six Mg2+ ions are in green spheres. (b) Schematic diagram showing detailed interactions between two VraRC molecules and DNA. Hydrogen bonds, electrostatic interactions are shown in green and brown dotted lines
FIGURE 3
FIGURE 3
Superimposition of VraRC from the R1‐DNA complex in yellow and activated VraR DBD (PDB ID: 4IF4) in light‐cyan. The Subunit‐B has slight rotation upon binding to DNA. Lys177 and Lys180 in the VraRC dimer from α9 helices are involved in binding to DNA are shown as sticks. Distances between two Lys177 and two Lys180 residues within DNA‐bound VraRC dimers were 2.2 and 1.0 Å closer than active VraR
FIGURE 4
FIGURE 4
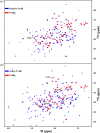
(a) The overlaid 2D 1H, 15N TROSY‐HSQC spectra were acquired from inactive VraR (blue) and VraRC (red). Residues Gln204 and Glu191 of α10 helix that interact with the N‐terminal domain of inactive VraR are labeled on VraRC. (b) The overlaid 2D 1H, 15N TROSY‐HSQC spectra were acquired from active VraR (blue) and VraRC (red). Residues Gly162, Thr196 and Gln197 involved in the DBD dimer of active VraR are labeled on VraRC. All samples were prepared at pH 6.0 and acquired spectra at 298 K
FIGURE 5
FIGURE 5
Interaction of VraRC with both R1‐ and R2‐DNAs inspected by NMR titrations. Plots of the normalized chemical shift perturbations of VraRC after binding to R1‐DNA (a) and R2‐DNA (b). Gaps indicate the missing peaks from DNA titration. Perturbed residues with values >0.06 (dotted black line) mapped on the structure of VraRC for both (c) R1‐DNA and (d) R2‐DNA titrations
FIGURE 6
FIGURE 6
Mg2+ ions shown as green spheres binding to Asp194 of two subunits in the VraRC–DNA complex. Subunits are shown in orange and blue. Each Mg2+ ion has a hydrogen bond interaction to the OD2 atom of Asp194 with a distance of 2 Å and 2.1 Å. Five water molecules coordinating the Mg2+ ions are in red spheres. The 2Fo‐Fc electron density map of Asp194, water molecules and Mg2+ ions was contoured at 1σ and shown as a blue mesh
FIGURE 7
FIGURE 7
R1‐DNA binding affinity of VraRC at different concentrations measured with BLI technology both in the absence (a) and presence (b) of 10 mM MgCl2. All data were processed and analyzed by a double reference subtraction method by using Octet Data Analysis Software. The 2:1 binding model of association and dissociation function was used to determine K d in the global fitting. (c) The electrostatic potential surface of VraRC was calculated with the Pymol plugin APBS, showing red for the negative surface and blue for the positive charge surface. A slight negative charge appearing near the side chain of Asp194 was labeled. (d) Thermal denaturation curves of VraRC–DNA complex in the presence (blue) and absence (red) of 10 mM MgCl2 were monitored at 222 nm, revealing melting temperatures of 61.0 and 56.3°C, respectively
FIGURE 8
FIGURE 8
Packing within the crystal of VraRC–DNA complex is shown among three asymmetric units in pink, blue and yellow. Crystal contacts of DNAs were observed between two C4–C4 and C11′–C11′ nucleotides. The detailed Mg2+ ions interaction within two asymmetric units between DNAs are in boxes. Each Mg2+ ion (green spheres) binds with OP1 (asymmetric unit1) and OP2 (asymmetric unit2) atoms of C4 nucleotides with 2.0 and 2.1 Å and are surrounded by water molecules (red spheres)

References

    1. Swartz MN. Use of antimicrobial agents and drug resistance. N Engl J Med. 1997;337:491–492. - PubMed
    1. Davies J. Microbes have the last word. EMBO Rep. 2007;8:616–621. - PMC - PubMed
    1. Li B, Webster TJ. Bacteria antibiotic resistance: New challenges and opportunities for implant‐associated orthopedic infections. J Orthop Res. 2018;36:22–32. - PMC - PubMed
    1. Emori TG, Gaynes RP. An overview of nosocomial infections, including the role of the microbiology laboratory. Clin Microbiol Rev. 1993;6:428–442. - PMC - PubMed
    1. Rice LB. Federal funding for the study of antimicrobial resistance in nosocomial pathogens: No ESKAPE. J Infect Dis. 2008;197:1079–1081. - PubMed

Publication types

MeSH terms

LinkOut - more resources