

Structural dynamics shape the fitness window of alanine:glyoxylate aminotransferase
- PMID: 35481644
- PMCID: PMC8996469
- DOI: 10.1002/pro.4303
Structural dynamics shape the fitness window of alanine:glyoxylate aminotransferase
Abstract
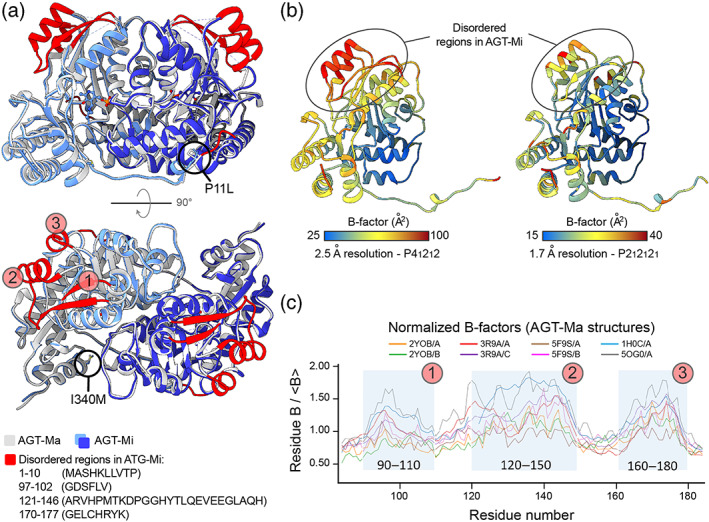
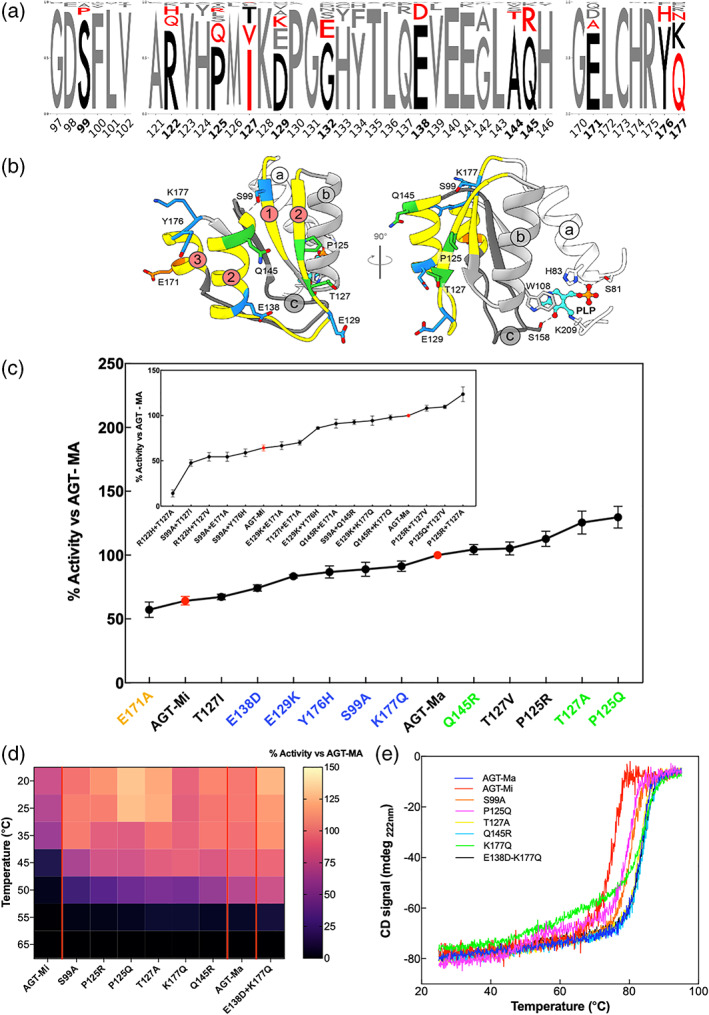
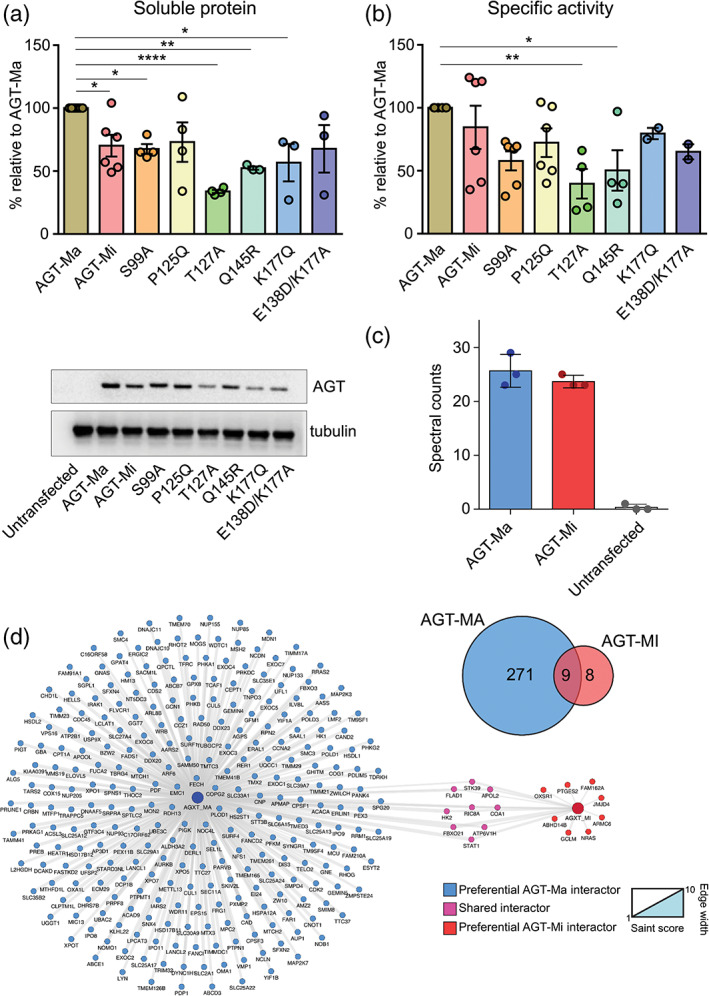
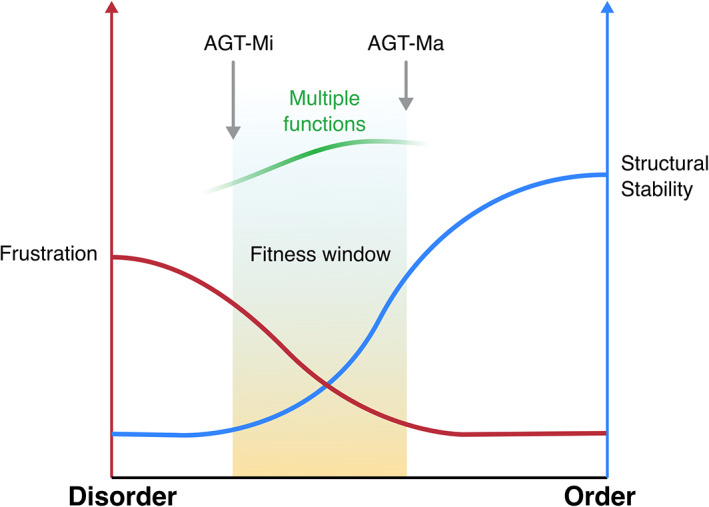
The conformational landscape of a protein is constantly expanded by genetic variations that have a minimal impact on the function(s) while causing subtle effects on protein structure. The wider the conformational space sampled by these variants, the higher the probabilities to adapt to changes in environmental conditions. However, the probability that a single mutation may result in a pathogenic phenotype also increases. Here we present a paradigmatic example of how protein evolution balances structural stability and dynamics to maximize protein adaptability and preserve protein fitness. We took advantage of known genetic variations of human alanine:glyoxylate aminotransferase (AGT1), which is present as a common major allelic form (AGT-Ma) and a minor polymorphic form (AGT-Mi) expressed in 20% of Caucasian population. By integrating crystallographic studies and molecular dynamics simulations, we show that AGT-Ma is endowed with structurally unstable (frustrated) regions, which become disordered in AGT-Mi. An in-depth biochemical characterization of variants from an anticonsensus library, encompassing the frustrated regions, correlates this plasticity to a fitness window defined by AGT-Ma and AGT-Mi. Finally, co-immunoprecipitation analysis suggests that structural frustration in AGT1 could favor additional functions related to protein-protein interactions. These results expand our understanding of protein structural evolution by establishing that naturally occurring genetic variations tip the balance between stability and frustration to maximize the ensemble of conformations falling within a well-defined fitness window, thus expanding the adaptability potential of the protein.
Keywords: alanine:glyoxylate aminotransferases; conformational plasticity; protein evolution; protein fitness; structural dynamics.
© 2022 The Authors. Protein Science published by Wiley Periodicals LLC on behalf of The Protein Society.
Conflict of interest statement
The authors have declared no conflicts of interest for this article.
Figures

Similar articles
-
Misfolding caused by the pathogenic mutation G47R on the minor allele of alanine:glyoxylate aminotransferase and chaperoning activity of pyridoxine.Biochim Biophys Acta. 2015 Oct;1854(10 Pt A):1280-9. doi: 10.1016/j.bbapap.2015.07.002. Epub 2015 Jul 3. Biochim Biophys Acta. 2015. PMID: 26149463
-
Molecular defects of the glycine 41 variants of alanine glyoxylate aminotransferase associated with primary hyperoxaluria type I.Proc Natl Acad Sci U S A. 2010 Feb 16;107(7):2896-901. doi: 10.1073/pnas.0908565107. Epub 2010 Feb 1. Proc Natl Acad Sci U S A. 2010. PMID: 20133649 Free PMC article.
-
Human liver peroxisomal alanine:glyoxylate aminotransferase: Different stability under chemical stress of the major allele, the minor allele, and its pathogenic G170R variant.Biochimie. 2010 Dec;92(12):1801-11. doi: 10.1016/j.biochi.2010.08.005. Epub 2010 Aug 14. Biochimie. 2010. PMID: 20713123
-
Human liver peroxisomal alanine:glyoxylate aminotransferase: characterization of the two allelic forms and their pathogenic variants.Biochim Biophys Acta. 2011 Nov;1814(11):1577-84. doi: 10.1016/j.bbapap.2010.12.005. Epub 2010 Dec 20. Biochim Biophys Acta. 2011. PMID: 21176891 Review.
-
Alanine:glyoxylate aminotransferase peroxisome-to-mitochondrion mistargeting in human hereditary kidney stone disease.Biochim Biophys Acta. 2003 Apr 11;1647(1-2):70-5. doi: 10.1016/s1570-9639(03)00055-4. Biochim Biophys Acta. 2003. PMID: 12686111 Review.
Cited by
-
Advancing Molecular Simulations: Merging Physical Models, Experiments, and AI to Tackle Multiscale Complexity.J Phys Chem Lett. 2025 Apr 17;16(15):3606-3615. doi: 10.1021/acs.jpclett.5c00652. Epub 2025 Apr 3. J Phys Chem Lett. 2025. PMID: 40179097 Free PMC article. Review.
-
A molecular journey on the pathogenesis of primary hyperoxaluria.Curr Opin Nephrol Hypertens. 2024 Jul 1;33(4):398-404. doi: 10.1097/MNH.0000000000000987. Epub 2024 Apr 11. Curr Opin Nephrol Hypertens. 2024. PMID: 38602143 Free PMC article. Review.
-
Effect of the allelic background on the phenotype of primary hyperoxaluria type I.Curr Opin Nephrol Hypertens. 2025 Mar 1;34(2):177-183. doi: 10.1097/MNH.0000000000001057. Epub 2024 Dec 6. Curr Opin Nephrol Hypertens. 2025. PMID: 39641329 Free PMC article. Review.
-
Identification of Human Alanine-Glyoxylate Aminotransferase Ligands as Pharmacological Chaperones for Variants Associated with Primary Hyperoxaluria Type 1.J Med Chem. 2022 Jul 28;65(14):9718-9734. doi: 10.1021/acs.jmedchem.2c00142. Epub 2022 Jul 13. J Med Chem. 2022. PMID: 35830169 Free PMC article.
-
A Minor Haplotype Variant Determines the Pathogenicity of the p.Ile279Thr Substitution in the Primary Hyperoxaluria Type 1 Gene, AGXT.J Inherit Metab Dis. 2025 Jul;48(4):e70052. doi: 10.1002/jimd.70052. J Inherit Metab Dis. 2025. PMID: 40495747 Free PMC article.
References
-
- Uversky VN. Intrinsically disordered proteins and their “mysterious” (meta)physics. Front Phys. 2019;7:10.
Publication types
MeSH terms
Substances
LinkOut - more resources
Full Text Sources
Miscellaneous
