. 2023 Feb;19(2):518-531.
doi: 10.1002/alz.12675. Epub 2022 Apr 28.

Predictive metabolic networks reveal sex- and APOE genotype-specific metabolic signatures and drivers for precision medicine in Alzheimer's disease

Affiliations

Predictive metabolic networks reveal sex- and APOE genotype-specific metabolic signatures and drivers for precision medicine in Alzheimer's disease

Rui Chang et al. Alzheimers Dement. 2023 Feb.

Abstract

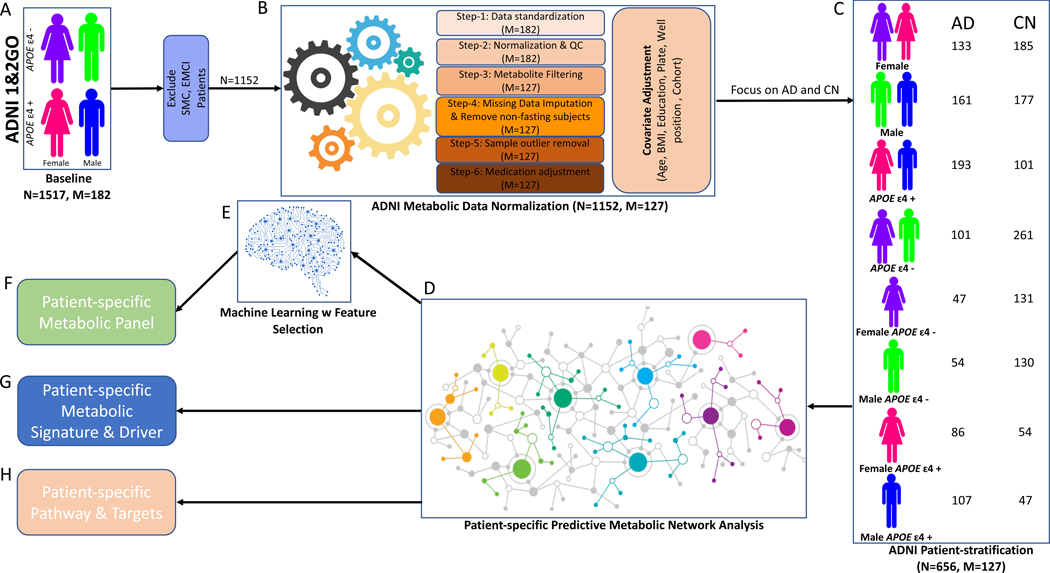
Introduction: Late-onset Alzheimer's disease (LOAD) is a complex neurodegenerative disease characterized by multiple progressive stages, glucose metabolic dysregulation, Alzheimer's disease (AD) pathology, and inexorable cognitive decline. Discovery of metabolic profiles unique to sex, apolipoprotein E (APOE) genotype, and stage of disease progression could provide critical insights for personalized LOAD medicine.

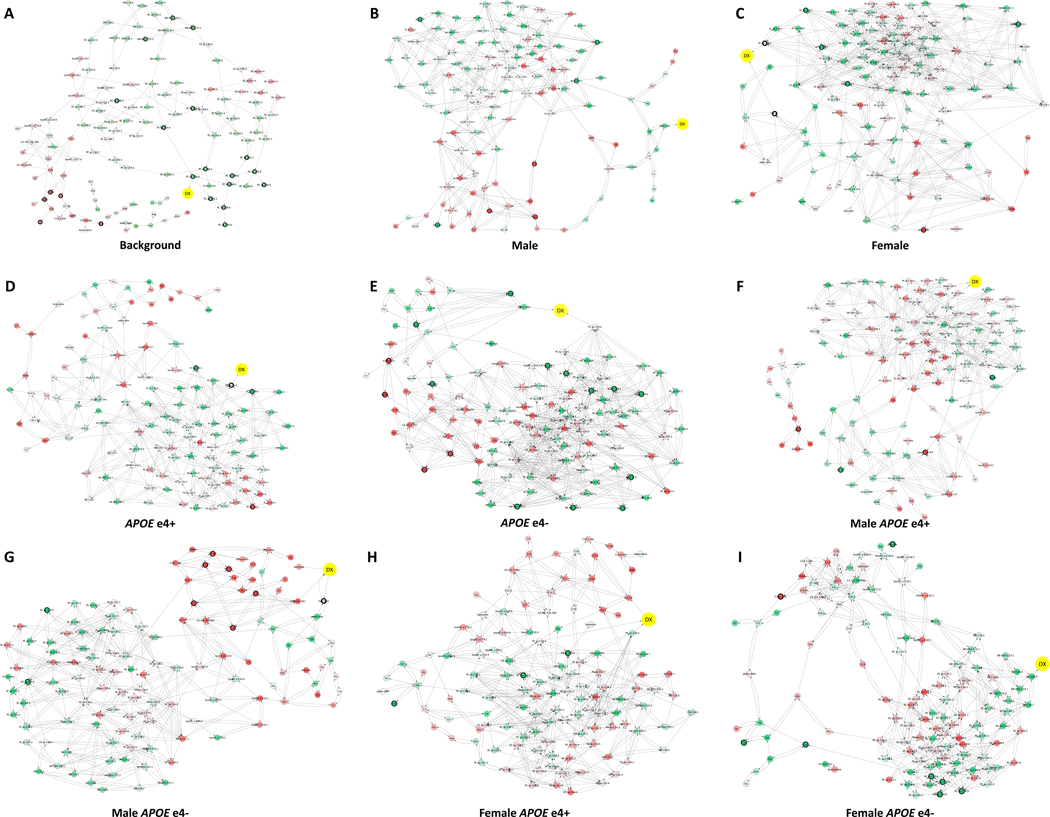
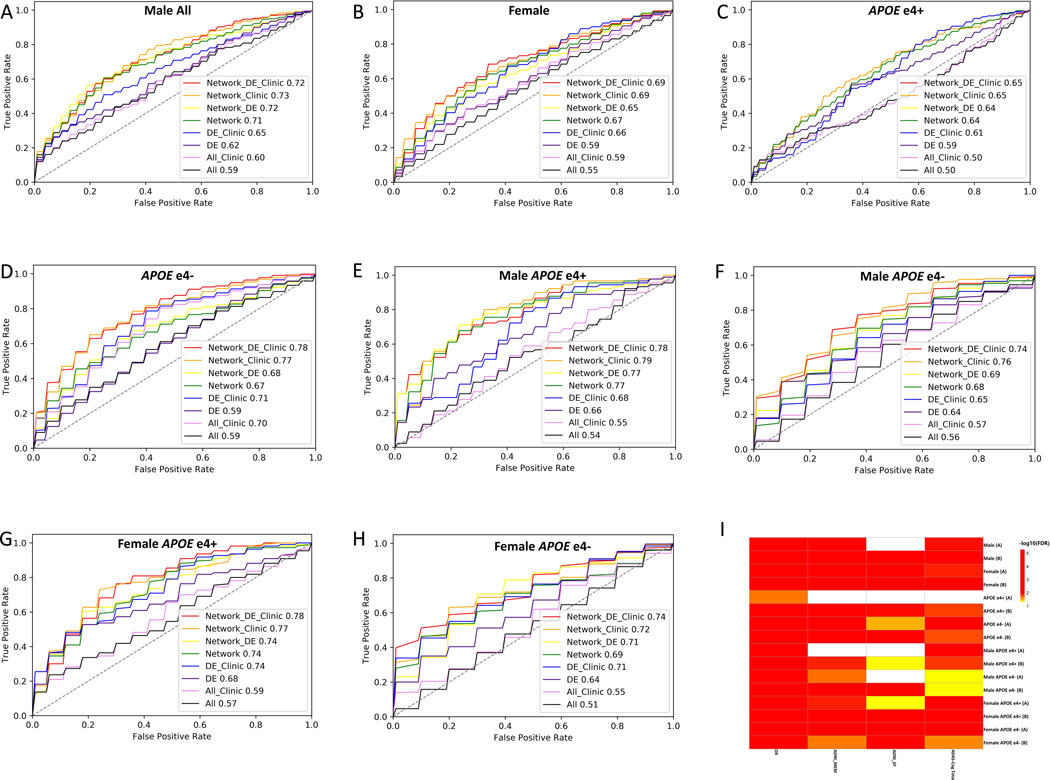
Methods: Sex- and APOE-specific metabolic networks were constructed based on changes in 127 metabolites of 656 serum samples from the Alzheimer's Disease Neuroimaging Initiative cohort.

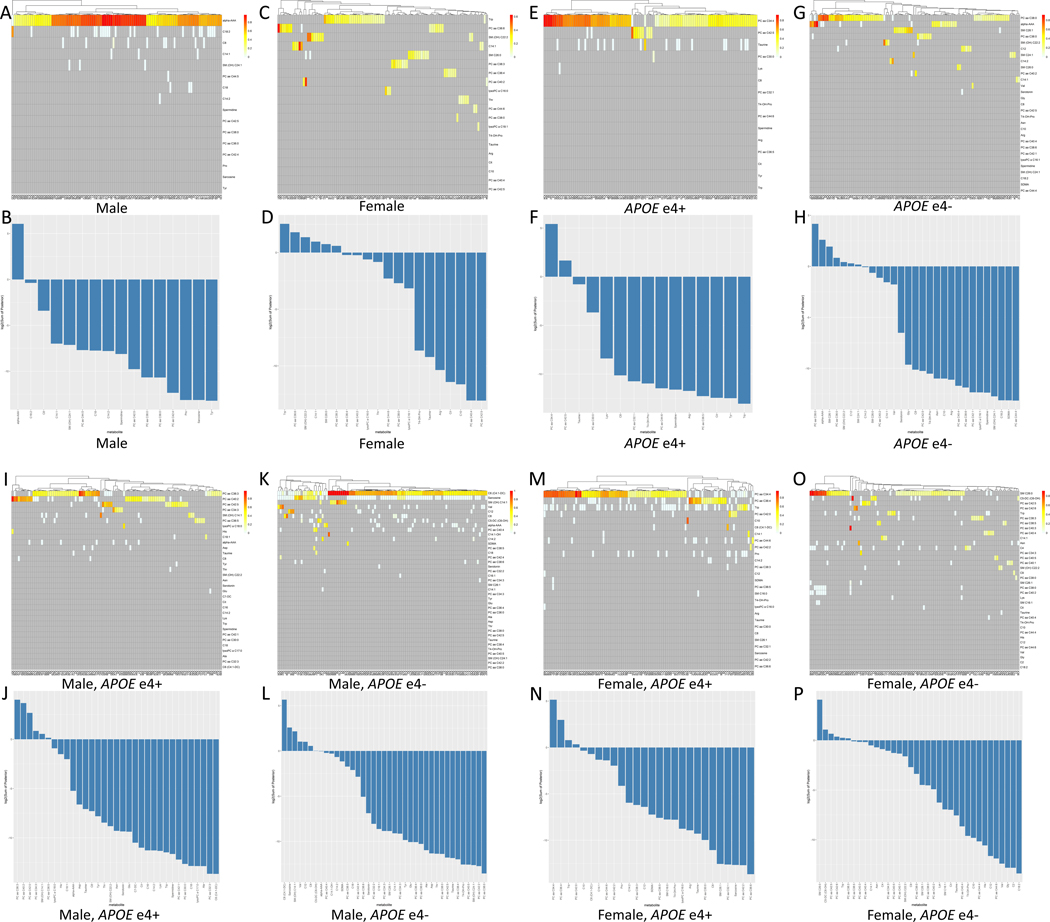
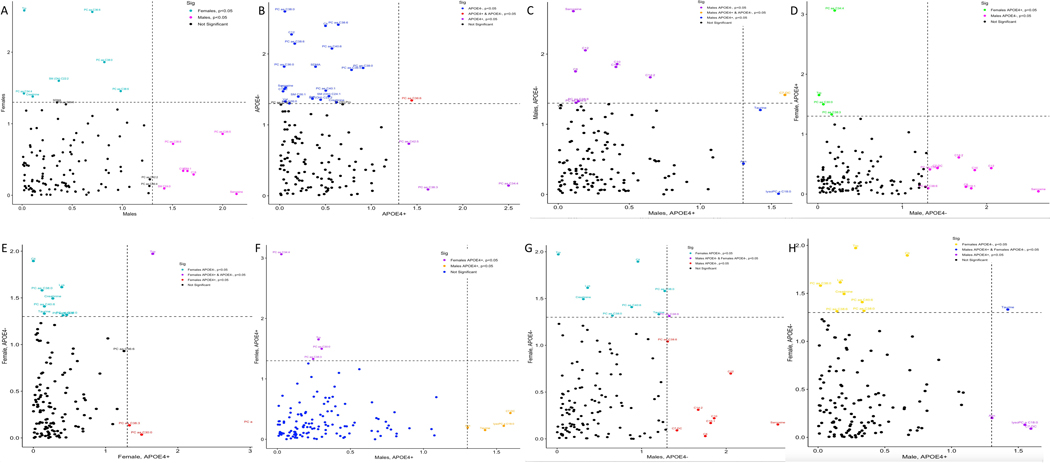
Results: Application of an advanced analytical platform identified metabolic drivers and signatures clustered with sex and/or APOE ɛ4, establishing patient-specific biomarkers predictive of disease state that significantly associated with cognitive function. Presence of the APOE ɛ4 shifts metabolic signatures to a phosphatidylcholine-focused profile overriding sex-specific differences in serum metabolites of AD patients.

Discussion: These findings provide an initial but critical step in developing a diagnostic platform for personalized medicine by integrating metabolomic profiling and cognitive assessments to identify targeted precision therapeutics for AD patient subgroups through computational network modeling.

Keywords: Alzheimer's Disease Neuroimaging Initiative; apolipoprotein E ε4; computational systems biology; late-onset Alzheimer's disease; metabolic biomarkers; metabolic network; metabolomics; precision medicine; sex-specific metabolic changes.


Conflict of interest statement

Competing interest statement

The other authors declare no competing interests.

Figures

Figure 1.
Figure 1.. Analytical pipeline utilized in the study.
The analytical pipeline included 1152 samples from ADNI cohort. Patients with self-memory complain (SMC) and early mild cognitive impairment (EMCI) were removed leaving 1152 samples from AD, late mild cognitive impairment (LMCI) and CN (A). Data were normalized; the residuals were obtained after covariate adjustment (B). 362 CN and 294 AD samples were stratified into eight groups based on sex and APOE genotype (C). A predictive network model was built (D) to derive patient-specific metabolic signatures and drivers of progression from CN to AD in each group (G). The DE analysis identified significant changes in metabolites. Metabolic biomarker panels (F) were derived using machine learning models (E). Patient-specific pathways were identified based on metabolic signatures and drivers (H). N, the number of participants; M, the number of metabolites; ADNI, AD Neuroimaging Initiative; ADNI 1&2GO, phase 1 and phase 2/GO of ADNI; QC, quality control; AD, Alzheimer disease; CN, cognitive normal; BMI, body mass index.
Figure 2.
Figure 2.. Sex- and APOE-specific consensus predictive metabolic network
To build consensus causal predictive metabolic network, we subsampled 100 datasets and constructed 100 metabolic networks per patient group. The 95% confidence interval is calculated per edge. The consensus network models were used to identify the upstream metabolites and pathways associated with AD in background with all 656 AD and CN samples (A), males (B), females (C), APOEɛ4+ (D), APOEɛ4- (E), male APOEɛ4+ (F), male APOEɛ4- (G), female APOEɛ4+ (H), female APOEɛ4- (I). Dx, disease diagnosis. Red color indicates metabolites metabolite level is increased in AD comparing to CN; green color indicates metabolite level is decreased in AD comparing to CN. Significant DE metabolites are indicated with black circles.
Figure 3.
Figure 3.. Sex- and APOE-specific metabolic heterogeneity
In each group, the confidence and robustness of metabolic drivers were shown in the heatmap where the X-axis represents 100 different networks and Y-axis represents candidate key drivers in 100 networks. Each row in the heatmap represents a vector of 100 posterior probability values of the edge from a key driver to Dx derived from 100 networks, and the bar plot is ranked based on the log2 of the sum of the 100 posterior values per key driver in male (A,B), female (C,D), APOEɛ4+ (E,F), APOEɛ4- (G,H), male APOEɛ4+ (I,J), male APOEɛ4- (K,L), female APOEɛ4+ (M,N), female APOEɛ4- (O,P).
Figure 4.
Figure 4.. Sex- and APOE-specific metabolic differential expression analysis
The significant P-value<0.05 of differentially produced metabolites are compared between patient groups to illustrate the specificity and commonality of AD-associated metabolic signatures to sex and APOE genotype. (A) Male vs Female; (B) APOEɛ4+ vs APOEɛ4-; (C) Male APOEɛ4+ vs Male APOEɛ4-; (D) Male APOEɛ4- vs Female APOEɛ4+; (E) Female APOEɛ4+ vs Female APOEɛ4-; (F) Male APOEɛ4+ vs Female APOEɛ4+; (G) Male APOEɛ4- vs Female APOEɛ4+; (H) Male APOEɛ4+ vs Female APOEɛ4-.
Figure 5.
Figure 5.. Biomarker panel and cross-validation accuracy for AD diagnosis
The prediction performance of diagnostic biomarker panels derived from different sets of features are compared in each patient group, The number in the figure represents the averaged cross-validation AUC with 8 feature sets respectively in male (A), female (B), APOEɛ4+ (C), APOEɛ4- (D), male APOEɛ4+ (E), male APOEɛ4- (F), female APOEɛ4+ (G), male APOEɛ4- (H); All, all 127 metabolites in the data; All Clinic, all 127 metabolites in the data combines with age, BMI and/or education; DE: significant DE metabolites; DE Clinic: significant DE metabolites combined with age, BMI and/or education; Network: biomarkers derived from metabolic network; Network_DE: biomarkers derived from the combination of significant DE and metabolic network; Network_DE_Clinic: biomarkers derived from combination of significant DE metabolites, metabolic network and age, BMI, and/or education. Network_Clinic: biomarkers derived from metabolic network and age, BMI and/or education; (I) Two selected optimal biomarker panel association with clinical assessment and cognitive decline: The association of the two selected biomarker panel with and without Age, BMI and Education in each patient group (A: biomarker pane derived from metabolic network; B: biomarker pane derived from combination metabolic network plus age, BMI and/or education) with diagnosis (Dx) and clinical assessments (ADAS-Cog Total Score, memory function (ADNI_MEM) and executive function (ADNI_EF)).

References

    1. Jansen IE, et al., Genome-wide meta-analysis identifies new loci and functional pathways influencing Alzheimer’s disease risk. Nat Genet, 2019. 51(3): p. 404–413. - PMC - PubMed
    1. Guo L, et al., Sex Differences in Alzheimer’s Disease: Insights From the Multiomics Landscape. Biol Psychiatry, 2021. - PMC - PubMed
    1. Talwar P, et al., Dissecting Complex and Multifactorial Nature of Alzheimer’s Disease Pathogenesis: a Clinical, Genomic, and Systems Biology Perspective. Mol Neurobiol, 2016. 53(7): p. 4833–64. - PubMed
    1. Zhang B, et al., Integrated systems approach identifies genetic nodes and networks in late-onset Alzheimer’s disease. Cell, 2013. 153(3): p. 707–20. - PMC - PubMed
    1. Wilkins JM and Trushina E, Application of Metabolomics in Alzheimer’s Disease. Front Neurol, 2017. 8: p. 719. - PMC - PubMed