. 2022 Apr 28:11:e76564.
doi: 10.7554/eLife.76564.

Neuronal apoptosis drives remodeling states of microglia and shifts in survival pathway dependence

Affiliations

Neuronal apoptosis drives remodeling states of microglia and shifts in survival pathway dependence

Sarah Rose Anderson et al. Elife. .

Abstract

Microglia serve critical remodeling roles that shape the developing nervous system, responding to the changing neural environment with phagocytosis or soluble factor secretion. Recent single-cell sequencing (scRNAseq) studies have revealed the context-dependent diversity in microglial properties and gene expression, but the cues promoting this diversity are not well defined. Here, we ask how interactions with apoptotic neurons shape microglial state, including lysosomal and lipid metabolism gene expression and dependence on Colony-stimulating factor 1 receptor (CSF1R) for survival. Using early postnatal mouse retina, a CNS region undergoing significant developmental remodeling, we performed scRNAseq on microglia from mice that are wild-type, lack neuronal apoptosis (Bax KO), or are treated with CSF1R inhibitor (PLX3397). We find that interactions with apoptotic neurons drive multiple microglial remodeling states, subsets of which are resistant to CSF1R inhibition. We find that TAM receptor Mer and complement receptor 3 are required for clearance of apoptotic neurons, but that Mer does not drive expression of remodeling genes. We show TAM receptor Axl is negligible for phagocytosis or remodeling gene expression but is consequential for microglial survival in the absence of CSF1R signaling. Thus, interactions with apoptotic neurons shift microglia toward distinct remodeling states and through Axl, alter microglial dependence on survival pathway, CSF1R.

Keywords: CSF1R; TAM receptors; microglia; mouse; neuronal cell death; neuroscience; retinal development; single cell analysis.


Conflict of interest statement

SA, JR, NG, EI, JS, IC, AB, MV No competing interests declared

Figures
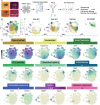
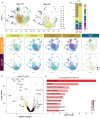
Figure 1.
Figure 1.. Multiple microglial states coexist in postnatal retina.
(A) Workflow for collection, dissociation, sorting, sequencing, and filtering of individual microglia from four different groups. 13 P6/P7 animals from 6 litters (26 retinas) pooled for Bax WT and KO samples, 12 P6/P7 animals from 2 litters (24 retinas) for PLX, and 11 animals from 2 litters (22 retinas) for Vehicle. (B) UMAP plot of 13,667 microglia cells from all 4 samples distributed into 11 clusters by unsupervised clustering. Blue cells to the right of cluster 1 are members of cluster 6. (C) UMAP plots illustrating the distribution of cells from each condition. Number of cells per condition labeled in lower left. (D) UMAP plots of two genes enriched in each cluster. Color scale is based on relative gene expression: dark purple = highest, light yellow = lowest.
Figure 1—figure supplement 1.
Figure 1—figure supplement 1.. Gating strategy for FAC-sorting retinal microglia for single-cell sequencing.
(A) Gating strategy for FACs of Sample 1 (primarily Bax WT) and (B) Sample 2 (primarily Bax KO) for single-cell sequencing. Animals were a mixture of CX3CR1-GFP/ + and CX3CR1-+/+. CCR2 was used to exclude monocytes and macrophages. (C) Gating strategy for FACs of CX3CR1-GFP/ + Vehicle and (D) PLX3397 treated samples. Ly6C was used to exclude monocytes and macrophages.
Figure 1—figure supplement 2.
Figure 1—figure supplement 2.. Selection of high-quality cells.
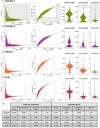
(A–D) Cells, as identified by CellRanger, were filtered to exclude low quality cells: those with few features (genes) or high mitochondrial content. Cells with especially high transcript counts were eliminated as potential doublets. Cutoffs were set independently for Sample 1 (A), Sample 2 (B), Vehicle (C), and PLX (D) samples. (E) Dataset composition before and after cell filtering.
Figure 1—figure supplement 3.
Figure 1—figure supplement 3.. In Silico Bax genotyping.
(A) Summary of in silico genotyping workflow from alignment files to genotyping of individual cells. (B,C) Density plots of the two populations of cells identified by single nucleotide polymorphism content from Sample 1 (B) and Sample 2 (C). Y-axis is density scaled to the number of cells x 1000, and X-axis is natural-log normalized Bax counts. Populations are colored by their resulting genotype assignments: Bax WT (yellow) or Bax KO (maroon). (D) Table of the number of cells from the filtered dataset (Sample 1 or Sample 2) ultimately assigned to each genotype (Bax WT or Bax KO). (E,F) UMAP dimensional reduction of cells from Sample 1 (E’, green) or Sample 2 (D’’, purple) and reassigned to Bax WT (F’, yellow) or Bax KO (F’’, maroon).
Figure 1—figure supplement 4.
Figure 1—figure supplement 4.. Identification of non-microglia populations.
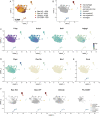
(A) UMAP plot of 15,084 cells from all four conditions. Bax KO, 4224 cells; Bax WT 4902 cells; Vehicle, 4198 cells; PLX3397, 1760 cells. (B) UMAP plot with clusters labeled based on published markers: macrophages (dark red), monocytes (light red), perivascular macrophages (yellow), other myeloid-like cells (teal), non-myeloid 1 and 2 (shades of blue), and microglia (gray). (C) UMAP plots colored by relative gene expression (dark purple = highest, light yellow = lowest) of highly expressed or specific microglia genes. (D) UMAP plots of published monocyte or macrophage genes. (E) UMAP plot of neuronal gene expression. (F) UMAP plots illustrating the distribution of cells across clusters for each sample.
Figure 1—figure supplement 5.
Figure 1—figure supplement 5.. Postnatal retinal microglia express Ccl3 in vivo.
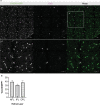
(A) Max projected confocal image of in situ hybridization chain reaction (HCR) on P7 whole mount retina probed for Ccl3. CX3CR1-GFP (protein, green), Ccl3 (RNA, magenta). A’ inset, higher magnification. Scale bar 50 µm (B) Percent Ccl3+ of CX3CR1-GFP+ cells in each layer of the P7 retina of the mid-periphery. (n => 3; ± SEM). Data are from a single experiment. NFL, nerve fiber layer; IPL, inner plexiform layer; OPL, outer plexiform layer.
Figure 2.
Figure 2.. Postnatal microglia encompass a spectrum of states from homeostatic to remodeling.
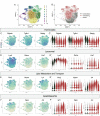
(A) UMAP plot of 11 clusters from all sequenced microglia. (B) UMAP plot identifying clusters assigned homeostatic, remodeling, and mitotic. (C) UMAP and (C’) violin plots of microglial homeostatic genes. (D) UMAP and (D’) violin plots of select genes important for lysosomal function. (E) UMAP and (E’) violin plots of genes associated with lipid metabolism. (F) UMAP and (F’) violin plots of DAM/PAM/ATM genes. Color scale for UMAP plots is based on relative gene expression: dark purple = highest, light yellow = lowest.
Figure 3.
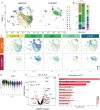
Figure 3.. Neuronal apoptosis drives multiple microglial remodeling states.
(A) UMAP plot of microglia cells from Bax WT (left) and Bax KO (right) samples distributed into 11 clusters. (B) Bar graph of the proportion of cells in each cluster for each sample. Chi-square test comparing cluster distribution ****p < 0.0001. (C) UMAP plots showing expression of representative genes from selected clusters. (D) Volcano plot showing differential gene expression of all Bax KO cells compared to Bax WT cells. Each gene is plotted according to the significance (-Log(p value)) and magnitude (Log(fold change)) of the difference such that those genes enriched in Bax KO are colored purple, and those down-regulated in Bax KO are yellow. Differentially expressed genes are defined by p-value ≤ 0.05 and absolute value of Log(fold change) > 0.25. (E) KEGG Pathway analysis of 183 downregulated genes in Bax KO compared to Bax WT using GeneCodis 4.
Figure 3—figure supplement 1.
Figure 3—figure supplement 1.. Bax KO retinas have reduced microglia density.
(A) Max projected confocal image of P7 wildtype whole mount retina. CX3CR1-gfp (green); C1q (magenta). Scale bar 100 µm. (B) Percent colocalization of C1q+ cells to CX3CR1-GFP+. (n = 1 WT, n = 4 HET, n = 4 KO; ± SEM) Kruskal-Wallis test statistic = 4.818, p = 0.0667. Data from two litters. (C) Max projected confocal image of whole mount immunostained retinas of Bax WT and littermate Bax KO. CX3CR1-gfp (green); C1q (magenta). Scale bar 50 µm. (D) Quantification of C1q+ microglia in a 0.526 mm2 area of the dorsal, mid-peripheral, vascularized region of the retina. (n = 3 WT, n = 11 Het, n = 9 KO; ± SEM) Data from three litters. One-way ANOVA F(2,20)=19.90 p < 0.0001 and Tukey’s multiple comparisons test *p = 0.0112, ****p < 0.0001.
Figure 4.
Figure 4.. Subsets of remodeling states survive CSF1R inhibition, while homeostatic microglia are more vulnerable.
(A) UMAP plot of microglia cells from Vehicle (left) and PLX3397 (right) samples distributed into 11 clusters. (B) Proportion of cells from each sample across 11 clusters. Chi-square test comparing cluster distribution ****p < 0.0001. (C) UMAP plots showing expression of representative genes from selected clusters. (D) Violin plot of Csf1r expression across clusters. Asterisks mark those clusters with reduced Csf1r expression when compared to all other cells. *padj <0.0001. (E) Volcano plot showing differential gene expression of all PLX cells compared to Vehicle cells. Each gene is plotted according to the significance (-Log(p value)) and magnitude (Log(fold change)) of the difference such that those genes enriched in PLX are colored red, and those downregulated in PLX are orange. Differentially expressed genes are defined by p-value ≤ 0.05 and absolute value of Log(fold change) > 0.25. (F) KEGG Pathway analysis of 254 upregulated genes in PLX compared to Vehicle using GeneCodis 4.
Figure 5.
Figure 5.. Mer and complement receptor 3 (CR3) are required for apoptotic retinal ganglion cell (RGC) clearance.
(A) Cartoon of candidate pathways. (B) Schematic for collection at P5 after the bulk of RGC developmental death. (C) Quantification of the average of central and peripheral 0.4 mm2 RGC death (Figure 5—figure supplement 2B) in dorsal leaf of all genotypes. (left) (n = 6 CX3CR1 WT, n = 8 CX3CR1-GFP/+, n = 4 CX3CR1 KO, n = 13 CR3 KO, CX3CR1-GFP/+; ± SEM) ≥ 2 litters collected for each genotype. Welch’s ANOVA test W(3,12.58) = 23.75, p < 0.0001 and Dunnett’s T3 multiple comparisons tests. (right) (n = 5 Mertk WT, n = 13 Mertk KO, n = 8 Axl KO, n = 15 Mertk Axl dKO; ± SEM) ≥ 2 litters collected for each genotype. Kruskal-Wallis test statistic = 25.97 p < 0.0001 and Dunn’s multiple comparisons tests. Not all comparisons shown on graphs but can be found in Supplementary file 7. (D) Max projected confocal images of dying RGCs (CC3+RBPMS+) in KOs in the dorsal mid-periphery in the ganglion cell layer. Apoptotic bodies, CC3 (magenta); RGCs, RBPMS (green). Scale bars 10 µm.
Figure 5—figure supplement 1.
Figure 5—figure supplement 1.. Loss of candidate receptors does not alter microglial density, RGC density, or blood vessel development.
(A) Max projected confocal images of whole mount immunostained retinas of all genotypes at P5 of dorsal leaf, mid-peripheral region. C1q (mono). Scale bar 100 µm. (B) Microglia density (C1q+/mm2) for each genotype in dorsal leaf, mid-peripheral, vascularized region. (n = 6 CX3CR1-GFP/+, n = 5 CX3CR1 KO, n = 6 CR3 KO CX3CR1-GFP/+, n = 6 Mertk KO, n = 6 Axl KO, n = 7 Mertk Axl dKO; ± SEM) ≥ 2 litters collected for each genotype. Kruskal-Wallis test statistic = 15.91 p = 0.0071 and Dunn’s multiple comparisons tests. (C) Max projected confocal images of whole mount immunostained retinas of all genotypes at P5 of dorsal leaf, mid-peripheral region. CC3 (mono). Scale bar 100 µm. (D) Total apoptotic body density (CC3+/mm2) for each genotype in entire dorsal leaf (Figure 5—figure supplement 2A). (left) (n = 7 CX3CR1 WT, n = 8 CX3CR1 KO, n = 17 CR3 KO CX3CR1-GFP/+; ± SEM) ≥ 2 litters collected for each genotype. Ordinary one-way ANOVA F(2, 29) = 12.95 p < 0.0001 and Tukey’s multiple comparisons tests. (right) (Mertk WT, n = 12 Mertk KO, n = 12 Axl KO, n = 16 Mertk Axl dKO; ± SEM) ≥ 2 litters collected for each genotype. Welch’s ANOVA test W(3.00,23.07) = 90.36 p < 0.0001 and Dunnett’s T3 multiple comparisons tests. Not all comparisons shown on graph but can be found in Supplementary file 7. (E) Max projected confocal images of whole mount immunostained retinas of all genotypes at P5 of dorsal leaf, mid-peripheral region. RBPMS (mono). Scale bar 100 µm. (F and G) RBPMS density for each genotype in dorsal leaf, central (F) and peripheral (G). (n = 9,8 CX3CR1-GFP/+, n = 4 CX3CR1 KO, n = 5 CR3 KO CX3CR1-GFP/+, n = 7 Mertk KO, n = 8 Axl KO, n = 7 Mertk Axl dKO; ± SEM) ≥ 2 litters collected for each genotype. (F) Central: Ordinary one-way ANOVA F(5,34)=1.391, p = 0.2522 and (G) Peripheral: Ordinary one-way ANOVA F(5,33)=0.43259, p = 0.8937. (H) Max projected confocal images of whole mount immunostained retinas of all genotypes at P5 of dorsal leaf. IB4-lectin (mono). Scale bar 100 µm. ≥ 2 litters observed for each genotype.
Figure 5—figure supplement 2.
Figure 5—figure supplement 2.. Analysis of CC3 and CC3/RBPMS density.
(A) Max projected confocal images of dorsal leaf of whole mount immunostained retinas to illustrate area analyzed for total apoptotic body density. Apoptotic cells, CC3 (magenta); RGCs, RBPMS (green). Circular grid in increments of 500 µm. White line in merge outlines area analyzed. Scale bar 100 µm. (B) Confocal of whole mount immunostained retinas. Apoptotic cells, CC3 (magenta); RGCs, RBPMS (green). Circular grid in increments of 500 µm. One central and one peripheral ROI of 0.400 mm2 was analyzed in the dorsal leaf of each animal and averaged. Scale bar 100 µm.
Figure 6.
Figure 6.. Axl signaling promotes microglial survival in the absence of CSF1R signaling.
(A) Dosing regimen of PLX3397 to various genotypes. (B) Confocal images of microglia in the NFL/GCL in all genotypes from central to mid-periphery of the dorsal leaf. C1q (mono). Scale bars 100 µm. (C) Ratio of density of CD45+CX3CR1-gfp+ or CD45+CD11b+ (microglia/singlets) in PLX treated retinas over genotype-matched controls by flow cytometry. (n = 17 CX3CR1-GFP/+, n = 5 Bax KO, n = 11 CX3CR1 KO, n = 5 CR3 KO CX3CR1-GFP/+, n = 9 Mertk KO, n = 8 Axl KO, n = 7 Mertk Axl dKO; ± SEM) ≥ 2 litters collected for each genotype. Line demarcates data from CX3CR1-GFP/ + and Bax KO previously published in Anderson et al., 2019a. Welch’s ANOVA W(6,18.55) = 16.53, p < 0.0001 and Dunnett’s T3 multiple comparisons test. Not all comparisons shown but can be found in Supplementary file 7.
Figure 7.
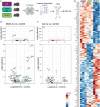
Figure 7.. Mer and Axl are not required for expression of lysosomal, lipid metabolism, or remodeling genes.
(A) Workflow for P4 retinal collection, dissociation, sorting, and bulk sequencing of microglia from three different groups: WT, Mertk KO, and Axl KOs (n = 3 each). (B,C) Volcano plot of differentially expressed genes in (B) Mertk KO versus WT of (C) Axl KO versus WT. Top, showing all genes and bottom, zoomed in to axis. Each gene is plotted according to the significance (-Log(p value)) and magnitude (Log2 (fold change)) of the difference such that those genes enriched in KO are green and those downregulated in KO are purple. Colored points indicate genes with p-value ≤ 0.05 and absolute value of Log2(fold change) > 0.5. (D) Heatmap of all differentially expressed genes between WT and Mertk KO and WT and Axl KO, colored by z-score of rlog values across samples.
Figure 7—figure supplement 1.
Figure 7—figure supplement 1.. Mertk Axl dKO microglia have a modest change in expression of lysosomal, lipid metabolism, and remodeling genes.
(A) Workflow for P7 retinal collection, dissociation, sorting, and bulk sequencing of microglia from 2 groups: WT, Mertk Axl dKO (n = 3 each). (B) Volcano plot of bulk sequencing on sorted microglia from WT and Mertk Axl dKO retinas (n = 3 each) padj <0.05. 404 upregulated and 1013 downregulated genes in dKO versus WT. (B) Heatmap of bulk sequencing on sorted microglia from WT and Mertk Axl dKO retinas top 20 genes upregulated and downregulated in dKO versus WT, colored by z-score of rlog values across samples.
Author response image 1.

References

    1. A-Gonzalez N, Quintana JA, García-Silva S, Mazariegos M, González de la Aleja A, Nicolás-Ávila JA, Walter W, Adrover JM, Crainiciuc G, Kuchroo VK, Rothlin CV, Peinado H, Castrillo A, Ricote M, Hidalgo A. Phagocytosis imprints heterogeneity in tissue-resident macrophages. The Journal of Experimental Medicine. 2017;214:1281–1296. doi: 10.1084/jem.20161375. - DOI - PMC - PubMed
    1. Anderson SR, Roberts JM, Zhang J, Steele MR, Romero CO, Bosco A, Vetter ML. Developmental Apoptosis Promotes a Disease-Related Gene Signature and Independence from CSF1R Signaling in Retinal Microglia. Cell Reports. 2019a;27:2002–2013. doi: 10.1016/j.celrep.2019.04.062. - DOI - PMC - PubMed
    1. Anderson SR, Zhang J, Steele MR, Romero CO, Kautzman AG, Schafer DP, Vetter ML. Complement Targets Newborn Retinal Ganglion Cells for Phagocytic Elimination by Microglia. The Journal of Neuroscience. 2019b;39:2025–2040. doi: 10.1523/JNEUROSCI.1854-18.2018. - DOI - PMC - PubMed
    1. Anderson SR, Vetter ML. Developmental roles of microglia: A window into mechanisms of disease. Developmental Dynamics. 2019c;248:98–117. doi: 10.1002/dvdy.1. - DOI - PMC - PubMed
    1. Axelrod H, Pienta KJ. Axl as a mediator of cellular growth and survival. Oncotarget. 2014;5:8818–8852. doi: 10.18632/oncotarget.2422. - DOI - PMC - PubMed

Publication types

Substances

Associated data