

Portable air cleaners and residential exposure to SARS-CoV-2 aerosols: A real-world study
- PMID: 35481935
- PMCID: PMC9111720
- DOI: 10.1111/ina.13029
Portable air cleaners and residential exposure to SARS-CoV-2 aerosols: A real-world study
Abstract
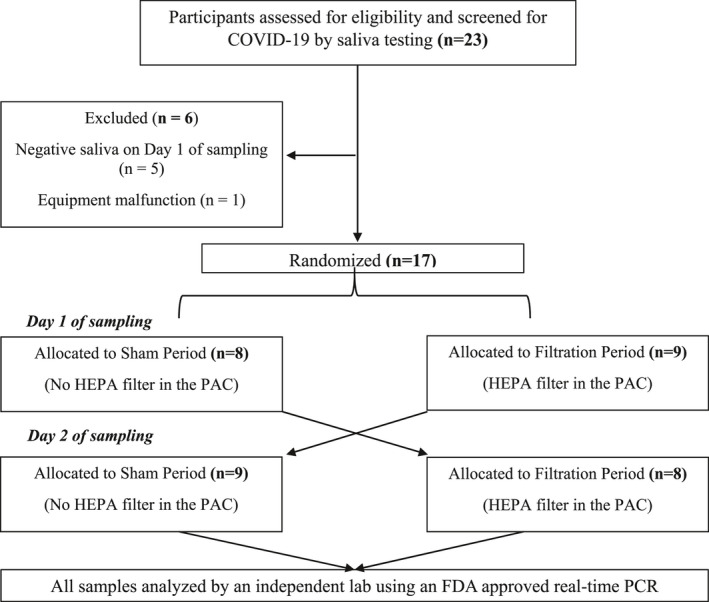
Individuals with COVID-19 who do not require hospitalization are instructed to self-isolate in their residences. Due to high secondary infection rates in household members, there is a need to understand airborne transmission of SARS-CoV-2 within residences. We report the first naturalistic intervention study suggesting a reduction of such transmission risk using portable air cleaners (PACs) with HEPA filters. Seventeen individuals with newly diagnosed COVID-19 infection completed this single-blind, crossover, randomized study. Total and size-fractionated aerosol samples were collected simultaneously in the self-isolation room with the PAC (primary) and another room (secondary) for two consecutive 24-h periods, one period with HEPA filtration and the other with the filter removed (sham). Seven out of sixteen (44%) air samples in primary rooms were positive for SARS-CoV-2 RNA during the sham period. With the PAC operated at its lowest setting (clean air delivery rate [CADR] = 263 cfm) to minimize noise, positive aerosol samples decreased to four out of sixteen residences (25%; p = 0.229). A slight decrease in positive aerosol samples was also observed in the secondary room. As the world confronts both new variants and limited vaccination rates, our study supports this practical intervention to reduce the presence of viral aerosols in a real-world setting.
Keywords: Air change rate; Airborne transmission; COVID-19 pandemic; COVID-19 symptoms; PTFE filter virus sampling; SARS-CoV-2 aerosols.
© 2022 The Authors. Indoor Air published by John Wiley & Sons Ltd.
Conflict of interest statement
No conflict of interest declared.
Figures


References
-
- CDC . Coronavirus Disease 2019 (COVID‐19). Centers for Disease Control and Prevention. February 11, 2020. Accessed December 8, 2021. https://www.cdc.gov/coronavirus/2019‐ncov/variants/delta‐variant.html
-
- WHO . WHO Coronavirus (COVID‐19) Dashboard. Accessed January 9, 2021. https://covid19.who.int
-
- WHO . United States of America: WHO Coronavirus Disease (COVID‐19) dashboard with vaccination data. Accessed January 9, 2022. https://covid19.who.int
-
- CDC . COVID Data Tracker for United States. Centers for Disease Control and Prevention. March 28, 2020. Accessed December 8, 2021. https://covid.cdc.gov/covid‐data‐tracker
-
- Liu Y, Ning Z, Chen Y, et al. Aerodynamic analysis of SARS‐CoV‐2 in two Wuhan hospitals. Nature. 2020;582:557‐560. - PubMed
Publication types
MeSH terms
Substances
Grants and funding
LinkOut - more resources
Full Text Sources
Medical
Research Materials
Miscellaneous
