

Household Secondary Attack Rates of SARS-CoV-2 by Variant and Vaccination Status: An Updated Systematic Review and Meta-analysis
- PMID: 35482308
- PMCID: PMC9051991
- DOI: 10.1001/jamanetworkopen.2022.9317
Household Secondary Attack Rates of SARS-CoV-2 by Variant and Vaccination Status: An Updated Systematic Review and Meta-analysis
Abstract
Importance: An overall household secondary attack rate (SAR) of 18.9% (95% CI, 16.2%-22.0%) through June 17, 2021 was previously reported for SARS-CoV-2. Emerging variants of concern and increased vaccination have affected transmission rates.
Objective: To evaluate how reported household SARs changed over time and whether SARs varied by viral variant and index case and contact vaccination status.
Data sources: PubMed and medRxiv from June 18, 2021, through March 8, 2022, and reference lists of eligible articles. Preprints were included.
Study selection: Articles with original data reporting the number of infected and total number of household contacts. Search terms included SARS-CoV-2, COVID-19, variant, vaccination, secondary attack rate, secondary infection rate, household, index case, family contacts, close contacts, and family transmission.
Data extraction and synthesis: The Preferred Reporting Items for Systematic Reviews and Meta-Analyses reporting guideline was followed. Meta-analyses used generalized linear mixed models to obtain SAR estimates and 95% CIs.
Main outcomes and measures: SAR stratified by covariates according to variant, index case and contact vaccination status, and index case identification period. SARs were used to estimate vaccine effectiveness on the basis of the transmission probability for susceptibility to infection (VES,p), infectiousness given infection (VEI,p), and total vaccine effectiveness (VET,p).
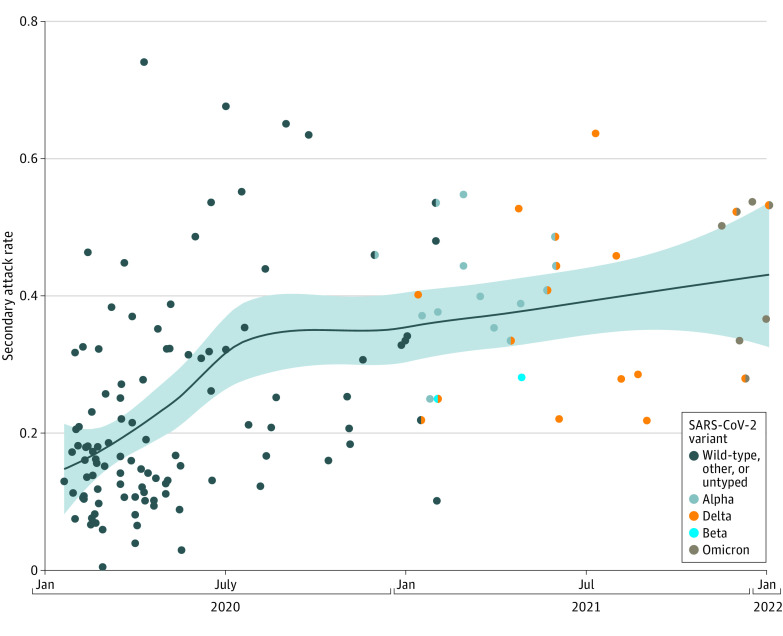
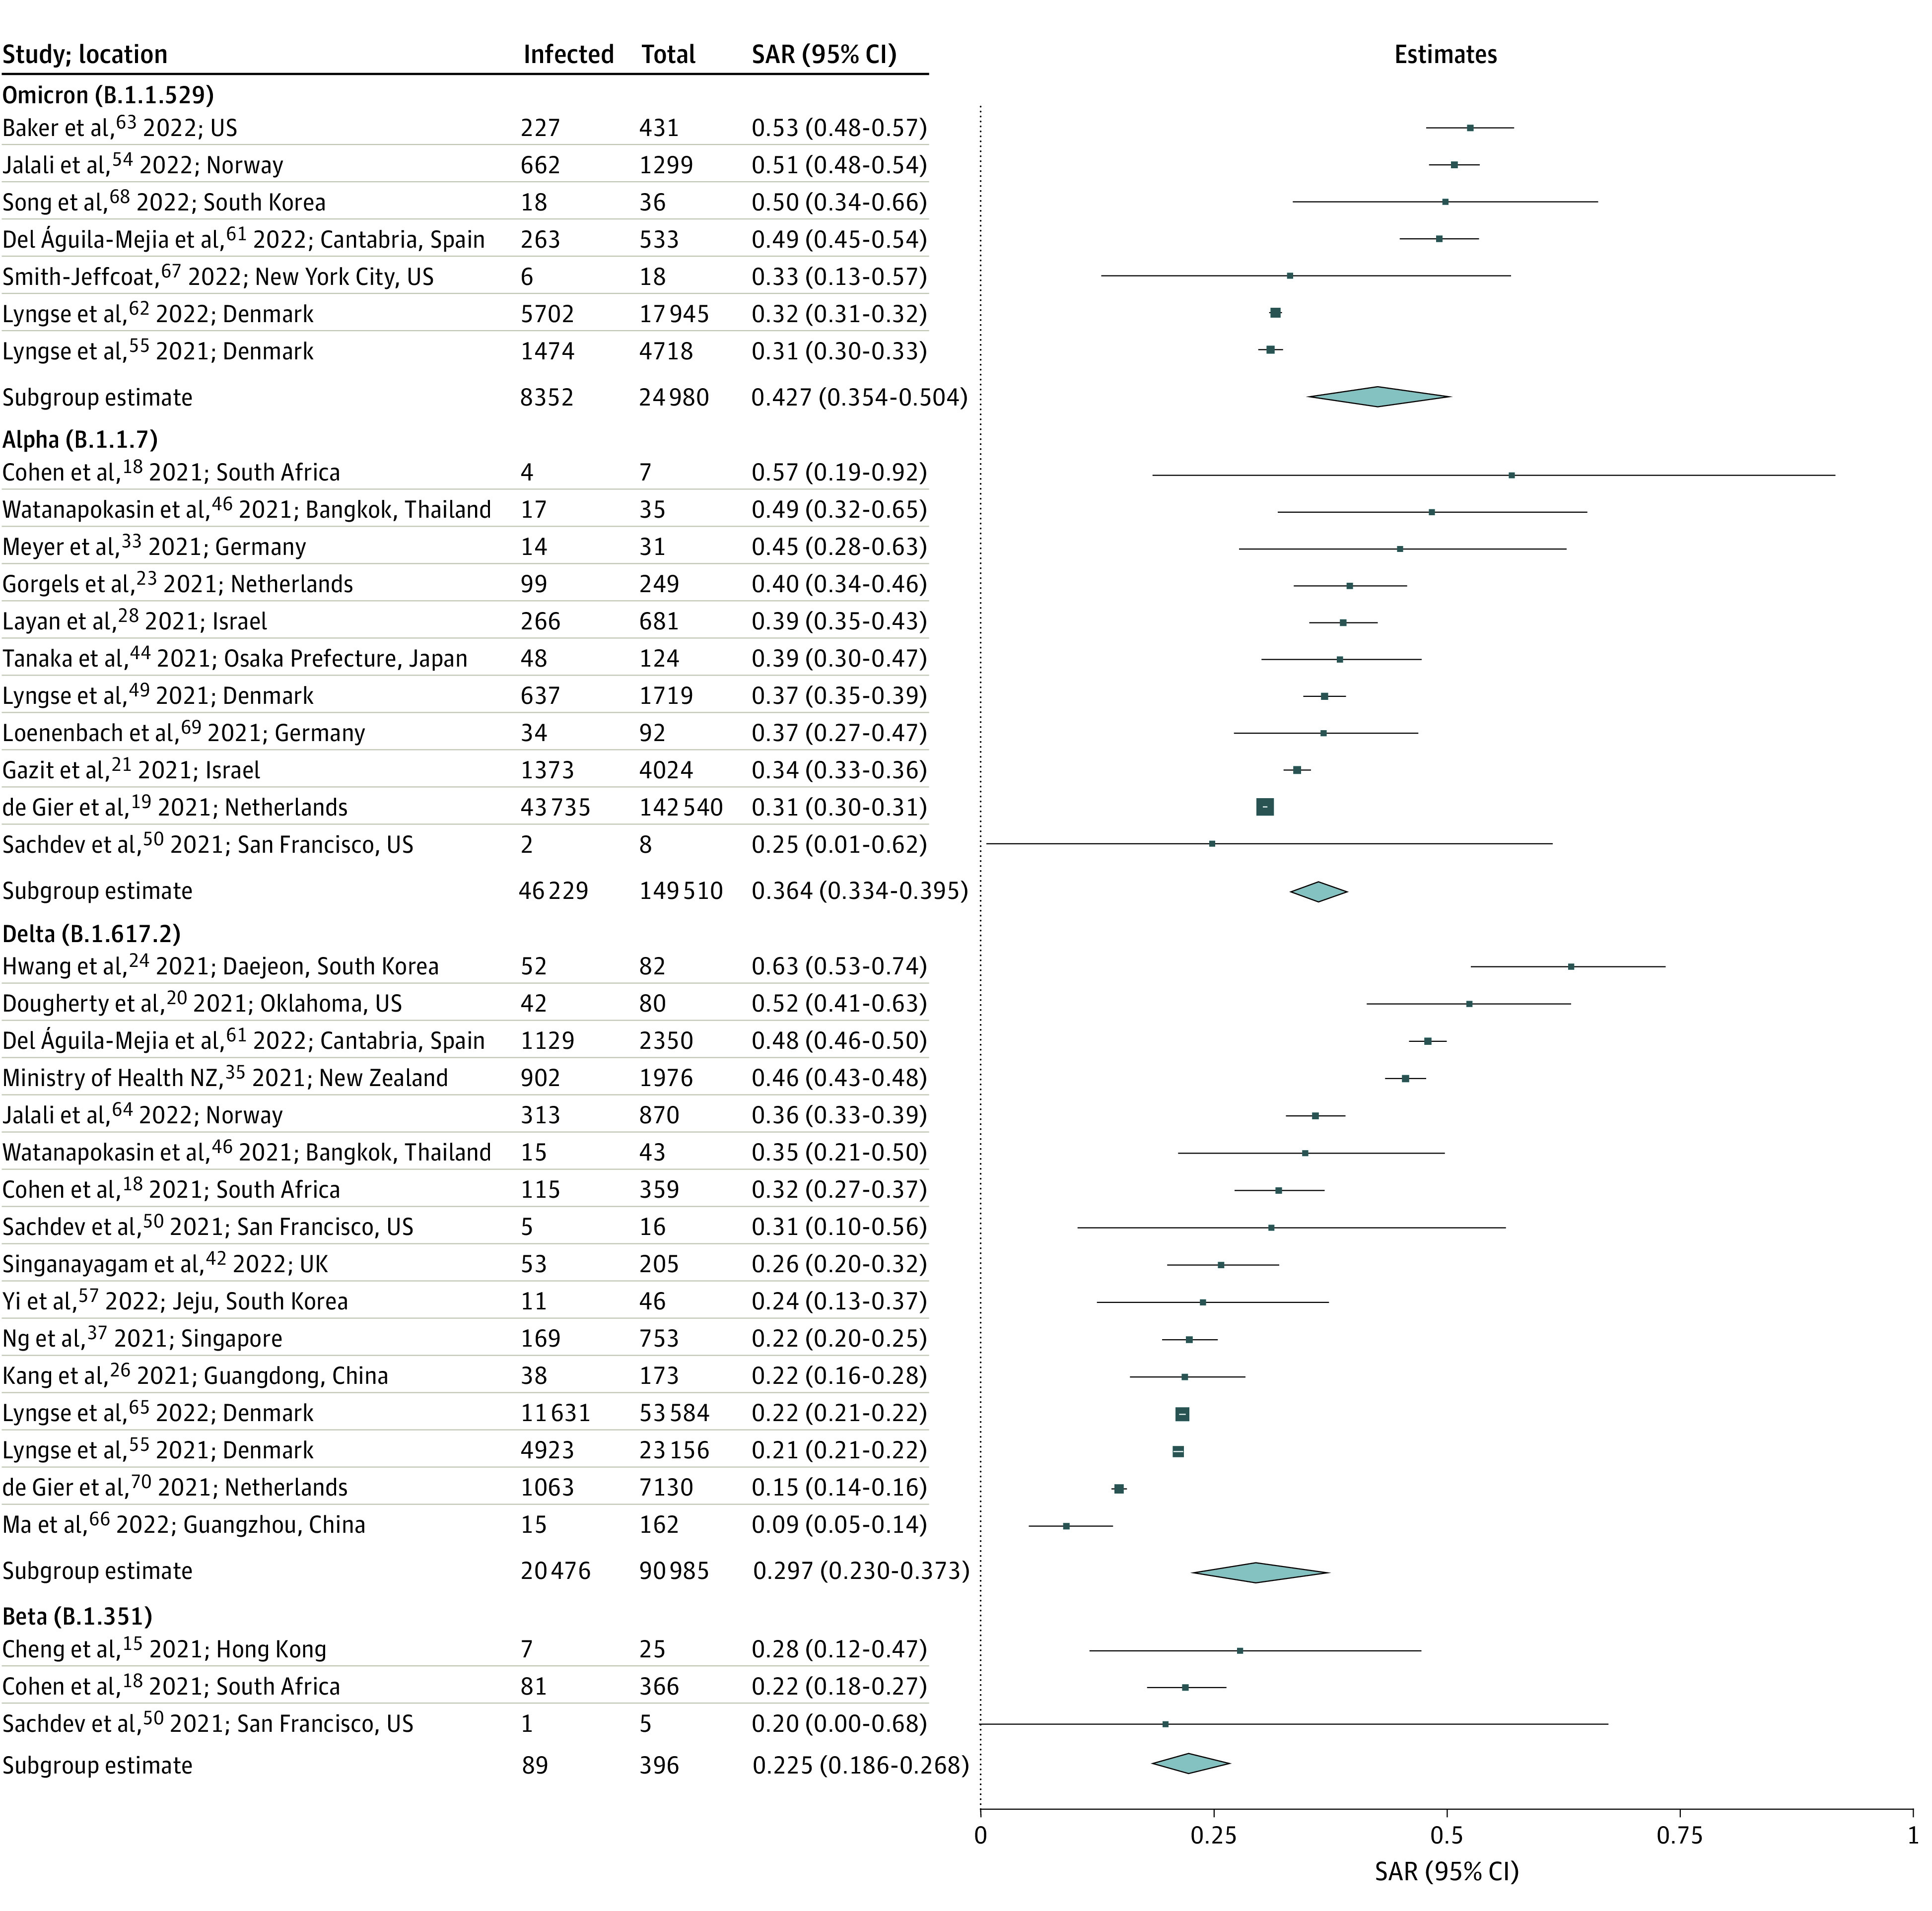
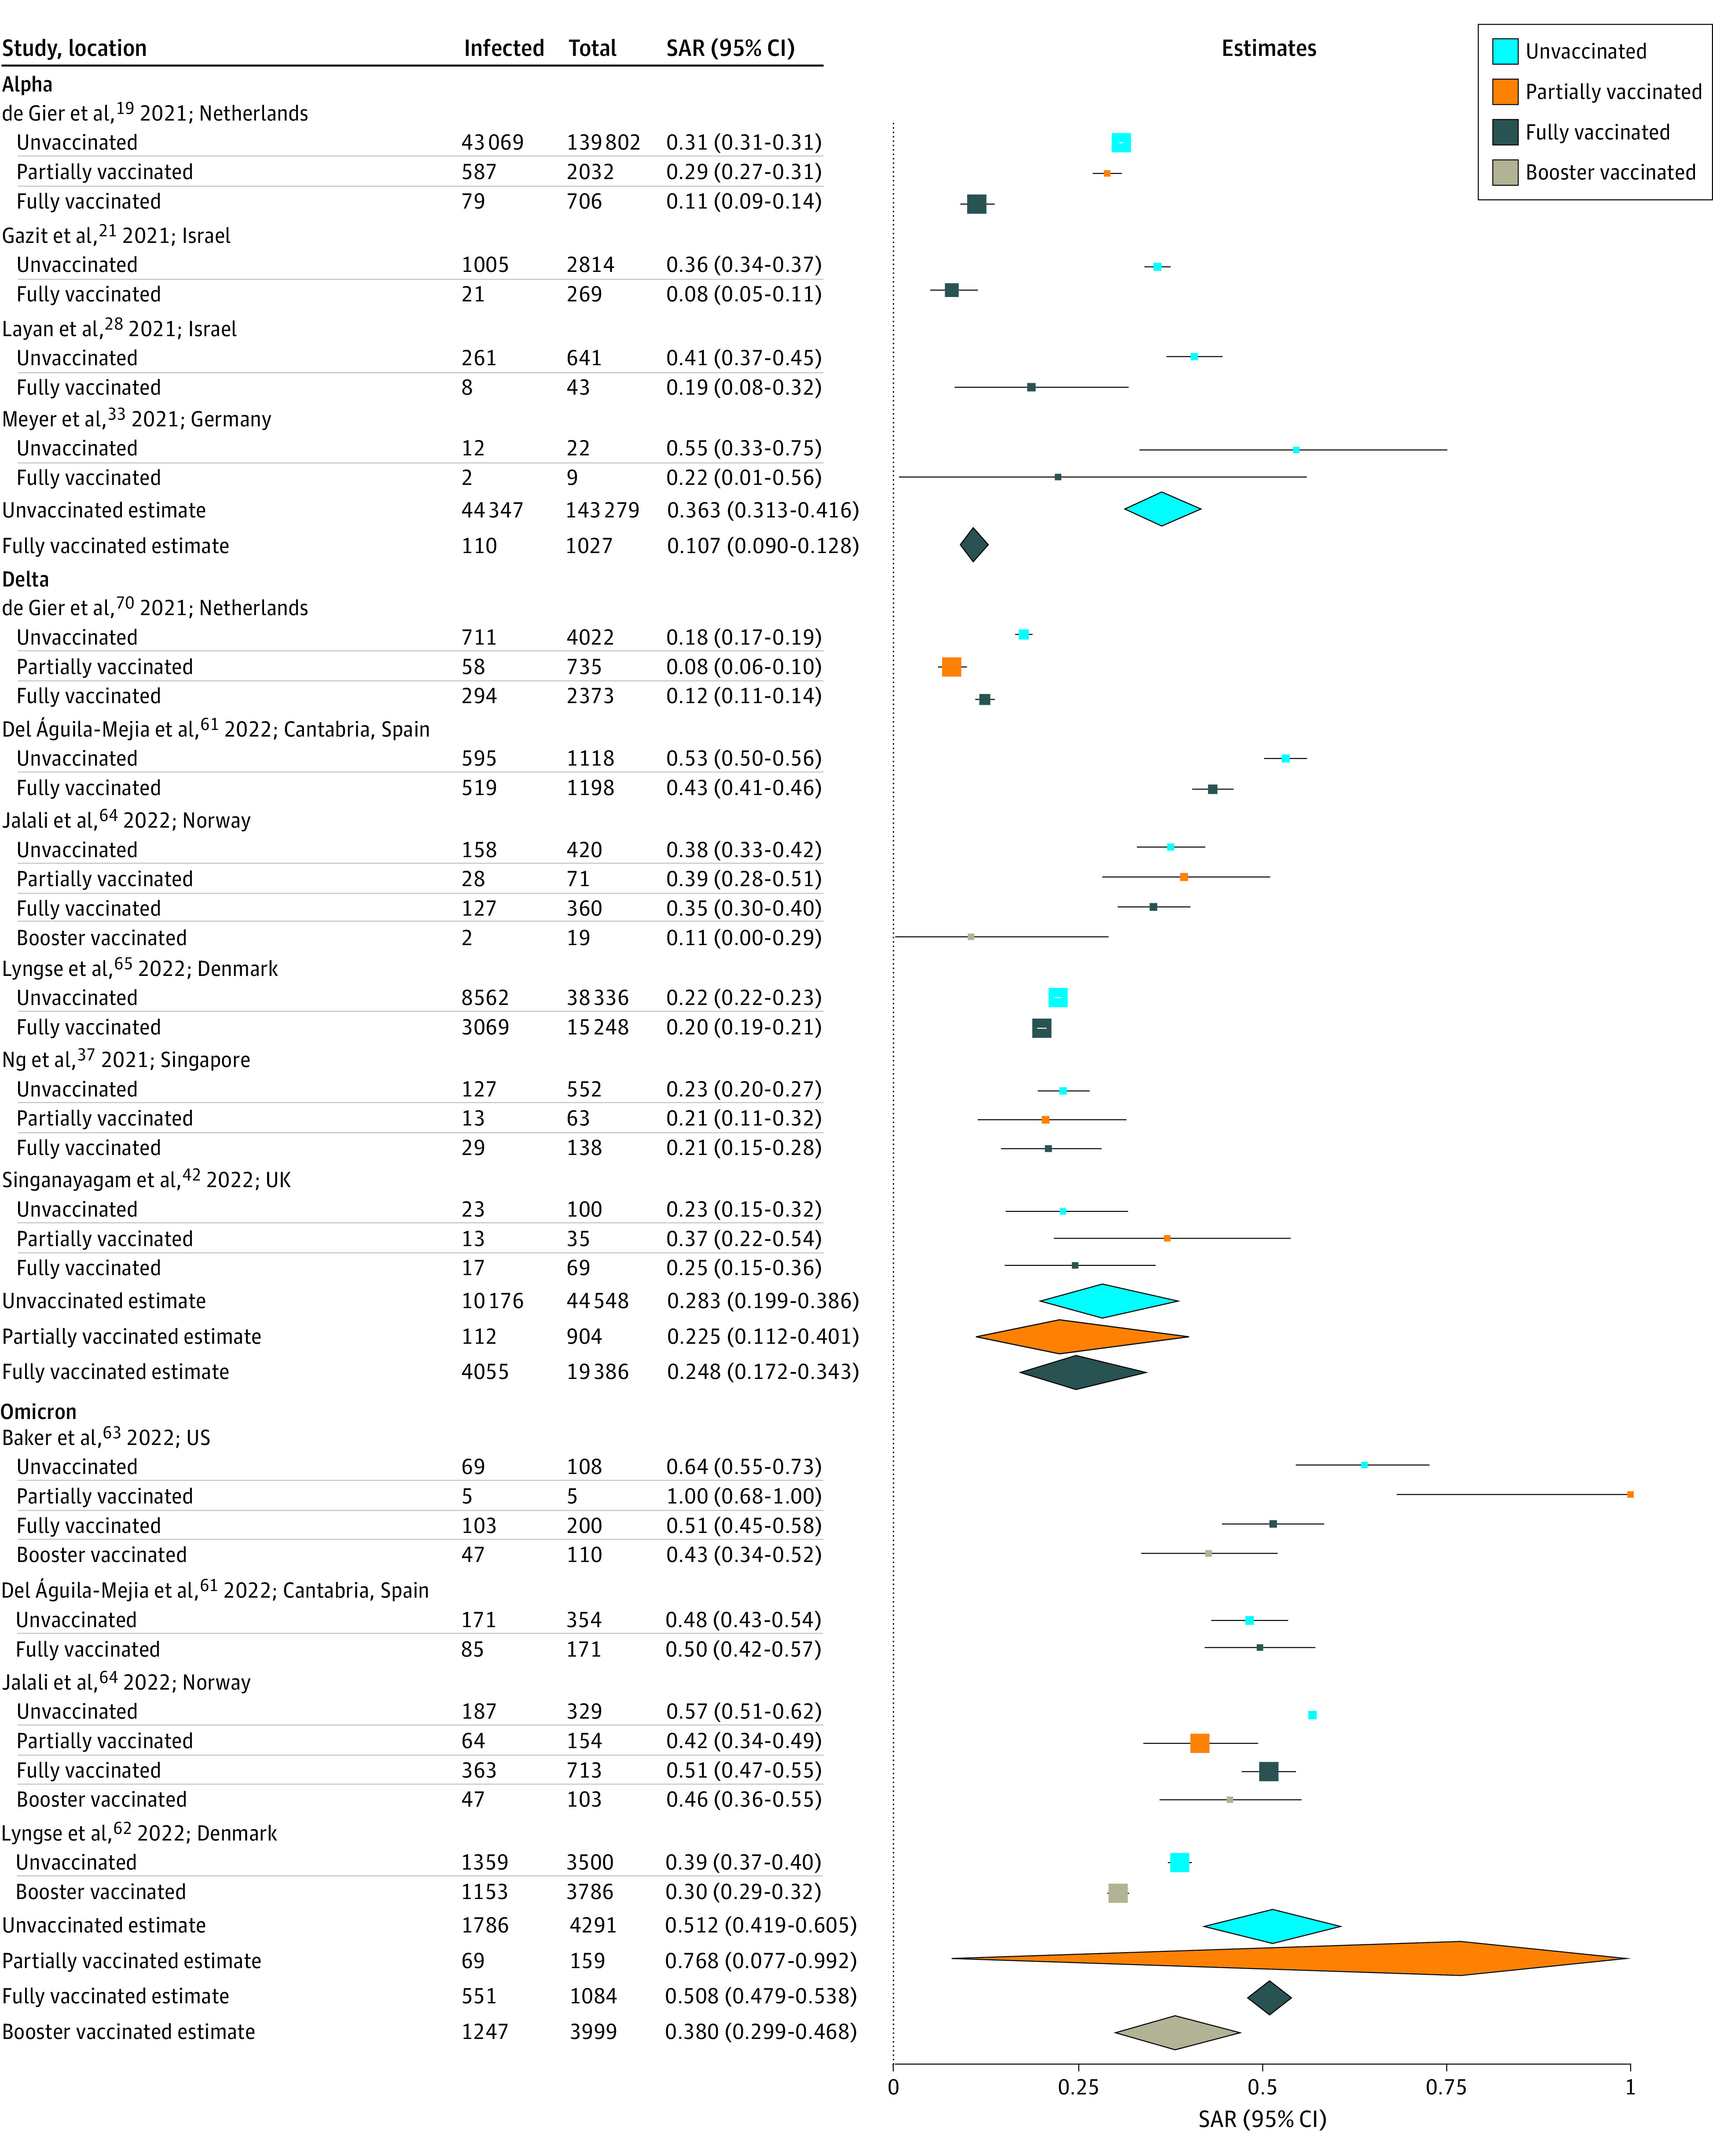
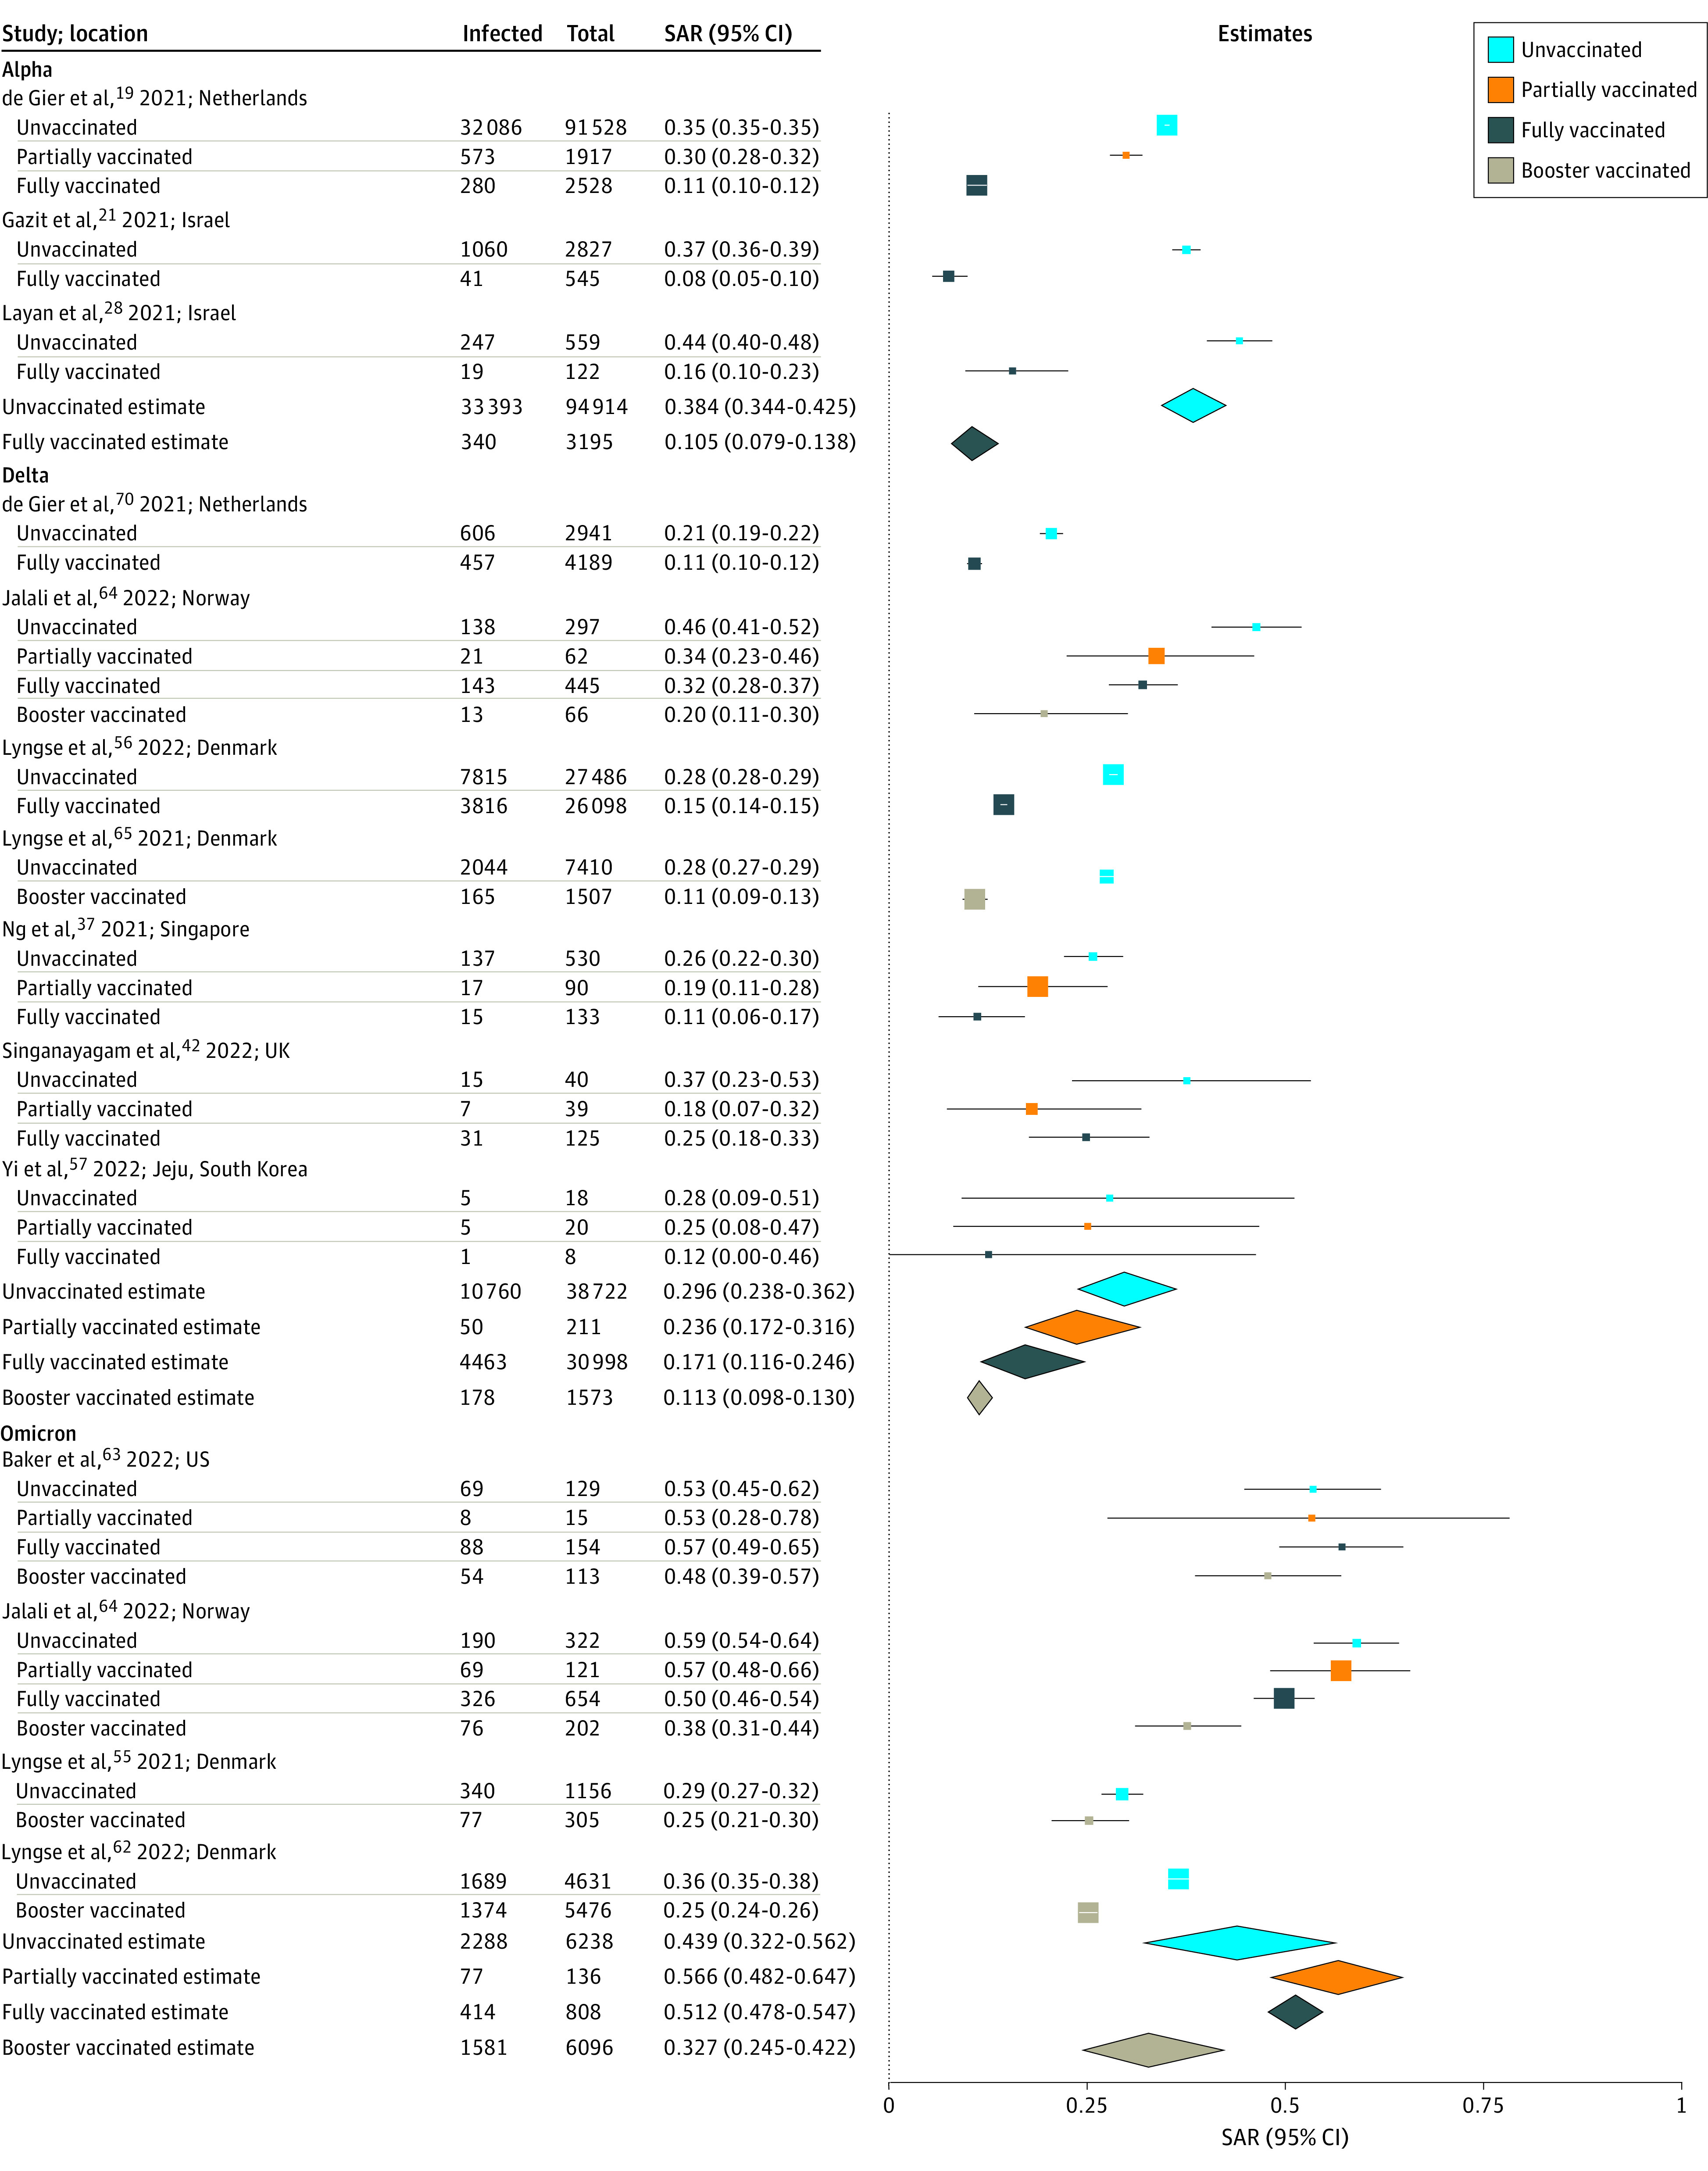
Results: Household SARs were higher for 33 studies with midpoints in 2021 to 2022 (37.3%; 95% CI, 32.7% to 42.1%) compared with 63 studies with midpoints through April 2020 (15.5%; 95% CI, 13.2% to 18.2%). Household SARs were 42.7% (95% CI, 35.4% to 50.4%) for Omicron (7 studies), 36.4% (95% CI, 33.4% to 39.5%) for Alpha (11 studies), 29.7% (95% CI, 23.0% to 37.3%) for Delta (16 studies), and 22.5% (95% CI, 18.6% to 26.8%) for Beta (3 studies). For full vaccination, VES,p was 78.6% (95% CI, 76.0% to 80.9%) for Alpha, 56.4% (95% CI, 54.6% to 58.1%) for Delta, and 18.1% (95% CI, -18.3% to 43.3%) for Omicron; VEI,p was 75.3% (95% CI, 69.9% to 79.8%) for Alpha, 21.9% (95% CI, 11.0% to 31.5%) for Delta, and 18.2% (95% CI, 0.6% to 32.6%) for Omicron; and VET,p was 94.7% (95% CI, 93.3% to 95.8%) for Alpha, 64.4% (95% CI, 58.0% to 69.8%) for Delta, and 35.8% (95% CI, 13.0% to 52.6%) for Omicron.
Conclusions and relevance: These results suggest that emerging SARS-CoV-2 variants of concern have increased transmissibility. Full vaccination was associated with reductions in susceptibility and infectiousness, but more so for Alpha than Delta and Omicron. The changes in estimated vaccine effectiveness underscore the challenges of developing effective vaccines concomitant with viral evolution.
Conflict of interest statement
Figures
Update of
-
Household secondary attack rates of SARS-CoV-2 by variant and vaccination status: an updated systematic review and meta-analysis.medRxiv [Preprint]. 2022 Jan 11:2022.01.09.22268984. doi: 10.1101/2022.01.09.22268984. medRxiv. 2022. Update in: JAMA Netw Open. 2022 Apr 1;5(4):e229317. doi: 10.1001/jamanetworkopen.2022.9317. PMID: 35043125 Free PMC article. Updated. Preprint.
References
-
- Klaassen F, Chitwood MH, Cohen T, et al. . Population immunity to pre-Omicron and Omicron SARS-CoV-2 variants in US states and counties through December 1, 2021. medRxiv. Preprint posted online March 1, 2022.
-
- Halloran ME, Longini IM, Struchiner CJ, Longini IM. Design and Analysis of Vaccine Studies. Vol 18. Springer; 2010. doi:10.1007/978-0-387-68636-3 - DOI
-
- Halloran ME, Préziosi MP, Chu H. Estimating vaccine efficacy from secondary attack rates. J Am Stat Assoc. 2003;98(461):38-46. doi:10.1198/016214503388619076 - DOI
Publication types
MeSH terms
Supplementary concepts
Grants and funding
LinkOut - more resources
Full Text Sources
Medical
Miscellaneous
