. 2022 Jun 1;132(6):1370-1378.
doi: 10.1152/japplphysiol.00652.2021. Epub 2022 Apr 28.

Measuring short-term changes in specific ventilation using dynamic specific ventilation imaging

Affiliations

Measuring short-term changes in specific ventilation using dynamic specific ventilation imaging

Eric T Geier et al. J Appl Physiol (1985). .

Abstract

Specific ventilation imaging (SVI) measures the spatial distribution of specific ventilation (SV) in the lung with MRI by using inhaled oxygen as a contrast agent. Because of the inherently low signal-to-noise ratio in the technique, multiple switches between inspiring air and O2 are utilized, and the high spatial resolution SV distribution is determined as an average over the entire imaging period (∼20 min). We hypothesized that a trade-off between spatial and temporal resolution could allow imaging at a higher temporal resolution, at the cost of a coarser, yet acceptable, spatial resolution. The appropriate window length and spatial resolution compromise were determined by generating synthetic data with signal- and contrast-to-noise characteristics reflective of that in previously published experimental data, with a known and unchanging distribution of SV, and showed that acceptable results could be obtained in an imaging period of ∼7 min (80 breaths), with a spatial resolution of ∼1 cm3. Previously published data were then reanalyzed. The average heterogeneity of the temporally resolved maps of SV was not different from the previous overall analysis, however, the temporally resolved maps were less effective at detecting the amount of bronchoconstriction resulting from methacholine administration. The results further indicated that the initial response to inhaled methacholine and subsequent inhalation of albuterol were largely complete within ∼22 min and ∼9 min, respectively, although there was a tendency for an ongoing developing effect in both cases. These results suggest that it is feasible to use a shortened SVI protocol, with a modest sacrifice in spatial resolution, to measure temporally dynamic processes.NEW & NOTEWORTHY Dynamic imaging providing maps of specific ventilation with a temporal resolution of ∼7 min with a spatial resolution of ∼1 cm3 using MRI was shown to be practical. The technique provides an ionizing radiation free means of temporally following the spatial pattern of specific ventilation. Reanalysis of previously published data showed that the effects of inhaled methacholine and albuterol were largely complete at ∼22 min and ∼9 min, respectively after administration.

Keywords: MRI; heterogeneity; time course; ventilation defects.


Conflict of interest statement

No conflicts of interest, financial or otherwise, are declared by the authors.

Figures

None
Graphical abstract
Figure 1.
Figure 1.
Example of windowed temporal analysis designed to create a specific ventilation imaging (SVI) time course. The top row shows a plot of large voxel intensity vs. breath no. in a 220-breath post-methacholine imaging run. This full image set is broken up into smaller subsets, represented here by numbered, solid horizontal lines. Lines that overlap in time (stacked vertically here) share information and are therefore nonindependent measurements. Closest temporal independent measurements are shown on the same line (e.g., window 1 and window 5). These sliding windows are used to create serial maps of SV (large voxel maps). These large voxel maps are compared with the baseline, whole run reference (bottom left) to determine which areas of the lung constricted. Constricted large voxels for each temporal window are shown in red in the bottom row.
Figure 2.
Figure 2.
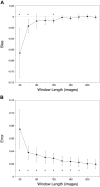
Bias (A) and error (B) plotted as a function of window length, with confidence intervals. In A, *bias values are significantly different than zero (P < 0.05, one-sample t test). In B, *the standard deviation of a particular window length is greater than that for the full, 220-breath acquisition (P < 0.05, two-sample t test). See text for details.
Figure 3.
Figure 3.
Heterogeneity of the specific ventilation (SV) distribution, as represented as the width of a best fit log(Gaussian) to the SV distribution, as a function of time in minutes for the three experimental conditions. Between-subject averages are represented by closed triangles with standard errors shown as error bars. The average of each window across time for all six subjects using the 80-breath window length are shown as the dotted horizontal line within each window. The corresponding average value for the 220-breath window analysis is shown as the horizontal solid line. Significant differences (two-way ANOVA) between windows are indicated by *P < 0.05 compared with baseline, +P < 0.05 compared with post-methacholine.
Figure 4.
Figure 4.
Fraction of the lung constricted as a function of time in minutes for the three experimental conditions. Between-subject averages are represented by closed triangles with standard errors shown as error bars. The average of each window across time for all six subjects using the 80-breath window length are shown as the dotted horizontal line within each window. The corresponding average value for the 220-breath window analysis is shown as the horizontal solid line. Statistical comparison of the results for window length is detailed in Table 1. Significant differences (two-way ANOVA) between windows are indicated by *P < 0.05 compared with baseline, +P < 0.05 compared with post-methacholine.

Similar articles

References

    1. Venegas JG, Winkler T, Musch G, Vidal Melo MF, Layfield D, Tgavalekos N, Fischman AJ, Callahan RJ, Bellani G, Harris RS. Self-organized patchiness in asthma as a prelude to catastrophic shifts. Nature 434: 777–782, 2005. doi:10.1038/nature03490. - DOI - PubMed
    1. Simon BA, Kaczka DW, Bankier AA, Parraga G. What can pulmonary functional imaging tell us about ventilation? J Appl Physiol (1985) 113: 647–657, 2012. doi:10.1152/japplphysiol.00353.2012. - DOI - PMC - PubMed
    1. Harris RS, Winkler T, Tgavalekos N, Musch G, Melo MF, Schroeder T, Chang Y, Venegas JG. Regional pulmonary perfusion, inflation, and ventilation defects in bronchoconstricted patients with asthma. Am J Respir Crit Care Med 174: 245–253, 2006. doi:10.1164/rccm.200510-1634OC. - DOI - PMC - PubMed
    1. Engel LA, Landau L, Taussig L, Martin RR, Sybrecht G. Influence of bronchomotor tone on regional ventilation distribution at residual volume. J Appl Physiol 40: 411–416, 1976. doi:10.1152/jappl.1976.40.3.411. - DOI - PubMed
    1. Darquenne C, van Ertbruggen C, Prisk GK. Convective flow dominates aerosol delivery to the lung segments. J Appl Physiol 111: 48–54, 2011. doi:10.1152/japplphysiol.00796.2010. - DOI - PMC - PubMed

Publication types

LinkOut - more resources