. 2022 Jun 8;7(11):e154743.
doi: 10.1172/jci.insight.154743.

Multiomic analysis of microRNA-mediated regulation reveals a proliferative axis involving miR-10b in fibrolamellar carcinoma

Affiliations

Multiomic analysis of microRNA-mediated regulation reveals a proliferative axis involving miR-10b in fibrolamellar carcinoma

Adam B Francisco et al. JCI Insight. .

Abstract

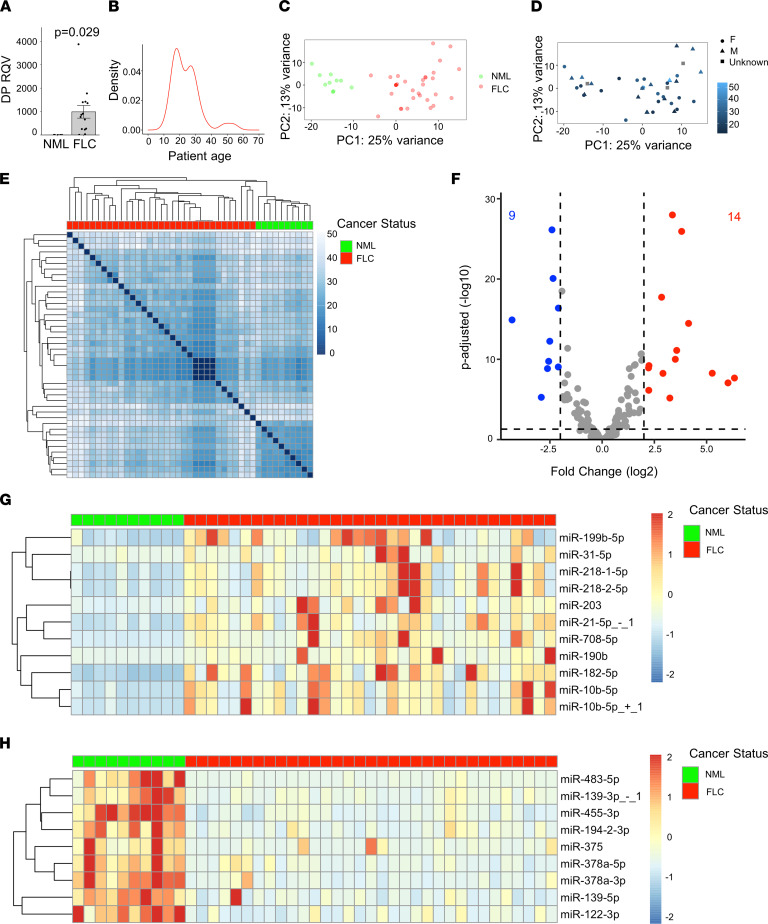
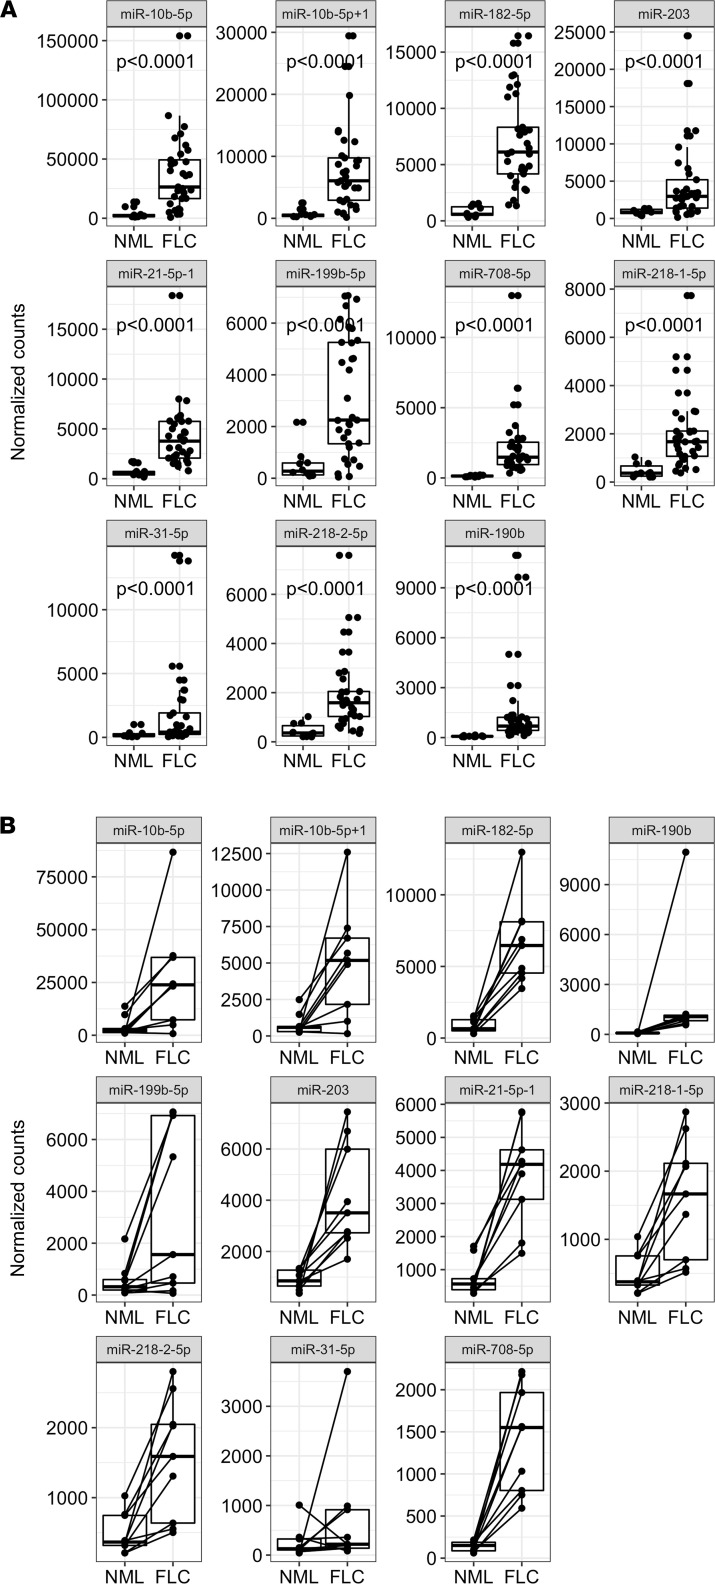
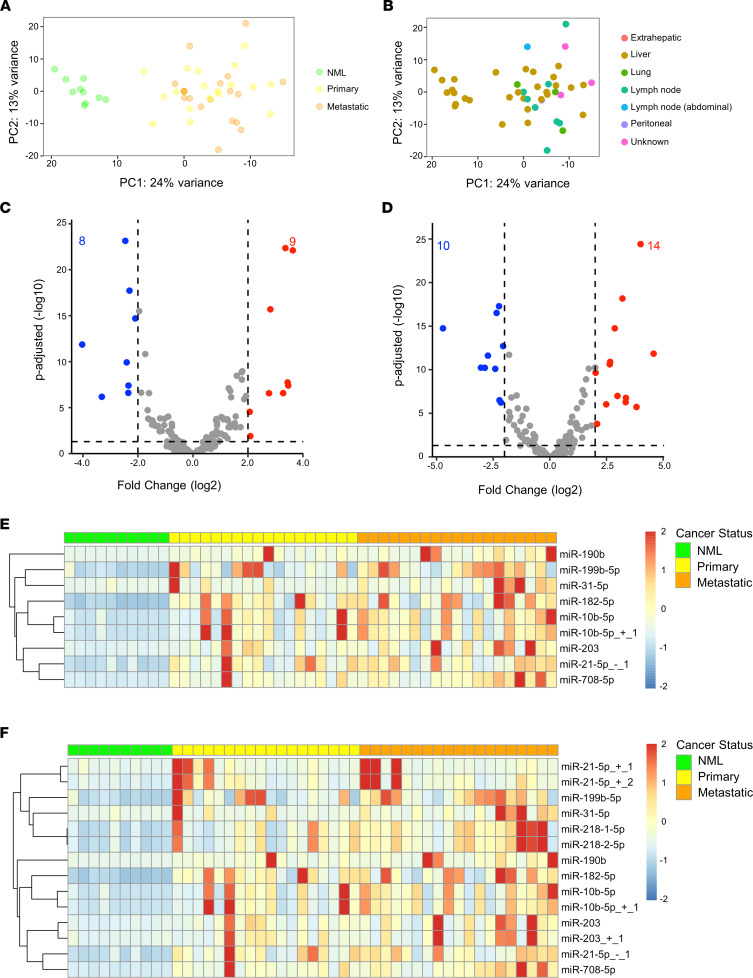
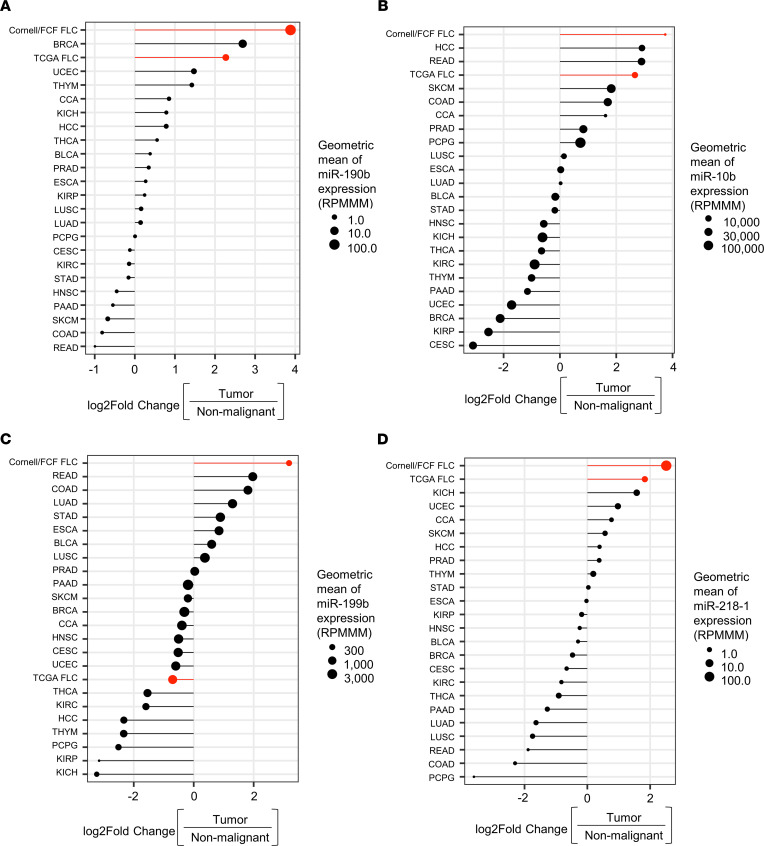
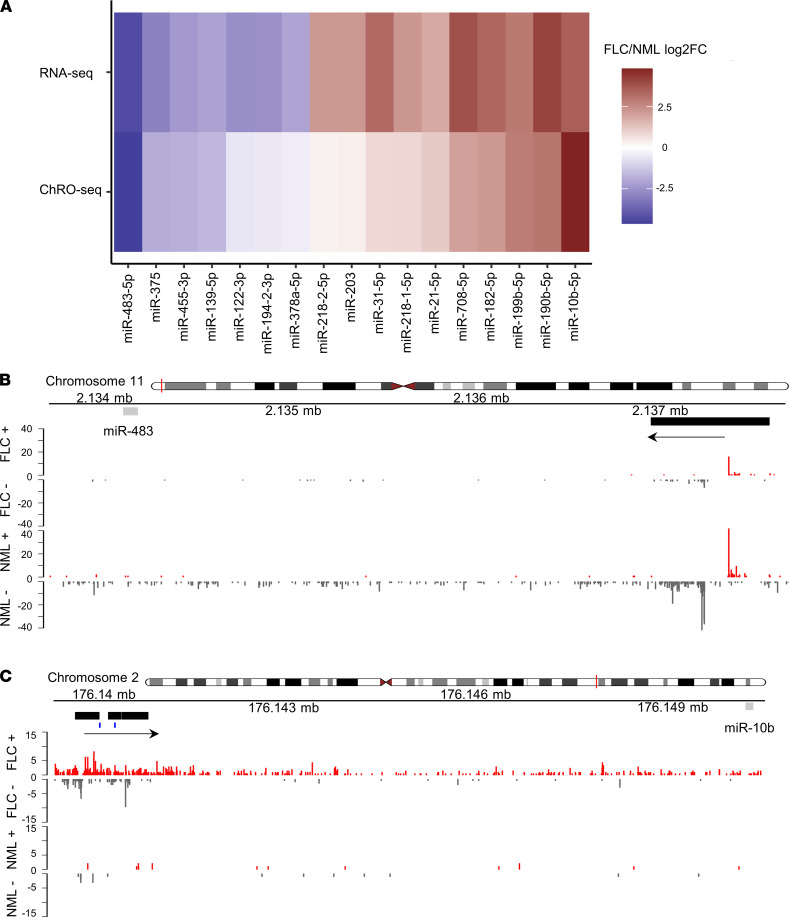
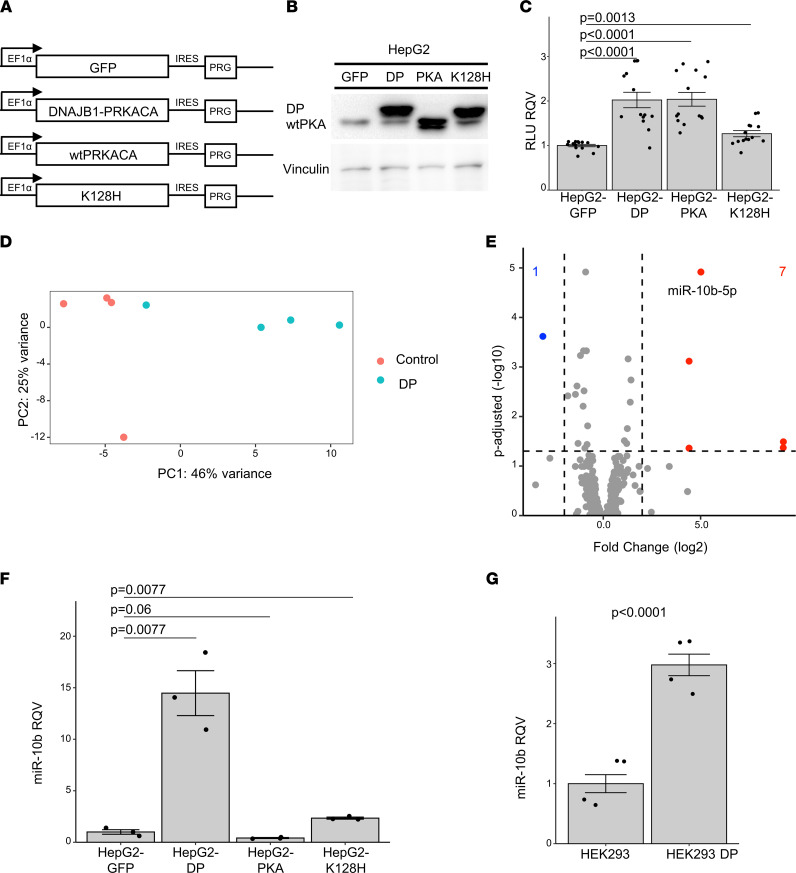
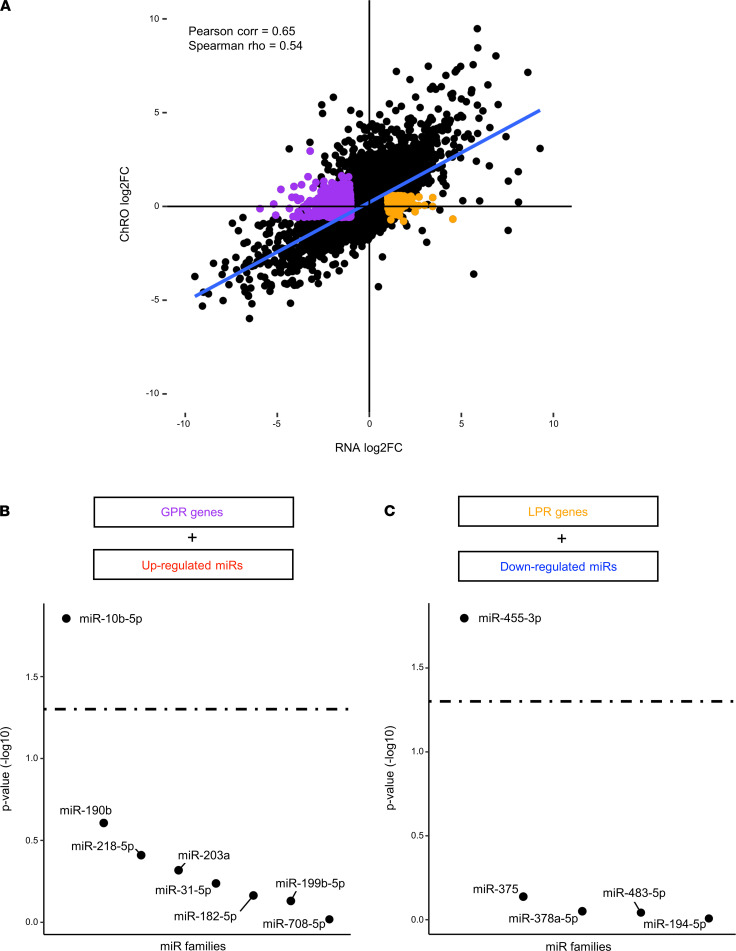
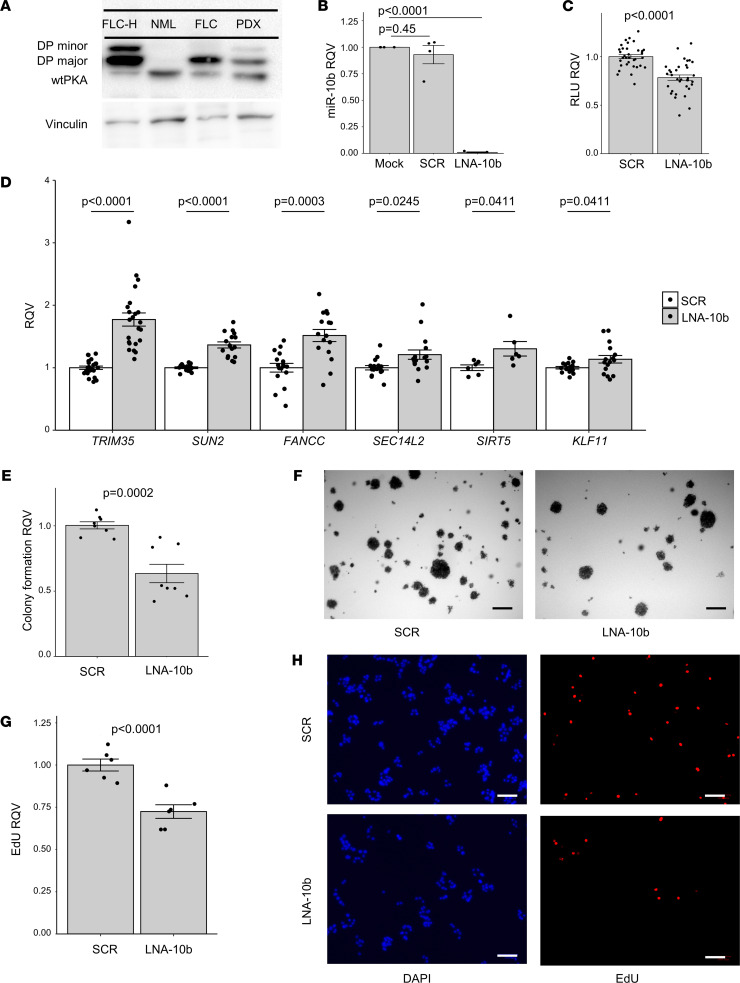
Fibrolamellar carcinoma (FLC) is an aggressive liver cancer primarily afflicting adolescents and young adults. Most patients with FLC harbor a heterozygous deletion on chromosome 19 that leads to the oncogenic gene fusion, DNAJB1-PRKACA. There are currently no effective therapeutics for FLC. To address that, it is critical to gain deeper mechanistic insight into FLC pathogenesis. We assembled a large sample set of FLC and nonmalignant liver tissue (n = 52) and performed integrative multiomic analysis. Specifically, we carried out small RNA sequencing to define altered microRNA expression patterns in tumor samples and then coupled this analysis with RNA sequencing and chromatin run-on sequencing data to identify candidate master microRNA regulators of gene expression in FLC. We also evaluated the relationship between DNAJB1-PRKACA and microRNAs of interest in several human and mouse cell models. Finally, we performed loss-of-function experiments for a specific microRNA in cells established from a patient-derived xenograft (PDX) model. We identified miR-10b-5p as the top candidate pro-proliferative microRNA in FLC. In multiple human cell models, overexpression of DNAJB1-PRKACA led to significant upregulation of miR-10b-5p. Inhibition of miR-10b in PDX-derived cells increased the expression of several potentially novel target genes, concomitant with a significant reduction in metabolic activity, proliferation, and anchorage-independent growth. This study highlights a potentially novel proliferative axis in FLC and provides a rich resource for further investigation of FLC etiology.

Keywords: Liver cancer; Molecular genetics; Oncogenes; Oncology.


Conflict of interest statement

Conflict of interest: The authors have declared that no conflict of interest exists.

Figures

Figure 1
Figure 1. miR-10b is among the most upregulated microRNAs in FLC.
(A) qPCR showing the relative quantitative value (RQV) of DP in a subset of FLC samples (n = 15) compared with NML samples (n = 6). Data points represent individual patient samples. Cycle threshold values can be found in Supplemental Table 1. (B) Patient age distribution across FLC samples used in this study for which age is known (n = 35). (C) Principal component analysis of VST normalized counts for the NML (n = 10) and FLC (n = 33) data sets. The percent of variation explained is indicated for component 1 (x axis) and component 2 (y axis). NML and FLC samples are colored green and red. (D) Principal component analysis plot in which the patient age and sexual phenotype information are overlaid. Female, male, and unreported patients are indicated by circles, triangles, and squares, respectively. The color intensity, from dark to light, indicates increasing patient age at the time of surgery. (E) Unsupervised hierarchical clustering of the Euclidean distances among samples was calculated based on VST normalized counts. FLC and NML samples are indicted by red and green boxes. (F) Volcano plot showing microRNAs that are significantly differentially expressed (average normalized counts > 1000 in either NML or FLC, coefficient of variance < 2 across FLC samples). Dashed lines represent the log2 FC of expression –2/+2 (vertical) and adjusted P = 0.05 (horizontal). Up- or downregulated microRNAs are colored red or blue, respectively. (G and H) Heatmaps showing the normalized expression of up- or downregulated microRNAs (in rows) in each patient sample (in columns). Expression is scaled by row with a max/min of +2/–2 shown. P values are calculated by 2-tailed Student’s t test.
Figure 2
Figure 2. Expression levels of the significantly upregulated microRNAs in all FLC patient samples.
(A) The normalized expression of each upregulated microRNA is shown as individual box plots for NML and FLC. Samples are plotted as individual points. (B) Expression of upregulated microRNAs among FLC patients with matched NML samples (n = 9). The matched NML/FLC samples are indicated with a line linking the 2 data points. Each data point represents a patient sample. P values are calculated by 2-tailed Student’s t test.
Figure 3
Figure 3. miR-10b is among the most upregulated microRNAs in both primary and metastatic FLC.
(A) Principal component analysis of VST normalized counts with tumor type information overlaid. NML (n = 10), primary (n = 18), and metastatic (n = 19) samples are shown in green, yellow, and orange, respectively. (B) Principal component analysis of VST normalized counts with metastatic location information overlaid. Extrahepatic, liver, lung, lymph node, peritoneal, and unknown locations are shown red, brown, green, teal, blue, and purple, respectively. (C) Volcano plot showing microRNAs that are significantly differentially expressed in primary FLC versus NML (average normalized counts > 1000 in either NML or primary FLC). Dashed lines represent the log2 FC of expression –2/+2 (vertical) and adjusted P = 0.05 (horizontal). Up- or downregulated microRNAs are colored red or blue, respectively. (D) Volcano plot showing microRNAs that are significantly differentially expressed in metastatic FLC versus NML; analysis criteria identical to C. Dashed lines represent the log2 FC of expression –2/+2 (vertical) and adjusted P = 0.05 (horizontal). Up- or downregulated microRNAs are colored red or blue, respectively. (E). Heatmap showing the expression of microRNAs upregulated in primary FLC versus NML. MicroRNAs are listed in rows and individual patients are listed in columns. Expression is scaled by row with a max/min of +2/–2 shown. (F) Heatmap showing the expression of upregulated microRNAs in metastatic FLC versus NML; sample arrangement is identical to E. Expression is scaled by row with a max/min of +2/–2 shown.
Figure 4
Figure 4. FLC microRNA expression compared with other cancer types.
(AD) Log2 FC expression of the 4 most upregulated microRNAs in FLC (after removing isomiRs) within TCGA. The size of each circle represents the geometric mean of microRNA expression in each tumor type. Each tumor type is ranked on the y axis by the log2 FC of the geometric mean of tumor expression relative to nontumor expression. The FLC sample set used in this study (Cornell/FCF) and the FLC sample set available from TCGA (n = 6) are highlighted in red. BLCA, bladder urothelial carcinoma; BRCA, breast invasive carcinoma; CESC, cervical squamous cell and endocervical adenocarcinoma; CCA, cholangiocarcinoma; COAD, colon adenocarcinoma; Cornell/FCF FCL, fibrolamellar carcinoma samples analyzed in this study; ESCA, esophageal carcinoma; HCC, hepatocellular carcinoma; HNSC, head and neck squamous cell carcinoma; KICH, kidney chromophobe; KIRC, kidney renal papillary cell carcinoma; KIRP, kidney renal clear cell carcinoma; LUAD, lung adenocarcinoma; LUSC, lung squamous cell carcinoma, PAAD, pancreatic adenocarcinoma; PCPG, pheochromocytoma and paraganglioma; PRAD, prostate adenocarcinoma; READ, rectum adenocarcinoma; SKCM, skin cutaneous melanoma; STAD, stomach adenocarcinoma; TCGA FLC; fibrolamellar carcinoma; THCA, thyroid carcinoma; THYM, thymoma; UCEC, uterine corpus endometrial carcinoma; RPMMM, reads per million mapped to microRNAs.
Figure 5
Figure 5. miR-10b is the most transcriptionally activated microRNA in FLC.
(A) Gene expression (RNA-Seq signal, n = 19, top row) or transcriptional activity (ChRO-Seq signal, n = 13, bottom row) for the 17 significantly differentially expressed microRNAs (after removing isomiRs) is shown as the log2 FC in FLC versus NML. (B) miR–483-5p and (C) miR–10b-5p genome browser tracks showing normalized ChRO-Seq signal. The upper and lower panel show the activity in FLC and NML. Activity on the plus and minus strand are shown in red and gray, respectively. The mature microRNA sequence is shown as a gray rectangle, the promoter region of the miRNA is shown as a black rectangle, and the direction of transcription is identified by an arrow. Predicted FOXQ1 bindings sites in the miR-10b promoter are identified by blue dashes.
Figure 6
Figure 6. DP activity promotes the expression of miR-10b in human but not mouse models.
(A) Diagram of expression cassettes for lentiviral constructs. EF1α; human EF1α gene promoter; GFP, green fluorescent protein; DNAJB1-PRCACA, FLC fusion oncogene; WT PRKACA, protein kinase A catalytic α subunit; DNAJB1-PRCACA K128H, FLC fusion oncogene containing a lysine-to-histidine substitution at amino acid position 128; IRES, internal ribosome entry site; PRG, puromycin resistance gene. (B) Protein expression in HepG2 cell lines detected with a protein kinase A catalytic α subunit (PKA) antibody. WT PKAc and DP are identified. Lane 1, HepG2-GFP; lane 2, HepG2-DP; lane 3, HepG2-PKA; lane 4, HepG2-K128H. Vinculin expression for loading control is shown in the lower panel. Uncropped immunoblot is shown in Supplemental Figure 4, A and B. (C) Luciferase relative light units (RLU), proportional to viable cells, is shown relative to the HepG2-GFP cell line (2 trials, n = 14 each condition). (D) Principal component analysis of the log-transformed normalized counts from small RNA-Seq of HepG2-DP (DP, n = 3) and HepG2-GFP (control, n = 3) samples, in blue and red, respectively. (E) Volcano plot showing the differentially expressed microRNAs in HepG2-DP relative to HepG2-GFP (only microRNAs with average HepG2-DP or HepG2-GFP expression > 100 shown). Dashed lines represent the log2 (fold change) of expression –2/+2 (vertical) and adjusted P = 0.05 (horizontal). Up- or downregulated microRNAs are colored red or blue, respectively. (F) qPCR showing the relative quantitative value (RQV) for miR-10b expression in HepG2-GFP, HepG2-DP, HepG2-PKA, and HepG2-K128H cell lines (n = 3 each). (G) qPCR for showing the RQV for miR-10b expression in HEK293 and HEK293-DP cell lines (n = 4 each). In all assays, each dot represents the average signal of a biological replicate. P values are calculated by 2-tailed Student’s t test. P values reported in C and F were adjusted for multiple testing correction post hoc by the Benjamini-Hochberg method.
Figure 7
Figure 7. miR-10b and miR-455 are master regulators of gene expression in FLC.
(A) Scatterplot showing the log2 FC of RNA-Seq normalized reads on the x axis and the log2 FC of ChRO-Seq normalized reads on the y axis for genes in FLC relative to NML. Those genes subject primarily to gain of PTR (normalized reads > 1000, RNA-Seq log2 FC < 1, RNA-Seq Padj < 0.05, ChRO-Seq log2FC < ±0.59, ChRO-Seq Padj > 0.2) are highlighted in purple, and genes subject primarily to loss of PTR (normalized reads > 1000, RNA-Seq log2 FC > 1, RNA-Seq Padj < 0.05, ChRO-Seq log2FC < ±0.59, ChRO-Seq Padj > 0.2) are highlighted in orange. (B) Ranked –log10 (P value) of miRhub simulation results. Gain of PTR genes were examined for enrichment of binding sites for microRNAs upregulated in FLC (only those microRNAs with predictions in TargetScan included). The dashed line represents P = 0.05. (C) Ranked –log10 (P value) of miRhub simulation results. Loss of PTR genes was examined for enrichment of binding sites for microRNAs downregulated in FLC (only those microRNAs with predictions in TargetScan included). The dashed line represents P = 0.05.
Figure 8
Figure 8. miR-10b inhibition reduces FLC cell metabolic activity and proliferation.
(A) Protein expression of DNAJB1-PRKACA (DP) is detected with a protein kinase A catalytic α subunit (PKA) antibody. WT PKAc, DP major, and DP minor are identified. Lane 1, FLC-H cell line; lane 2, nonmalignant liver; lane 3, FLC patient sample; lane 4, FLC PDX sample. Vinculin expression for loading control is shown in the lower panel. Uncropped immunoblot shown in Supplemental Figure 4, A and B. (B) qPCR showing the RQV of miR-10b in FLC-H cells 6 days after 500 nM treatment with miR-10b LNA or scrambled sequence compared with mock (n = 4 each condition). (C) Luciferase signal (RLU) in FLC-H cells after 6 days of 500 nM miR-10b LNA treatment is shown as RQV compared with the scrambled negative control (6 trials, n = 6 each condition). (D) qPCR showing the RQV of FANCC, KLF11, SEC14L2, SIRT5, SUN2, and TRIM35 in FLC-H cells after 6 days of 500 nM miR-10b LNA treatment compared with the negative control (n = 5–7 trials with 3 replicates for each condition, SIRT5 n = 2 trials). (E) Soft agar colony formation of FLC-H cells 35 days after 500 nM miR-10b LNA compared with the negative control shown as RQV. (F) Representative nitro blue tetrazolium–stained images shown (2 trials, n = 8 each condition). (G) EdU incorporation in FLC-H cells 6 days after 500 nM treatment with miR-10b LNA compared with the negative control shown as RQV (2 trials, n = 6 each condition). (H) Representative DAPI- and EdU-stained images show total and proliferative cells, respectively. Scale bars: 100 μm. In all assays, each dot represents the average signal across technical replicates for a single biological replicate. P values are calculated by 2-tailed Student’s t test. P values reported in B and D were adjusted for multiple testing correction post hoc by the Benjamini-Hochberg method.

References

    1. Graham RP, Torbenson MS. Fibrolamellar carcinoma: a histologically unique tumor with unique molecular findings. Semin Diagn Pathol. 2017;34(2):146–152. doi: 10.1053/j.semdp.2016.12.010. - DOI - PubMed
    1. Graham RP, et al. Molecular testing for the clinical diagnosis of fibrolamellar carcinoma. Mod Pathol. 2018;31(1):141–149. doi: 10.1038/modpathol.2017.103. - DOI - PMC - PubMed
    1. Graham RP, et al. Environmental exposures as a risk factor for fibrolamellar carcinoma. Mod Pathol. 2017;30(6):892–896. doi: 10.1038/modpathol.2017.7. - DOI - PubMed
    1. Kassahun WT. Contemporary management of fibrolamellar hepatocellular carcinoma: diagnosis, treatment, outcome, prognostic factors, and recent developments. World J Surg Oncol. 2016;14(1):151. doi: 10.1186/s12957-016-0903-8. - DOI - PMC - PubMed
    1. Mayo SC, et al. Treatment and prognosis of patients with fibrolamellar hepatocellular carcinoma: a national perspective. J Am Coll Surg. 2014;218(2):196–205. doi: 10.1016/j.jamcollsurg.2013.10.011. - DOI - PMC - PubMed

Publication types

Supplementary concepts