. 2022 Jun 15;132(12):e156876.
doi: 10.1172/JCI156876.

Siglec-F-expressing neutrophils are essential for creating a profibrotic microenvironment in renal fibrosis

Affiliations

Siglec-F-expressing neutrophils are essential for creating a profibrotic microenvironment in renal fibrosis

Seungwon Ryu et al. J Clin Invest. .

Abstract

The roles of neutrophils in renal inflammation are currently unclear. On examining these cells in the unilateral ureteral obstruction murine model of chronic kidney disease, we found that the injured kidney bore a large and rapidly expanding population of neutrophils that expressed the eosinophil marker Siglec-F. We first verified that these cells were neutrophils. Siglec-F+ neutrophils were recently detected in several studies in other disease contexts. We then showed that a) these cells were derived from conventional neutrophils in the renal vasculature by TGF-β1 and GM-CSF; b) they differed from their parent cells by more frequent hypersegmentation, higher expression of profibrotic inflammatory cytokines, and notably, expression of collagen 1; and c) their depletion reduced collagen deposition and disease progression, but adoptive transfer increased renal fibrosis. These findings have thus unveiled a subtype of neutrophils that participate in renal fibrosis and a potentially new therapeutic target in chronic kidney disease.

Keywords: Chronic kidney disease; Fibrosis; Immunology; Nephrology; Neutrophils.


Figures
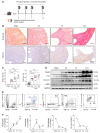
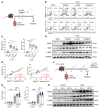
Figure 1
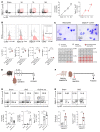
Figure 1. Neutrophils become the most prevalent immune cells in the kidney after fibrosis is induced.
(A) C57BL/6 mice underwent UUO surgery, after which the fibrosis and immune cell profiles in the kidneys were evaluated on postoperative days 0, 3, 7, and 14. (B) Images of Sirius red– and COL1A1-stained kidneys; scale bar: 400 μm. (C) Quantification of Sirius red and COL1A1 staining as measures of fibrosis. (D) Western blot analysis of the expression of renal injury (NGAL and P16) and fibrosis (α-SMA and COL1A1) markers after UUO. (E) Gating strategy used to identify the renal myeloid cells. (F) Changes in myeloid cell frequencies during UUO-induced renal fibrosis as determined by flow cytometry. Data are from (C) or representative (F) of 3 independent experiments. All results are shown as mean ± SEM, and statistical analysis was performed using 1-way ANOVA. *P < 0.05; **P < 0.01; ***P < 0.001; ****P < 0.0001; n = 5–7 mice in each group.
Figure 2
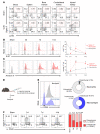
Figure 2. Siglec-F–expressing neutrophils accumulate as fibrosis progresses.
(A) Flow cytometric analysis of the Siglec-F and Ly-6G expression on CD11b+ leukocytes in UUO kidneys. Left, conventional neutrophils (Siglec-FLy-6G+). Right, Siglec-F+Ly-6G+ cells. (B) Flow cytometric analysis of the expression of neutrophil (Ly-6G and Siglec-E) and eosinophil (Siglec-F and CCR3) markers on the conventional eosinophils (Siglec-F+Ly-6G), the conventional neutrophils (Siglec-FLy-6G+), and the Siglec-F+Ly-6G+ cells in the UUO kidney on day 14. (C) Evaluation of the morphology of the conventional neutrophils and the Siglec-F+Ly-6G+ cells on day 14 by sorting and staining them with Diff-Quik and counting the numbers of primitive, mature, and hypersegmented neutrophils; scale bar: 20 μm. (D and E) Mice were treated with the recombinant IL-33 (250 ng) for 4 consecutive days starting on the day of UUO surgery (D), and the frequencies of conventional neutrophils, eosinophils, and Siglec-F+Ly-6G+ cells on day 14 were determined by flow cytometry (E). (F and G) Eosinophil-deficient ΔdblGATA mice (BALB/c background) were subjected to UUO (F), and the conventional neutrophil and Siglec-F+Ly-6G+ cell frequencies in the kidney on day 14 were determined by flow cytometry (G). All results are shown as mean ± SEM, and statistical analysis was performed using 1-way ANOVA (A, B, and E) or Mann-Whitney U test (G). *P < 0.05; **P < 0.01; ***P < 0.001; ****P < 0.0001; n = 4–5 mice in each group.
Figure 3
Figure 3. UUO-induced Siglec-F+ neutrophils arise only in the injured kidney and are derived from conventional neutrophils in the renal vasculature.
(A) Flow cytometric analysis of the frequencies of Siglec-F+ neutrophils in other organs (blood, spleen, bone marrow, and the contralateral kidney) as well as the injured kidney in UUO-treated mice on day 7. (B and C) Kinetic changes of the Siglec-F+ and conventional neutrophil frequencies in terms of cell proliferation (Ki-67 staining) (B) and cell death (annexin V staining) (C). (DF) Sham- and UUO-treated mice were i.v. injected with a BV650-labeled CD45 mAb 5 minutes before they were euthanized (D). As a control to confirm that the mAb labeled the leukocytes in the kidney vasculature but not in the kidney parenchyma, naive mice were injected with the BV650-CD45 mAb and the neutrophils and macrophages in the kidneys were subjected to flow cytometry (E). The BV650-CD45–labeled (intravascular) and BV650-CD45–unlabeled (parenchymal) Siglec-F+ neutrophil frequencies in the UUO-damaged kidney over time were determined by flow cytometric analysis (F). All results are shown as mean ± SEM, and statistical analysis was performed using Mann-Whitney U test (B and C). *P < 0.05; **P < 0.01; ***P < 0.001; n = 4–5 mice in each group. n.d., not detected.
Figure 4
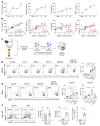
Figure 4. TGF-β1 and GM-CSF convert conventional neutrophils into Siglec-F–expressing neutrophils.
(A) Multiplex cytokine bead array analysis of the levels of inflammatory cytokines in the kidney after UUO induction. (B) Pearson correlation analysis between the frequency of Siglec-F+ neutrophils and the upregulated cytokines shown in A. (CE) Depiction of the experiment (C) where neutrophils were harvested from mouse bone marrow (D) or human blood (E); incubated overnight with 10 ng/mL of TGF-β1, GM-CSF, IL-23, and/or MCP-1; and then subjected to flow cytometric analysis of their Siglec-F (D) or Siglec-8 (E) expression. (F) Flow cytometric analysis of Siglec-F+ neutrophils in the kidney of Rag1–/– mice 14 days after UUO induction. All results are shown as mean ± SEM, and statistical analysis was performed using 1-way ANOVA (B, D, and E) or Student’s t test (F). *P < 0.05; **P < 0.01; ***P < 0.001; ****P < 0.0001; n = 4–5 mice in each group.
Figure 5
Figure 5. Siglec-F+ neutrophils produce more profibrotic cytokines than conventional neutrophils and are also collagen-producing cells.
(A and B) Flow cytometric comparison of conventional neutrophils and Siglec-F+ neutrophils in the UUO-injured kidney at day 7 (n = 10 in each group) in terms of their surface (A) and intracellular (B) levels of inflammatory and homeostatic markers. The box plots depict the minimum and maximum values (whiskers), the upper and lower quartiles, and the median. The length of the box represents the interquartile range. (C and D) Depiction of the experiment (n = 6 in each group) where bone marrow–derived neutrophils were induced to convert into Siglec-F+ neutrophils by priming with TGF-β1 or GM-CSF, after which they were cocultured with NIH 3T3 fibroblasts (C). After the neutrophils were washed out, the fibroblasts were subjected to Western blot analysis for COL1A1 and α-SMA, which are fibroblast activation and differentiation markers (D). (E) Flow cytometric analysis of the intracellular levels of COL1A1 in the CD45+ immune cells and CD45 non-immune cells from sham- and UUO-treated kidneys at day 7. (F and G) Sorted conventional and Siglec-F+ neutrophils from UUO-treated kidneys at day 14 (n = 6 in each group) were subjected to immunofluorescence (F) and RT-qPCR (G) analysis of COL1A1 protein expression. Scale bar: 5 μm. All results are shown as mean ± SEM, and statistical analysis was performed using Student’s t test (A, B, and G) or 1-way ANOVA (D). *P < 0.05; **P < 0.01; ****P < 0.0001.
Figure 6
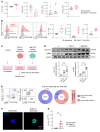
Figure 6. Siglec-F+ neutrophils promote immunopathology during UUO-induced renal injury.
(A) UUO mice were treated on days 2 and 4 with isotype control, anti–Ly-6G, or anti–Siglec-F mAbs. (B) The anti–Ly-6G and anti–Siglec-F mAbs effectively depleted the Siglec-F+ neutrophils in the kidney; the anti–Ly-6G antibodies also depleted the conventional neutrophils in the kidney. (C, D, G, and H) The effect of Siglec-F+ neutrophil depletion (C and D) or transfer (G and H) on the degree of renal injury was determined on day 7 (depletion) or day 14 (transfer) by Sirus red histology and COL1A1 IHC and Western blotting of kidney damage– and fibrosis-related markers. (E) Pearson correlation analysis between Siglec-F+ neutrophil frequencies and the percentage of Sirius red staining and COL1A1 staining in the UUO-damaged kidneys. (F) Siglec-F+ neutrophils were adoptively transferred into the control or UUO mice on days 3 or 10 from the injury. All results are shown as mean ± SEM, and statistical analysis was performed using 1-way ANOVA. *P < 0.05; **P < 0.01; ***P < 0.001; ****P < 0.0001; n = 6–7 mice in each group for AD, n = 7–16 mice in each group for FH.
Figure 7
Figure 7. Siglec-F+ neutrophils are generated in other mouse fibrosis models and in human kidneys with fibrotic changes.
(AD) Adriamycin-induced nephropathy (A and B) (n = 11–13 mice in each group) and renal ischemia/reperfusion injury (IRI) (C and D) (n = 8 mice in each group) were induced and evaluated on day 7 and at 4 or 8 weeks, respectively. The changes in eosinophil, neutrophil, and Siglec-F+ neutrophil frequencies were determined by flow cytometry (B and D). (E and F) A public gene expression data set of patients with CKD was used to determine whether diabetic nephropathy (DN) (n = 9) and focal segmental glomerulosclerosis (FSGS) (n = 19) were associated with increased renal frequencies of neutrophils (as indicated by the FCGRIIIB gene) and Siglec-8+ neutrophils (as indicated by the SIGLEC8 gene) compared with the healthy control (HC) group (n = 10) (E). Pearson correlation analysis between FCGRIIIB and SIGLEC8 expression and renal function (log2 GFR) in patients with DN (n = 16) was also assessed (F). (G) Nephrectomy specimens from 7 patients with clear cell renal cell carcinoma were subjected to flow cytometry to determine the frequencies of Siglec-8+ neutrophils (CD11b+CD15+CD16+ and SSChi) in the healthy and tumor counterparts of each specimen. All results are shown as mean ± SEM, and statistical analysis was performed using Student’s t test (A and E), 1-way ANOVA (B), or Wilcoxon rank-sum test (G). *P < 0.05; **P < 0.01; ***P < 0.001; ****P < 0.0001.

References

    1. Chen TK, et al. Chronic kidney disease diagnosis and management: a review. JAMA. 2019;322(13):1294–1304. doi: 10.1001/jama.2019.14745. - DOI - PMC - PubMed
    1. Romagnani P, et al. Chronic kidney disease. Nat Rev Dis Primers. 2017;3:17088. doi: 10.1038/nrdp.2017.88. - DOI - PubMed
    1. Ruiz-Ortega M, et al. Targeting the progression of chronic kidney disease. Nat Rev Nephrol. 2020;16(5):269–288. doi: 10.1038/s41581-019-0248-y. - DOI - PubMed
    1. Levin A, Stevens PE. Summary of KDIGO 2012 CKD Guideline: behind the scenes, need for guidance, and a framework for moving forward. Kidney Int. 2014;85(1):49–61. doi: 10.1038/ki.2013.444. - DOI - PubMed
    1. Humphreys BD. Mechanisms of renal fibrosis. Annu Rev Physiol. 2018;80:309–326. doi: 10.1146/annurev-physiol-022516-034227. - DOI - PubMed

Publication types

MeSH terms

Substances