

doi: 10.1182/bloodadvances.2021005894.
ALLSorts: an RNA-Seq subtype classifier for B-cell acute lymphoblastic leukemia
Affiliations
- PMID: 35482550
- PMCID: PMC9327546
- DOI: 10.1182/bloodadvances.2021005894
Item in Clipboard
ALLSorts: an RNA-Seq subtype classifier for B-cell acute lymphoblastic leukemia
Blood Adv.
.
No abstract available
Figures
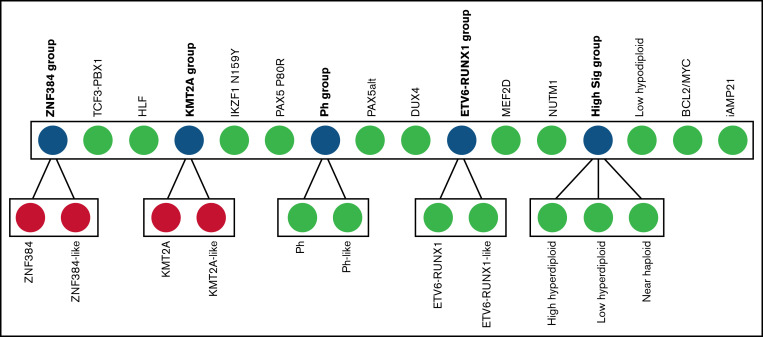
Overview of the ALLSorts classification architecture. In blue are the meta-subtypes that represent classes that have convergent or overlapping signals contained in their nested subtypes. Green nodes are terminal subtypes. Red nodes exist in the hierarchy, but classification currently terminates at the parent node because of a lack of training samples. CRLF2(non–Ph-like) is not included in this classification as its identification is better suited to alternate analysis. IGH-IL3 is also not included given only a single case was identified across all cohorts.
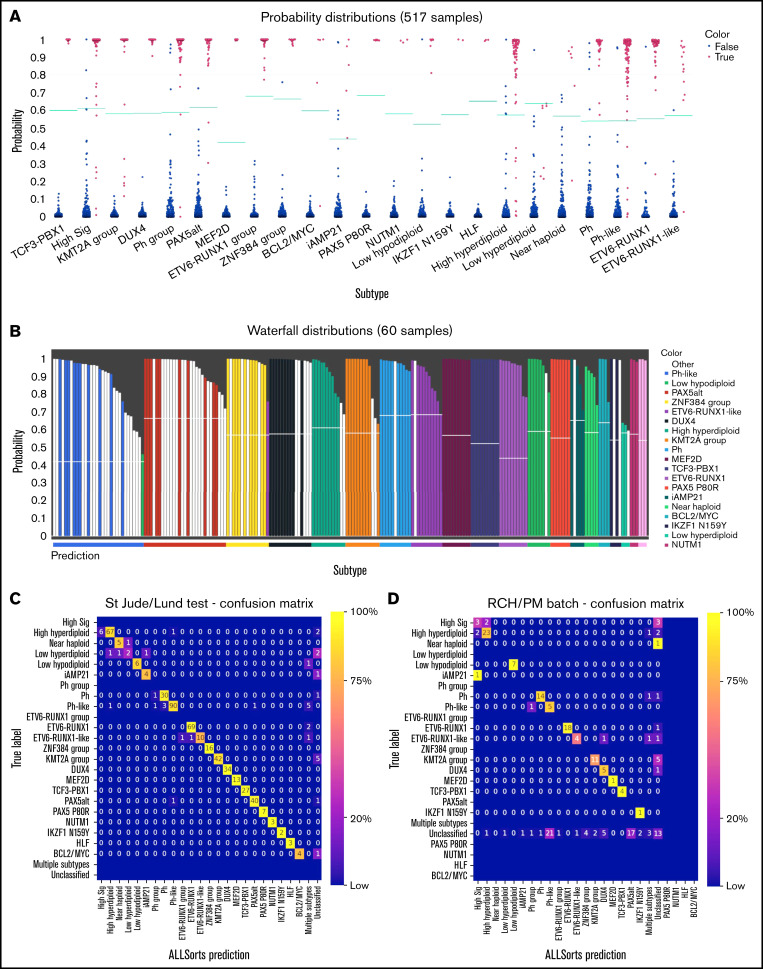
Validation of ALLsorts. (A) Predicted probabilities of St. Jude’s and Lund hold-out samples per subtype. For each sample, ALLSorts reports a probability for every subtype. Blue dots are samples negative for that subtype, and red are positive. The green lines are the subtype probability thresholds that were determined from the training data (supplemental Methods). (B) Waterfall plot of RCH and PM samples that were previously unclassified and assigned new subtypes by ALLSorts (white bars). The colored bars represent samples with positive classifications from the St. Jude’s/Lund held out set. The y axis shows the highest probability reported for the sample, and the x axis color is the prediction as made by ALLSorts. Samples with multiple subtypes are displayed in every subtype where a prediction is made. (C) Confusion matrix of the St. Jude’s/Lund held-out test data. A confusion matrix shows the performance of the classifier. The y axis represents the ground truth of each subtype, and the x -axis is the ALLSorts prediction. A perfect classification result would include no values off the diagonal. ALLSorts can predict samples to have multiple labels; these are reflected in the multiple subtypes category. Unclassified is where a sample’s probability did not exceed the threshold for any subtype. (D) Confusion matrix of the combined RCH and PM cohorts. The y axis represents the previous classification of each sample, and the x axis is the ALLSorts prediction. Rows without values indicate no subtype with that true label in the dataset.
