. 2022 Apr 29;376(6592):eabi8175.
doi: 10.1126/science.abi8175. Epub 2022 Apr 29.

Stepwise-edited, human melanoma models reveal mutations' effect on tumor and microenvironment

Affiliations

Stepwise-edited, human melanoma models reveal mutations' effect on tumor and microenvironment

Eran Hodis et al. Science. .

Abstract

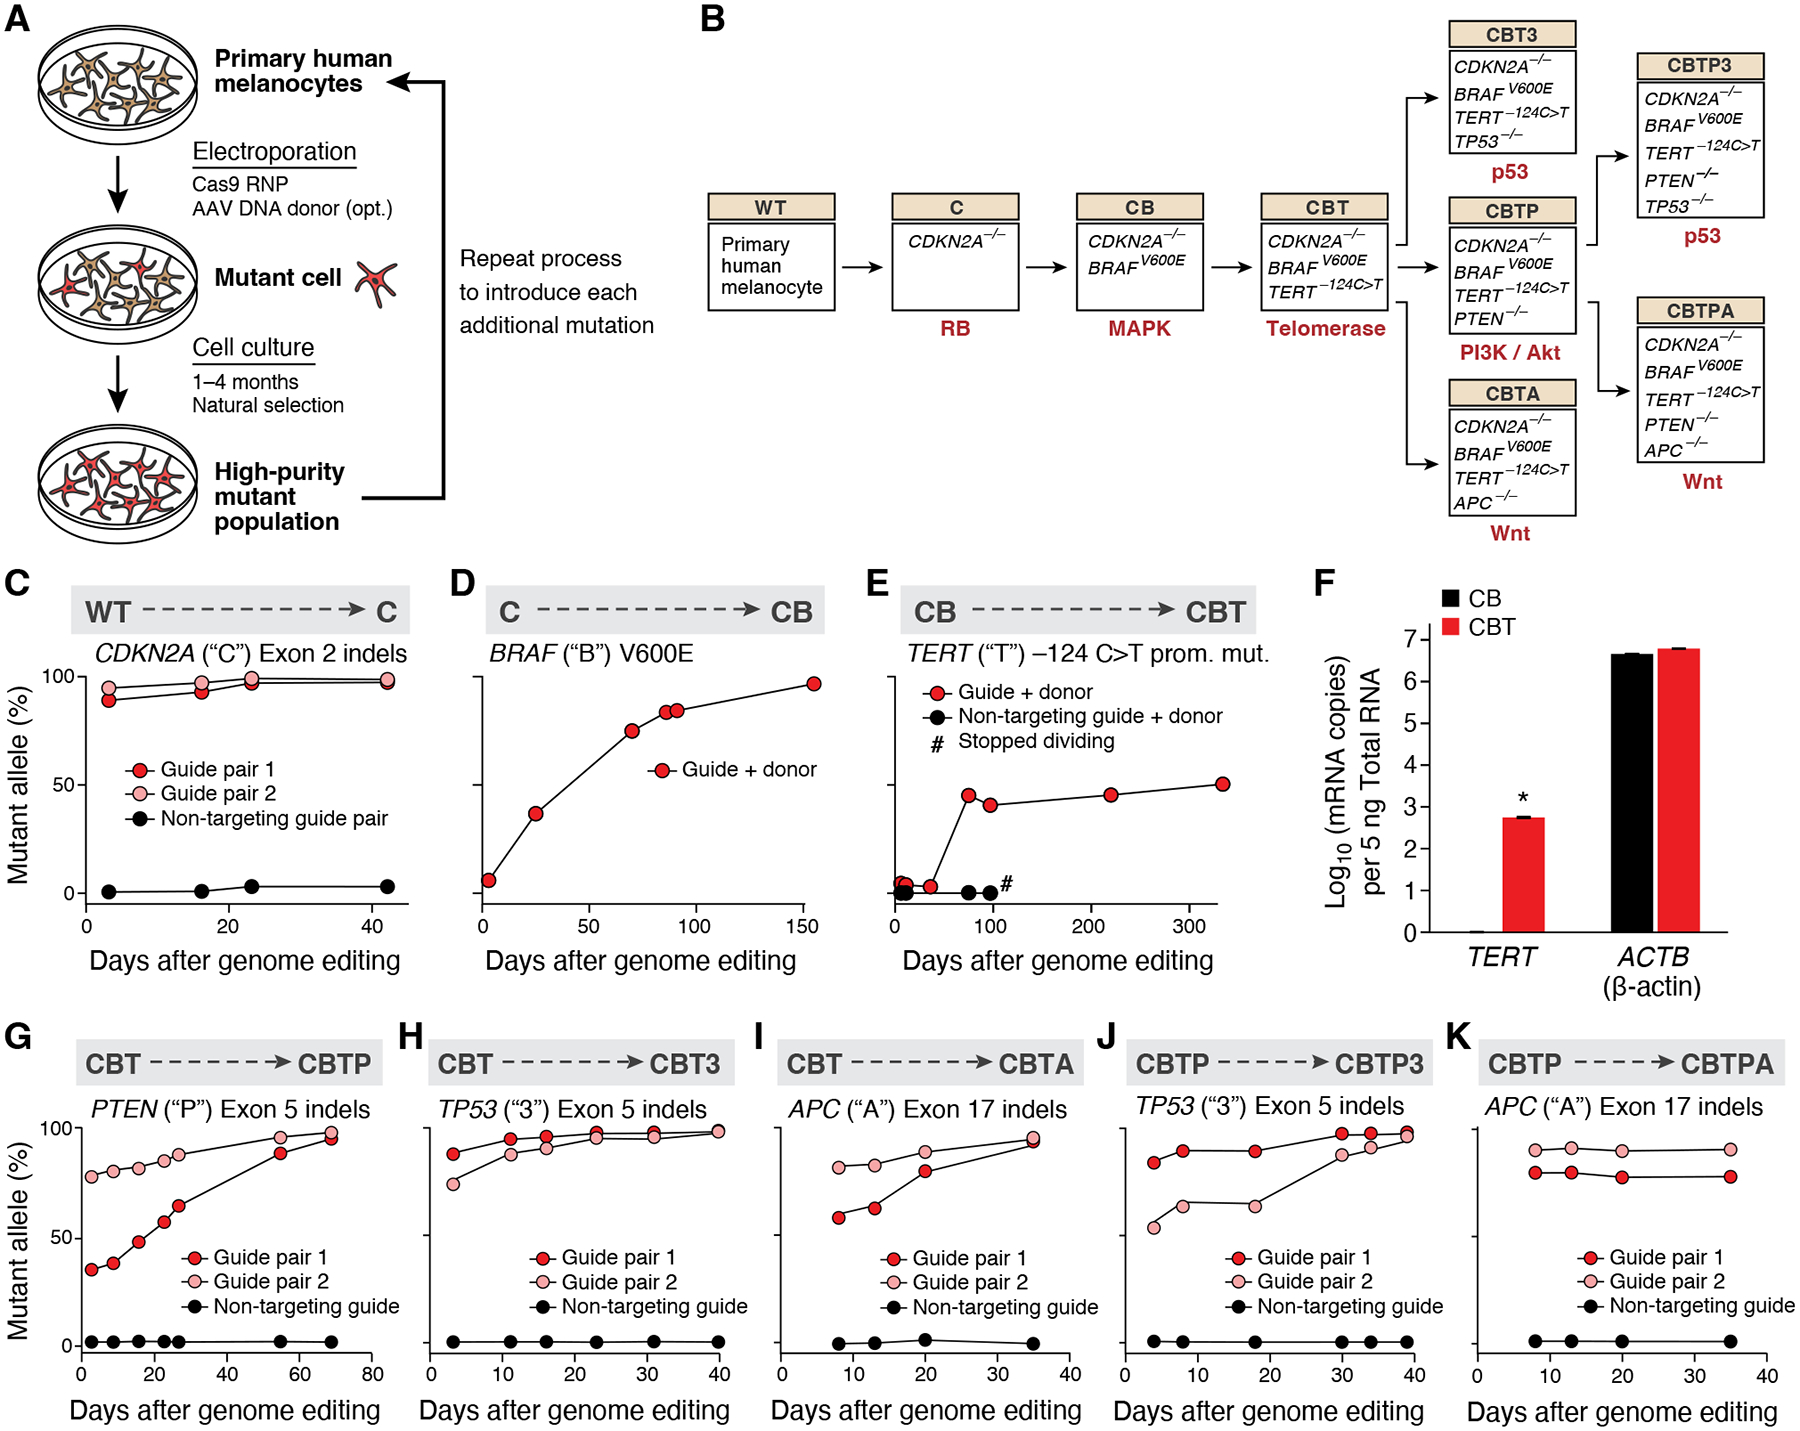
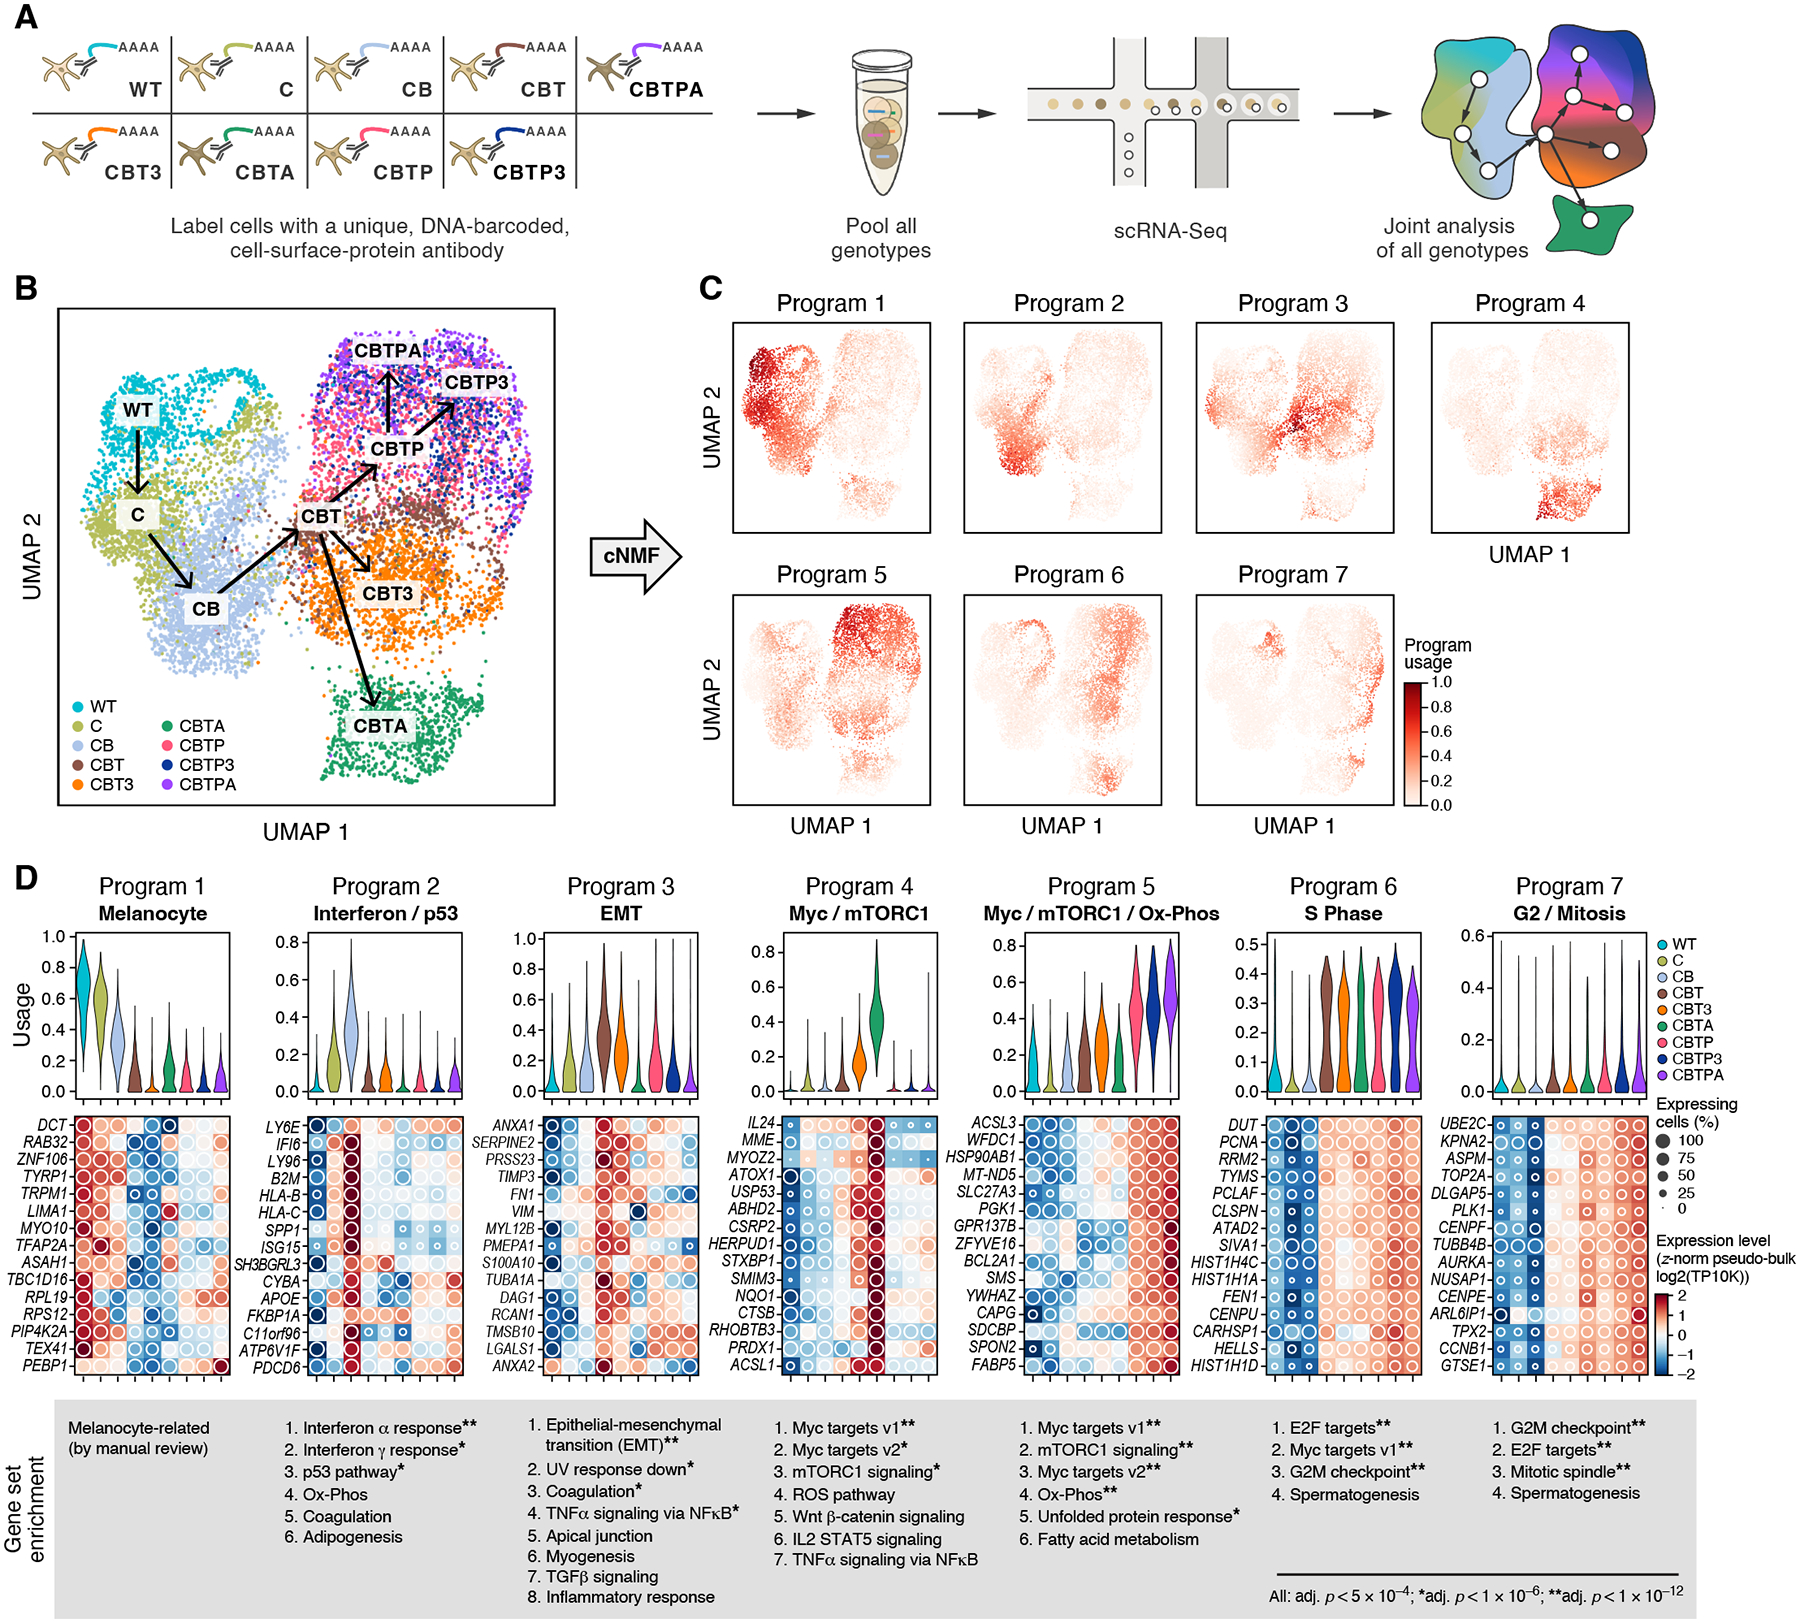
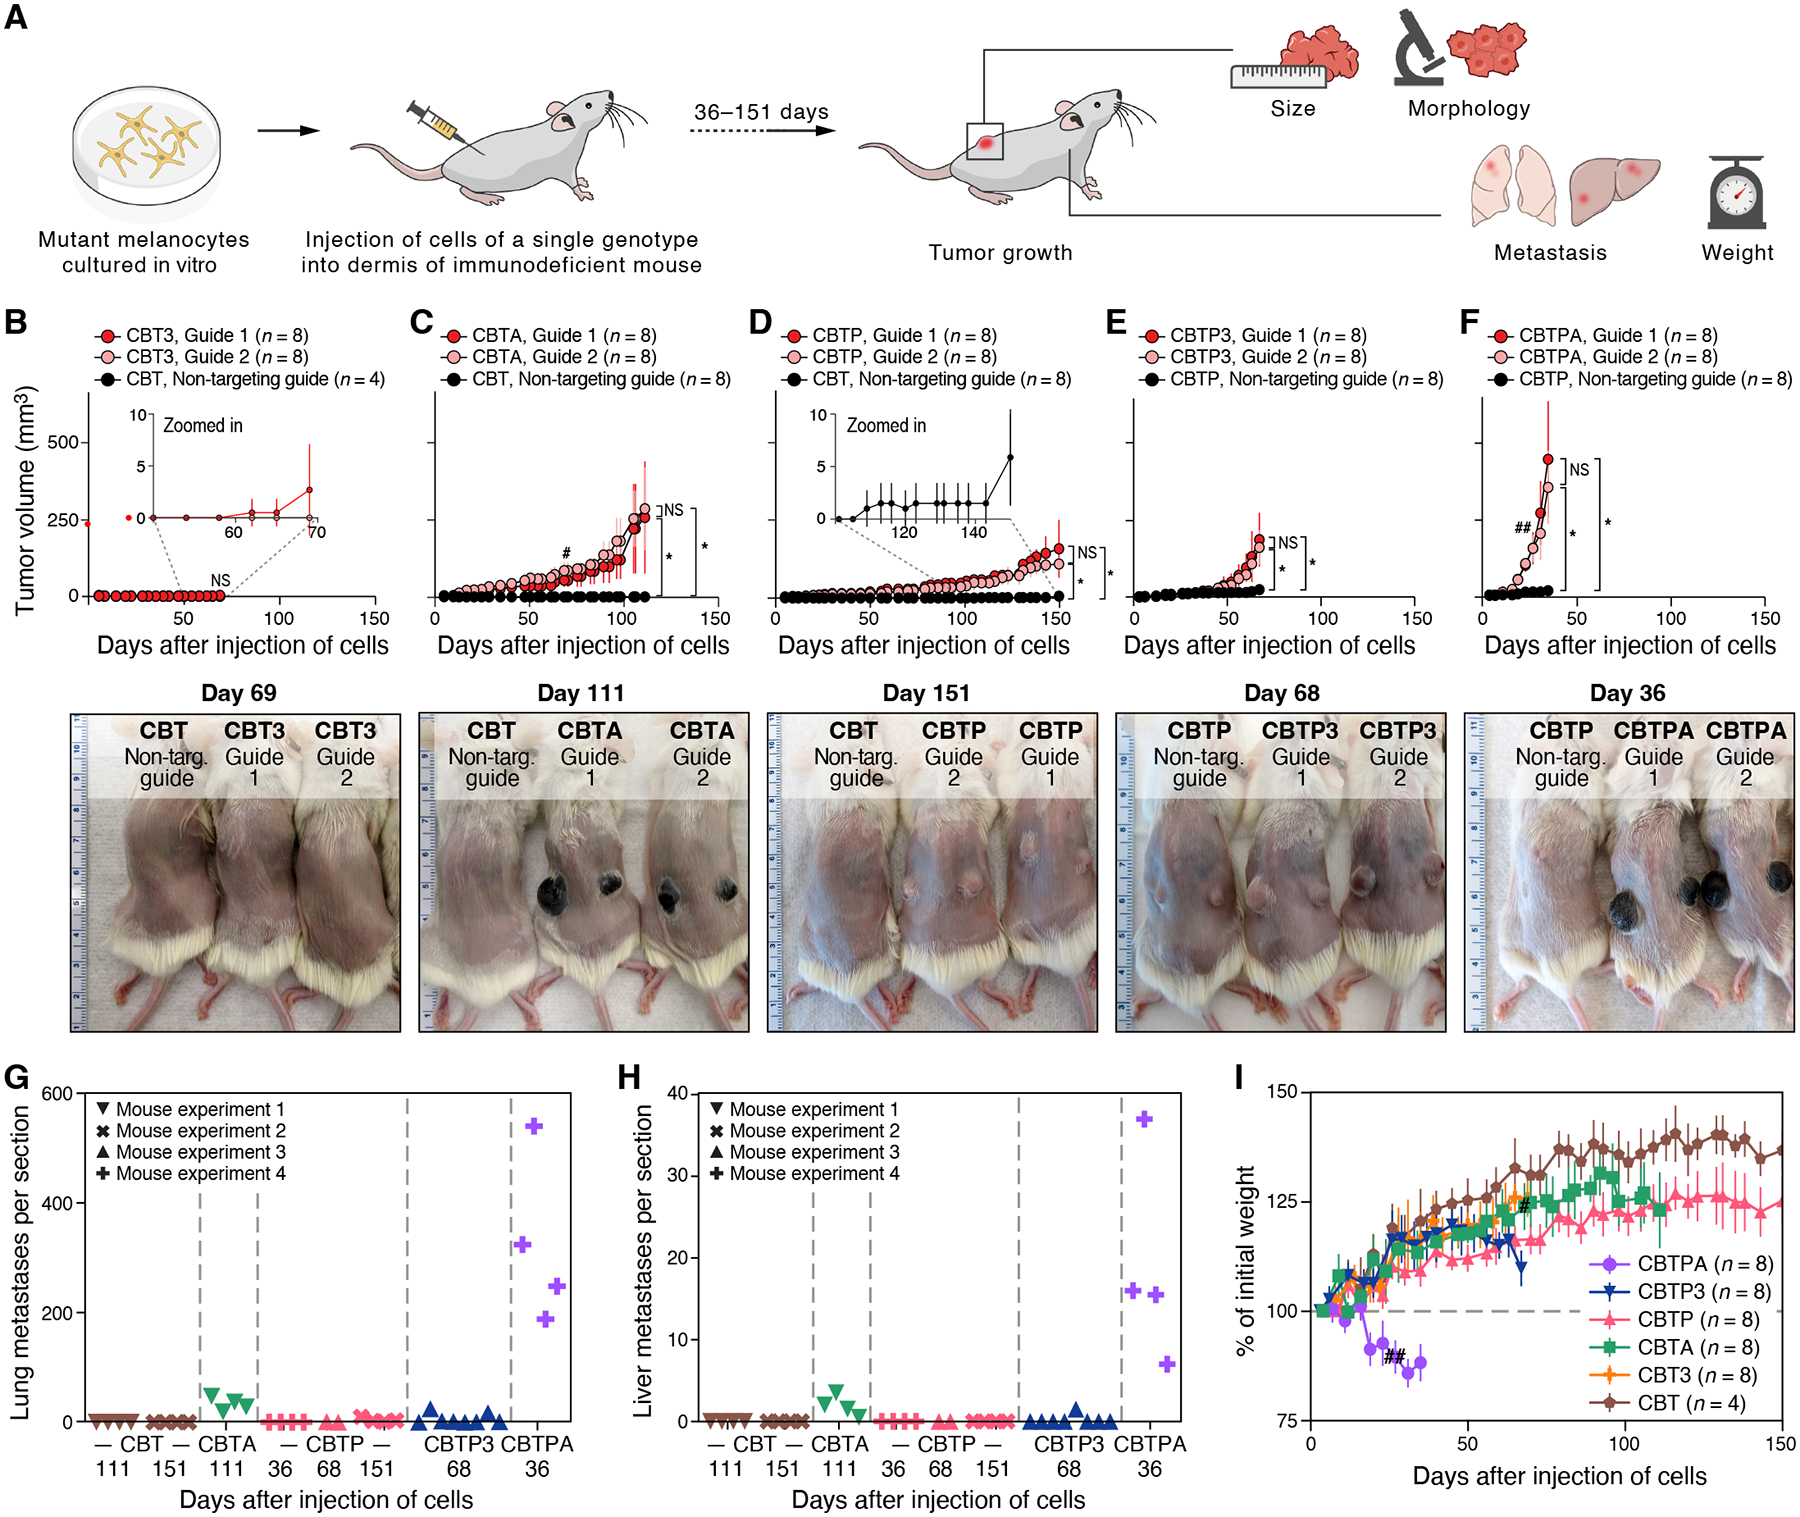
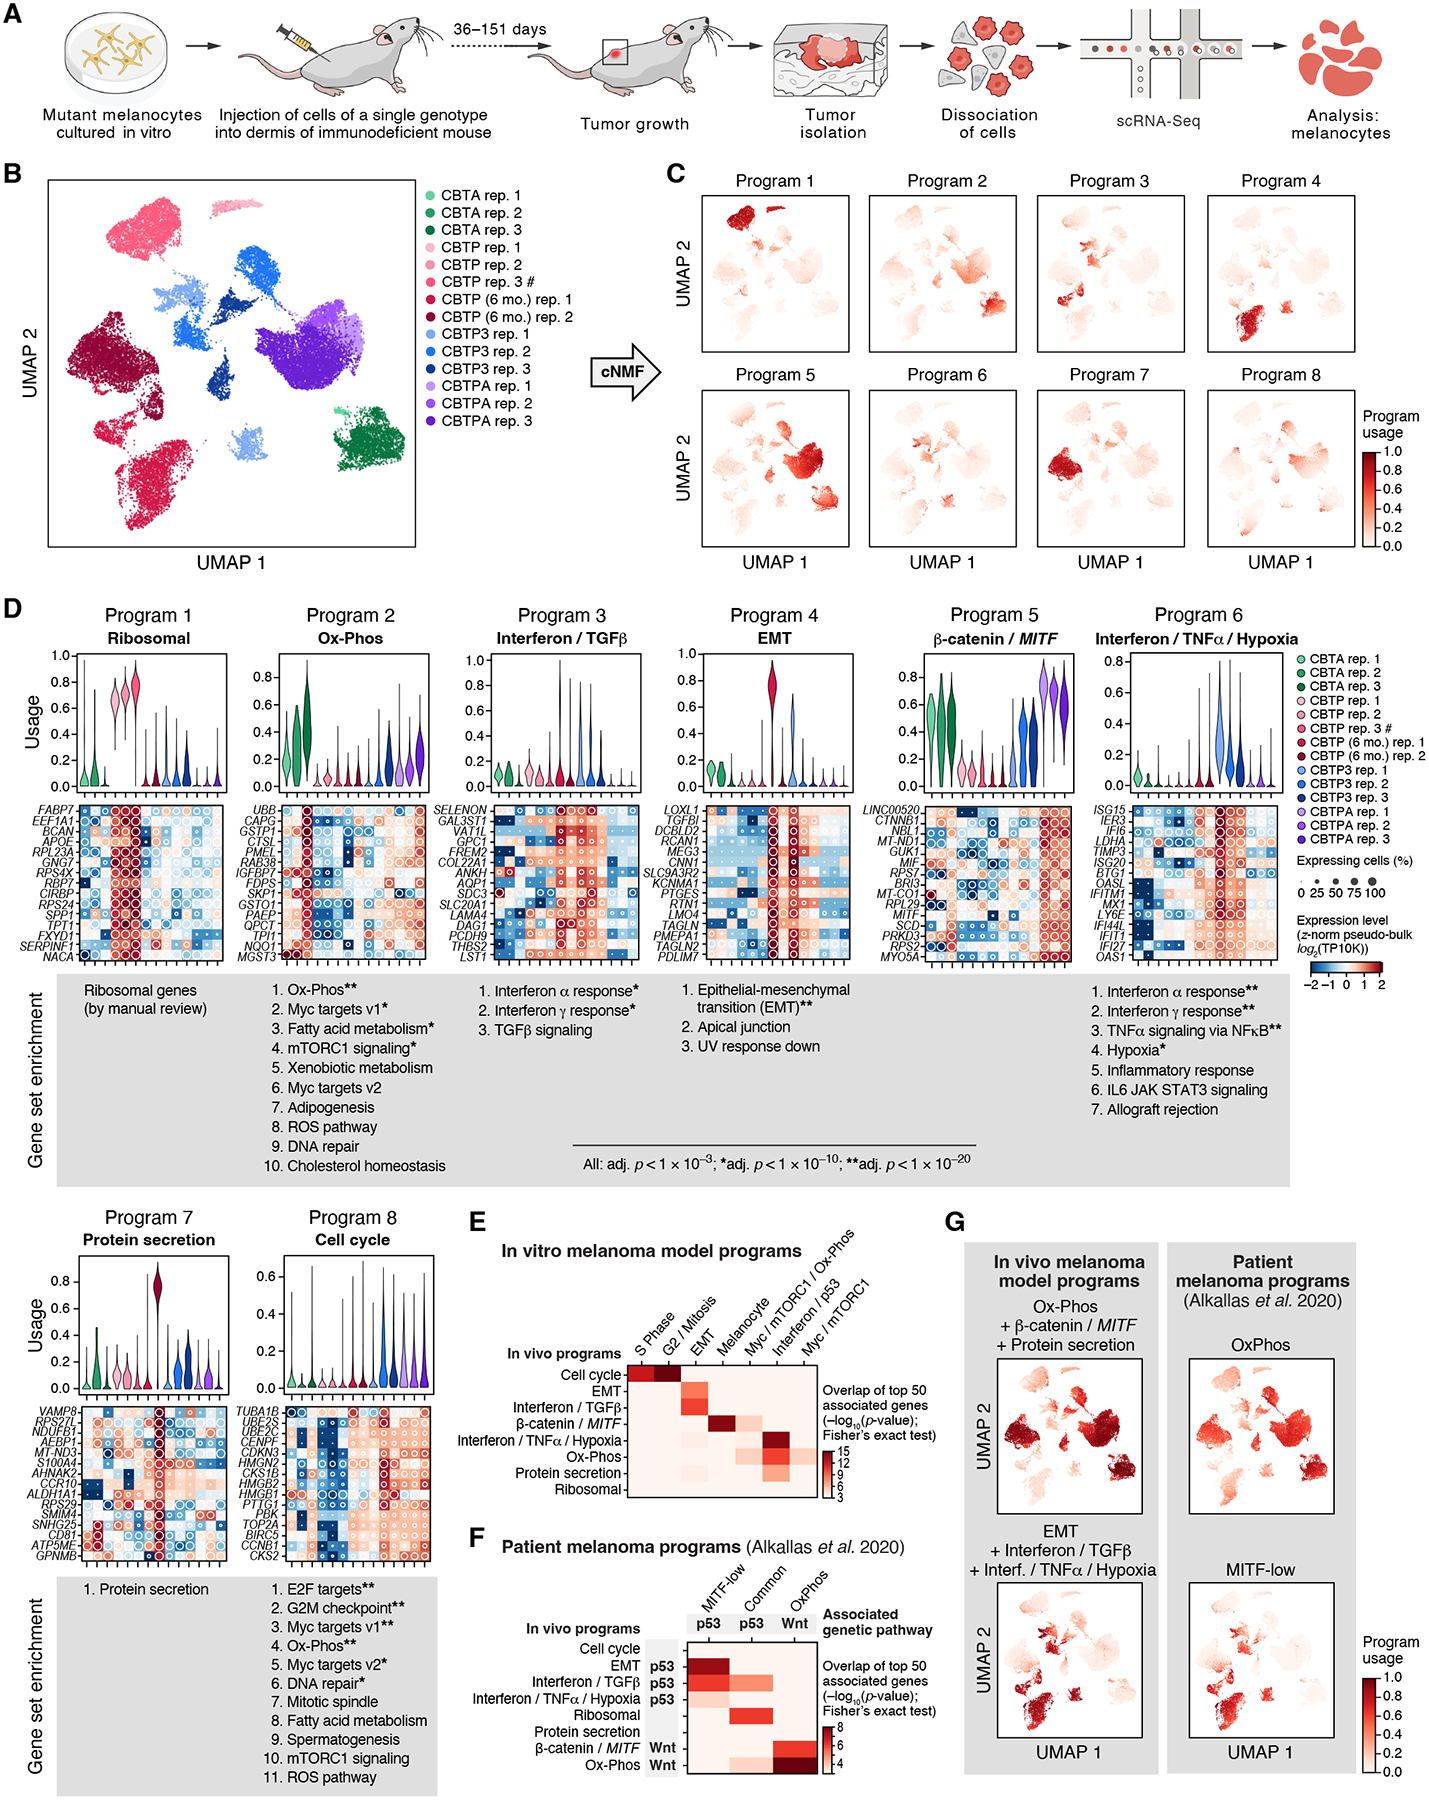
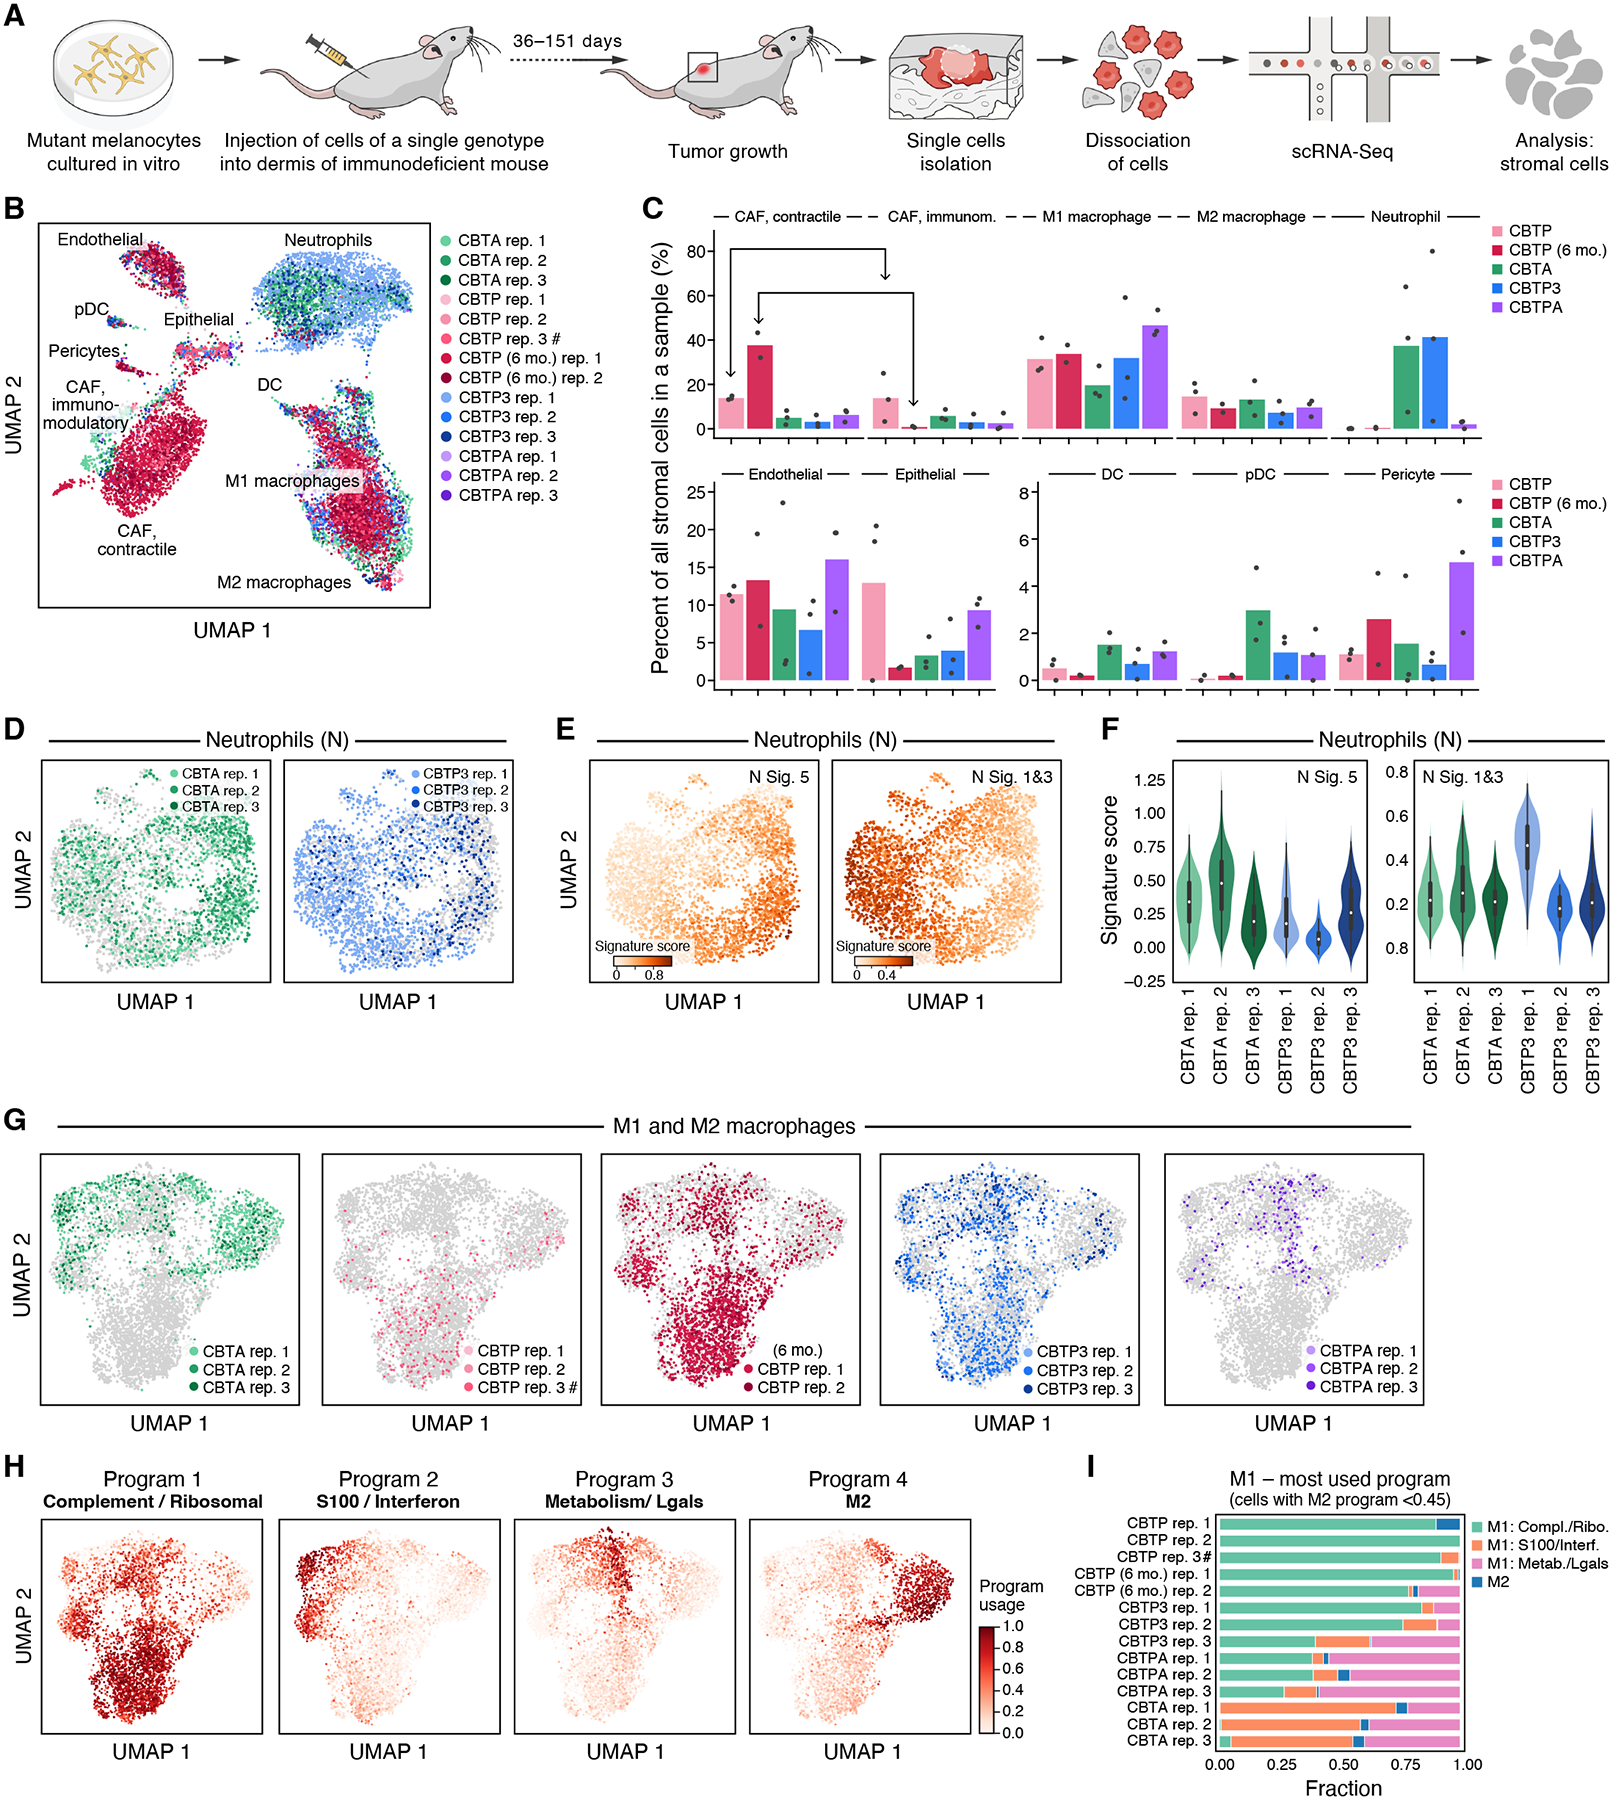
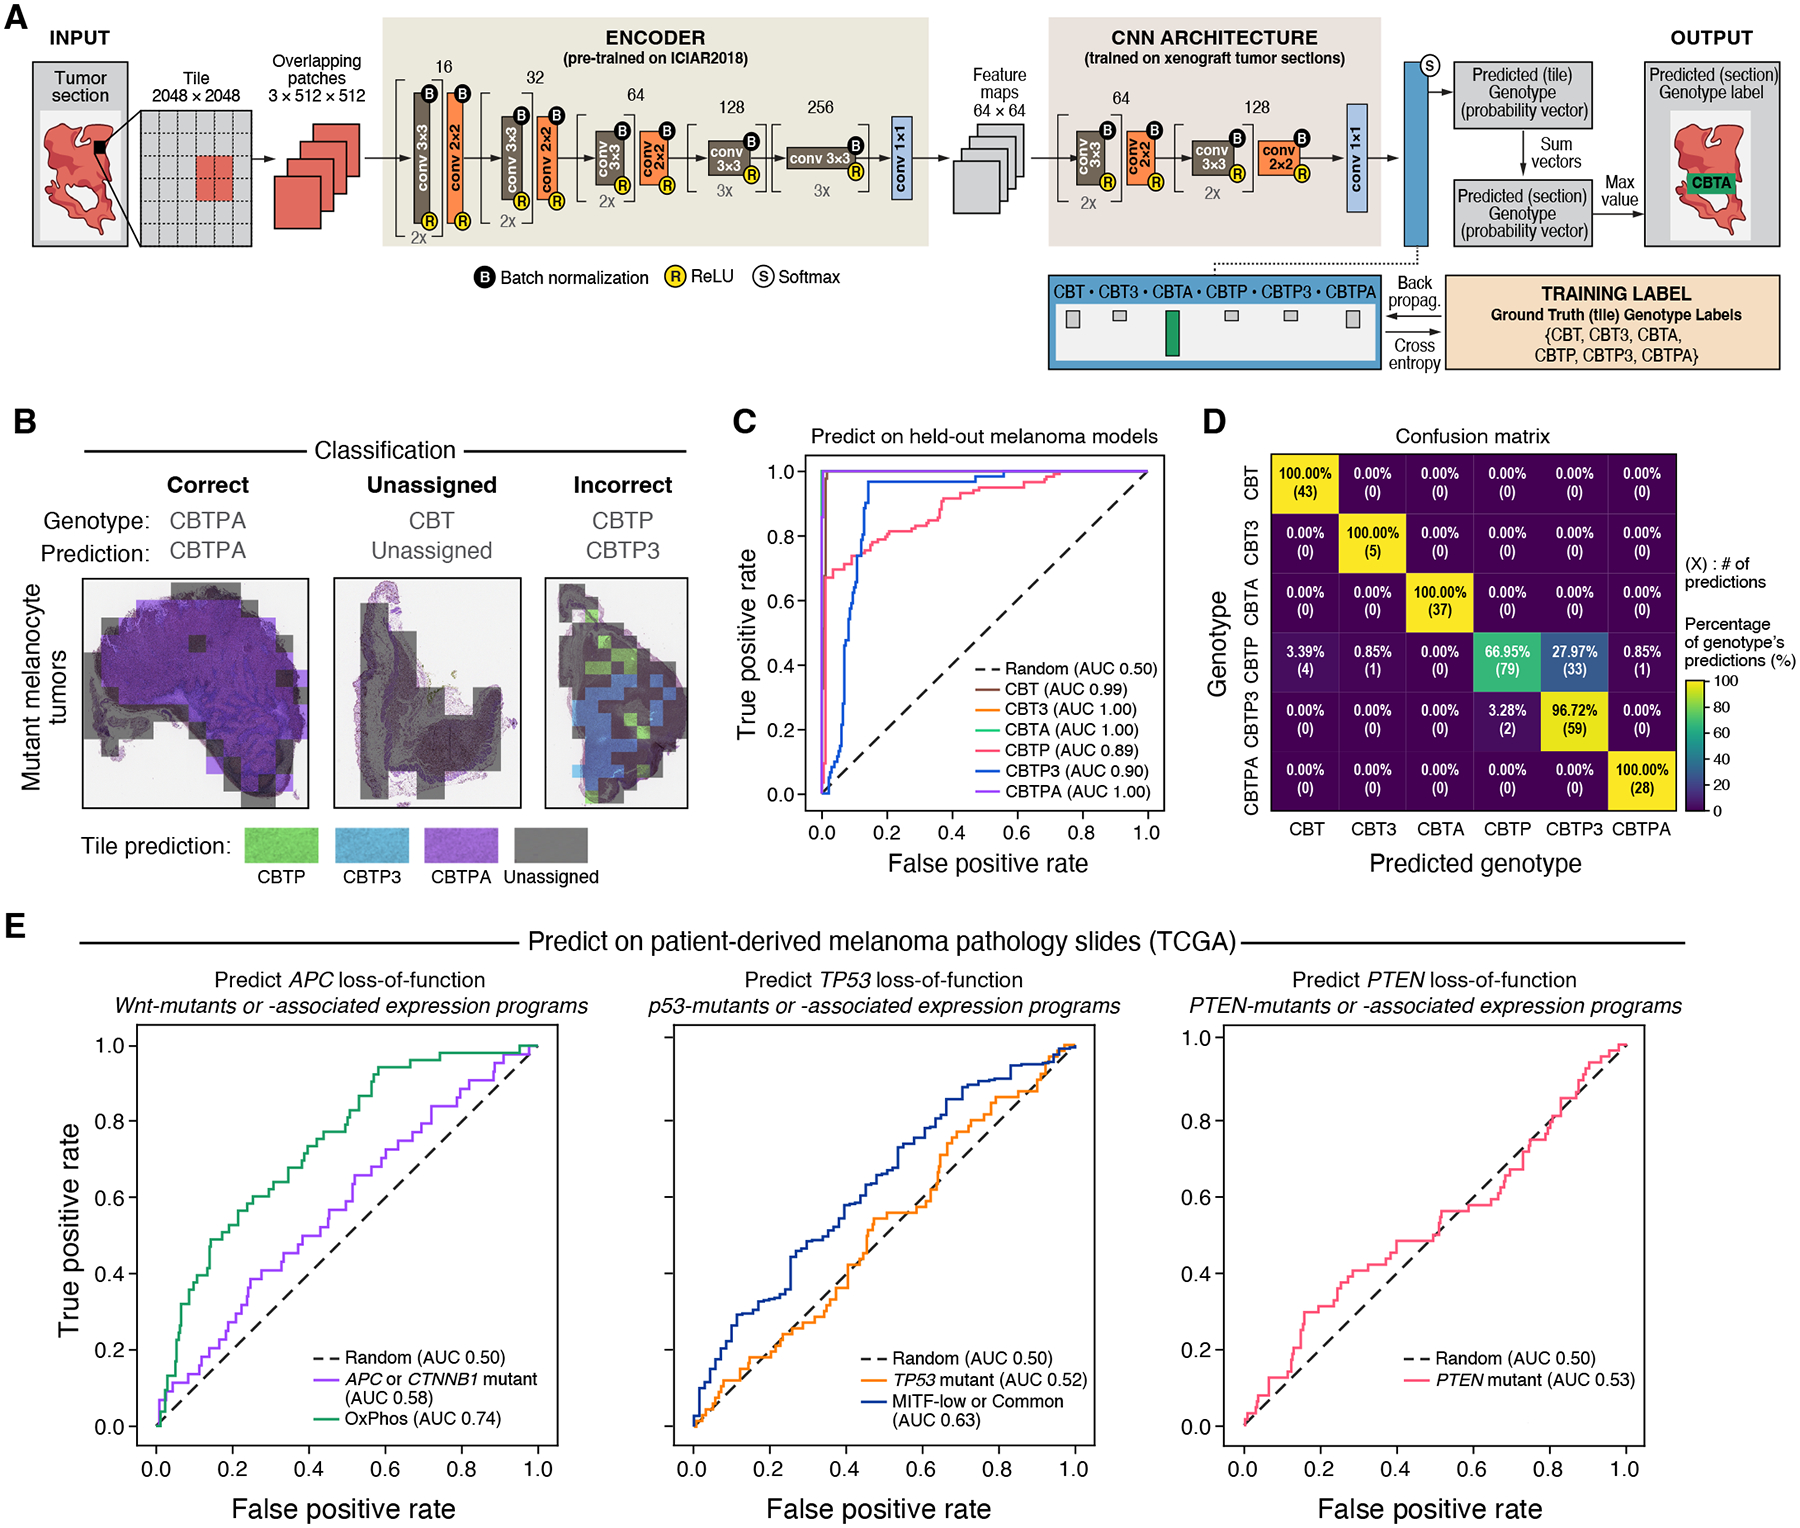
Establishing causal relationships between genetic alterations of human cancers and specific phenotypes of malignancy remains a challenge. We sequentially introduced mutations into healthy human melanocytes in up to five genes spanning six commonly disrupted melanoma pathways, forming nine genetically distinct cellular models of melanoma. We connected mutant melanocyte genotypes to malignant cell expression programs in vitro and in vivo, replicative immortality, malignancy, rapid tumor growth, pigmentation, metastasis, and histopathology. Mutations in malignant cells also affected tumor microenvironment composition and cell states. Our melanoma models shared genotype-associated expression programs with patient melanomas, and a deep learning model showed that these models partially recapitulated genotype-associated histopathological features as well. Thus, a progressive series of genome-edited human cancer models can causally connect genotypes carrying multiple mutations to phenotype.


Conflict of interest statement

Competing interests: E.H. is a consultant for and holds equity in Dyno Therapeutics and was a consultant for GV. T.B., J-C.H., D.P., O.R.R., L.A.G., and A.R. are employees of Genentech since February 1, 2021, September 20, 2021, May 3, 2021, October 19, 2020, January 1, 2019, and August 1, 2020, respectively. J.C.H. owns stock of F. Hoffmann-La Roche AG. D.S. is a consultant for Roche Glycart AG, since August 2021. A.R. and O.R.R. are co-inventors on patent applications filed by the Broad Institute for inventions related to single cell genomics. L.A.G. is an equity holder of Roche/Genentech and was a co-founder and equity holder at Foundation Medicine, Inc. and Tango Therapeutics. A.R. is an equity holder of Roche/Genentech and is a founder and equity holder of Celsius Therapeutics, an equity holder in Immunitas Therapeutics and until July 31, 2020 was an SAB member of Syros Pharmaceuticals, Neogene Therapeutics, Asimov, and ThermoFisher Scientific. E.H., L.A.G., and A.R. are named inventors on a patent application filed by the Broad Institute covering the work described in this manuscript (U.S. Patent Application No. 16/631,916, National Phase of PCT/US2018/042737).

Figures

Figure 1.
Figure 1.. Fitness advantage of cancer-driving mutations enables the creation of a progressive series of genome-edited, human cancer models.
(A) Experimental approach for introducing sequential melanoma mutations into the genomes of primary human melanocytes using CRISPR/Cas9. RNP: ribonucleoprotein. AAV: adeno-associated virus. (B) Editing tree. The nine isogenic models of melanoma generated (boxes), the perturbed genes in each model (inside box), the genotype abbreviation (beige boxes), and the molecular pathway dysregulated by the most recent genome edit (red text). (C-E) Sequential introduction of first three mutations by CRISPR/Cas9 genome editing of wild-type (‘WT’) melanocytes. (C) First mutation: CDKN2A (‘C’). (D) Second mutation: BRAF (‘B’). (E) Third mutation: TERT (‘T’). TERT editing confers replicative immortality to CB melanocytes. Allele frequencies of each engineered mutation (y axis) shown over time (x axis). #: measurement of allele frequency discontinued due to cell senescence. (F) Addition of the −124C>T TERT promoter mutation activates TERT expression. Mean of log 10 number of TERT and β-actin (ACTB) transcripts (y axis) measured by qPCR in CB (black) and CBT (red) cells. Error bars: SD. n=3. *: p < 0.01, one-tailed, one-sample Student’s t-test. (G-I) Introduction of fourth mutation into CBT melanocytes. (G) Allele frequencies of knockout of PTEN (‘P’), (H) knockout of TP53 (‘3’), and (I) knockout of APC (‘A’). (J-K) Introduction of fifth mutations into CBTP melanocytes (J) Allele frequency of knockout of PTEN and (K) knockout of TP53. Allele frequencies (y axis) shown over time (x axis), as assessed by indels in the respective loci in genomic DNA.
Figure 2.
Figure 2.. Consecutive mutations produce ordered progression through expression space and activate shared expression programs.
(A) Experimental overview to profile gene expression in parallel from cells from nine engineered genotypes with hashed scRNA-seq. (B) Gradual progression of cell states with genotype. UMAP embedding of melanocyte scRNA-seq profiles (dots) colored and labeled (boxes) by genotype (legend). Arrows follow the editing tree (as in Fig. 1B). (C) Expression programs. UMAP embedding as in (B) colored by per-cell relative usage (color bar) of each of seven expression programs identified by consensus non-negative matrix factorization (cNMF). (D) Programs reflect key processes and vary across genotypes. Top: Distribution of relative program usages (y axis) in single cells of each genotype (x axis, color legend). Middle: Aggregate (pseudo-bulk) expression (Z-score of expression (log2 of transcripts per 10,000 reads, TP10K), color bar) and percent of expressing single cells (white circles) of the 15 top program-associated genes (rows) per genotype (columns). Bottom: Ranked lists of gene sets (MSigDB Hallmark (83)) enriched in each program (Mann-Whitney U test, False Discovery Rate (FDR) < 5×10⁻⁴, * FDR < 10−6, ** FDR < 10−12).
Figure 3.
Figure 3.. Mutation combinations confer diverse, disease-relevant phenotypes in vivo.
(A) Experimental approach to identify disease-relevant phenotypes caused by engineered mutations in vivo. (B-F) Primary tumor growth of xenografted mutant melanocytes in NSG mice compared to CBT or CBTP control parental cells, as shown, that received non-targeting Cas9 RNP: (B) CBT3, (C) CBTA, (D) CBTP, (E) CBTP3, and (F) CBTPA cells. Top panels: tumor size (mm3, y axis) over time (days, x axis) following two intradermal injections, one in each flank. n: number of tumors. Bottom panels: representative images of (shaved) mice harboring mutant cells as marked. Ruler with large, numbered marks in centimeters for scale. (G, H) Loss of APC promotes frequent distant metastases. Average number of individual metastatic foci per section (symbols) of lung (G) or liver (H) tissue in a histologic slide (y axis, counted manually) obtained from a single mouse injected with a mutant cell line (genotype indicated by color) and collected after the indicated number of days (x axis). Each slide had an average of three lung sections and two liver sections, each from a different lobe. (I) Injected CBTPA melanocytes cause rapid weight loss in mice. Percent of initial mouse weight (y axis, determined after subtracting primary tumor weights (estimated at 1g/cm3) from measured mouse weights) over time (x axis, days). n: number of mice. Data in (G, H) are from the four independent experiments in (C-F). # two CBTA mice, one from each guide group, were sacrificed for histological inspection. ## one CBTPA mouse was euthanized due to primary tumor ulceration. * p < 0.01, NS not significant, two-tailed, two-sample Student’s t-test.
Figure 4.
Figure 4.. Genome edited melanocytic tumors share expression programs with patient melanomas, with matching genetic associations.
(A) Experimental approach to profile gene expression from tumor cells from xenografts with scRNA-seq. (B) Intra- and inter-genotype variation of cancer cell states in vivo. UMAP embedding of engineered melanocyte scRNA-seq profiles (dots) colored and labeled (boxes) by genotype and replicate (legend). #: CBTP rep. 3 is a mixture of four tumors from two mice; all other replicates are from a single tumor. (C) Expression programs. UMAP embedding as in (B) colored by per-cell relative usages (color bar) of each of seven expression programs identified by cNMF. (D) Programs reflect key cellular processes that vary in usage across genotypes. Top: Distribution of relative program usage (y axis) in single cells of each genotype (x axis, color legend). Middle: Aggregate (pseudo-bulk) expression level (Z-score of expression level (log2(TP10K)), color bar) and percent of expressing single cells (white circles) of the 15 top program-associated genes (rows) per genotype (columns). Bottom: Ranked lists of gene sets (MSigDB Hallmark (83)) enriched in each program (Mann-Whitney U test, FDR< 10−3, * FDR < 10−10, ** FDR < 10−20). (E) Correspondence of in vivo and in vitro programs. Significance of overlap (−log10(p-value), Fisher’s exact test, colorbar) of top 50 associated genes between in vivo (rows) and in vitro (columns, as in Fig. 2) programs. Only overlaps with p-value < 10−3 are shown to account for multiple hypothesis testing. (F) Correspondence of in vivo programs and programs in patient melanomas (16). Significance of overlap (-log10(p-value), Fisher’s exact test, colorbar) of top 50 associated genes between in vivo (rows) and patient (column) programs. Only overlaps with p-value < 10−3 are shown to account for multiple hypothesis testing. Associations of expression programs with either p53 or Wnt pathway gene mutations are noted. (G) Similar usage of melanoma (16) and in vivo model programs across in vivo melanoma model single-cell profiles. UMAP embedding (as in B), colored by per-cell relative usage of patient melanoma expression programs (right) or sums of relative usages of in vivo melanocyte expression programs (left).
Figure 5.
Figure 5.. Tumor genotype shapes tumor microenvironment composition.
(A) Experimental approach to profile gene expression from mouse cells in tumor xenografts with scRNA-seq. (B,C) Remodeling of the tumor microenvironment cellular composition by cancer cell genotype and duration in mouse. (B) UMAP embedding of tumor microenvironment scRNA-seq profiles (dots) colored by genotype and replicate (legend), and labeled by cell type. #: CBTP rep. 3 is a mixture of four tumors from two mice, whereas all other replicates are from a single tumor. (C) Mean (bar) and individual (dots) percent (y axis) of tumor microenvironment cells of each type (x axis) in each genotype (color). (D-F) Diversity of neutrophil expression programs in tumors of different genotypes. (D) UMAP embedding of neutrophil single cell profiles (dots) from specific tumor genotypes (color) and all other genotypes (gray). (E) UMAP embedding of neutrophil profiles (as in D) highlighting only the neutrophils in CBTA and CBPT3 tumors colored by per-cell score of neutrophil expression signatures, N5 (associated with tumor growth) and N1N3 (more similar to circulating and healthy-tissue neutrophils); signatures previously described (55). (F) Distribution of per-cell neutrophil expression program score (y axis) in neutrophils from CBTA (green) and CBTP3 (blue) tumors. p-value < 0.001 (N5), p-value < 0.001 (N1N3), Kruskal-Wallis rank sum test, df = 5. (G-I) Impact of tumor genotype on macrophages expression programs. (G,H) UMAP embedding of M1 and M2 macrophage single-cell profiles (dots), colored by specific tumor genotypes (G), or by per-cell relative usage of macrophage gene expression cNMF programs (H). (I) Fraction of cells (x axis) with the highest score in each of four cNMF programs (colors) among M1 cells (defined as cells with M2-related program score <0.45) in each replicate (y axis).
Figure 6.
Figure 6.. Tumor genotype leads to distinct histological features that also associate with genotype-linked expression states in patient melanomas.
(A) Computational approach to classify histological slides into engineered genotypes. (B) Test set classification examples. Classification of individual tiles (colored squares overlying tissue images), the aggregated classification for the entire section (“Prediction”), and the true genotype (“Genotype”) for three examples. (C,D) Successful prediction of genotype from histology in held-out mutant melanocyte in vivo tumor section images. (C) Receiver operating characteristic (ROC) curves of the prediction false positive rate (x axis) and true positive rate (y axis) at each probability threshold, for each genotype (color). Area under the curve (AUC) is indicated for each genotype in the legend. (D) Percentage (color bar) of samples from a given genotype (y axis) that received each genotype classification (x axis). The percentage and number of such predictions are displayed within each cell. (E) Inferring genotype and genotype-associated expression states in patient melanomas (from TCGA) based on images of H&E stained tumor sections. ROC curves obtained by predicting, left: APC loss-of-function genotype (a Wnt pathway gene) and setting true positive labels to be either Wnt pathway mutants or a Wnt-associated expression program; middle: TP53 and TP53-associated expression programs; or right: PTEN (no PTEN-associated expression program available).

References

    1. Garraway LA, Lander ES, Lessons from the Cancer Genome. Cell. 153 (2013), pp. 17–37. - PubMed
    1. Vogelstein B, Papadopoulos N, Velculescu VE, Zhou S, Diaz LA, Kinzler KW, Cancer Genome Landscapes. Science. 339 (2013), pp. 1546–1558. - PMC - PubMed
    1. Turajlic S, Xu H, Litchfield K, Rowan A, Chambers T, Lopez JI, Nicol D, O’Brien T, Larkin J, Horswell S, Stares M, Au L, Jamal-Hanjani M, Challacombe B, Chandra A, Hazell S, Eichler-Jonsson C, Soultati A, Chowdhury S, Rudman S, Lynch J, Fernando A, Stamp G, Nye E, Jabbar F, Spain L, Lall S, Guarch R, Falzon M, Proctor I, Pickering L, Gore M, Watkins TBK, Ward S, Stewart A, DiNatale R, Becerra MF, Reznik E, Hsieh JJ, Richmond TA, Mayhew GF, Hill SM, McNally CD, Jones C, Rosenbaum H, Stanislaw S, Burgess DL, Alexander NR, Swanton C, PEACE, TRACERx Renal Consortium, Tracking Cancer Evolution Reveals Constrained Routes to Metastases: TRACERx Renal. Cell. 173, 581–594.e12 (2018). - PMC - PubMed
    1. Sanborn JZ, Chung J, Purdom E, Wang NJ, Kakavand H, Wilmott JS, Butler T, Thompson JF, Mann GJ, Haydu LE, Saw RPM, Busam KJ, Lo RS, Collisson EA, Hur JS, Spellman PT, Cleaver JE, Gray JW, Huh N, Murali R, Scolyer RA, Bastian BC, Cho RJ, Phylogenetic analyses of melanoma reveal complex patterns of metastatic dissemination. Proc. Natl. Acad. Sci. U. S. A 112, 10995–11000 (2015). - PMC - PubMed
    1. Zaretsky JM, Garcia-Diaz A, Shin DS, Escuin-Ordinas H, Hugo W, Hu-Lieskovan S, Torrejon DY, Abril-Rodriguez G, Sandoval S, Barthly L, Saco J, Homet Moreno B, Mezzadra R, Chmielowski B, Ruchalski K, Shintaku IP, Sanchez PJ, Puig-Saus C, Cherry G, Seja E, Kong X, Pang J, Berent-Maoz B, Comin-Anduix B, Graeber TG, Tumeh PC, Schumacher TNM, Lo RS, Ribas A, Mutations Associated with Acquired Resistance to PD-1 Blockade in Melanoma. N. Engl. J. Med 375, 819–829 (2016). - PMC - PubMed

Publication types