. 2022 Apr 29;376(6592):eabk0639.
doi: 10.1126/science.abk0639. Epub 2022 Apr 29.

Ancestry-inclusive dog genomics challenges popular breed stereotypes

Affiliations

Ancestry-inclusive dog genomics challenges popular breed stereotypes

Kathleen Morrill et al. Science. .

Abstract

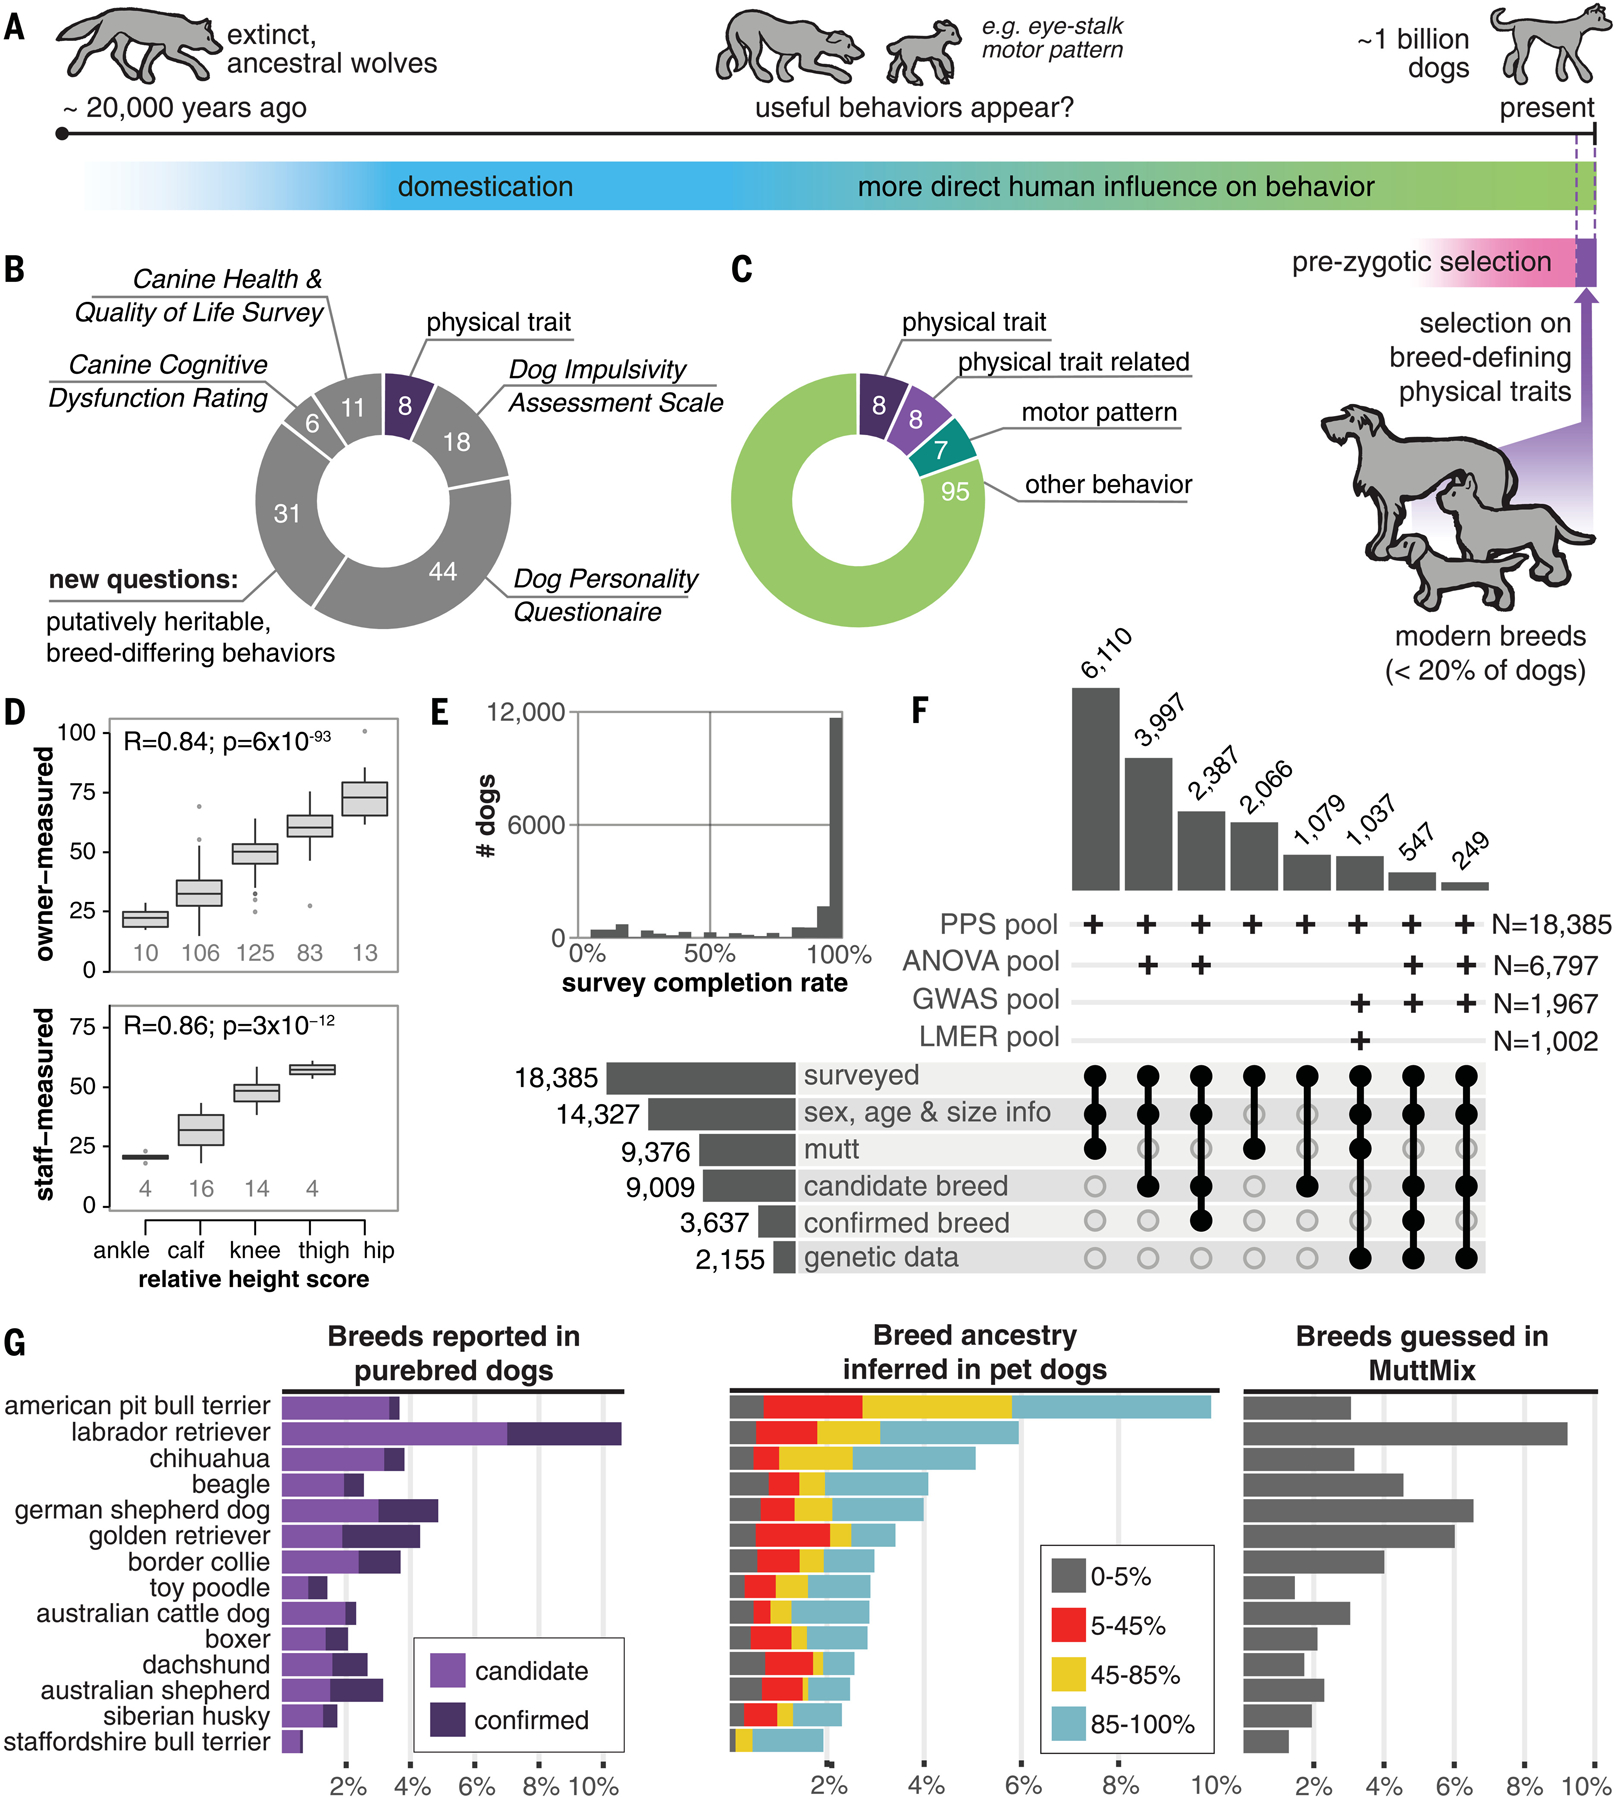
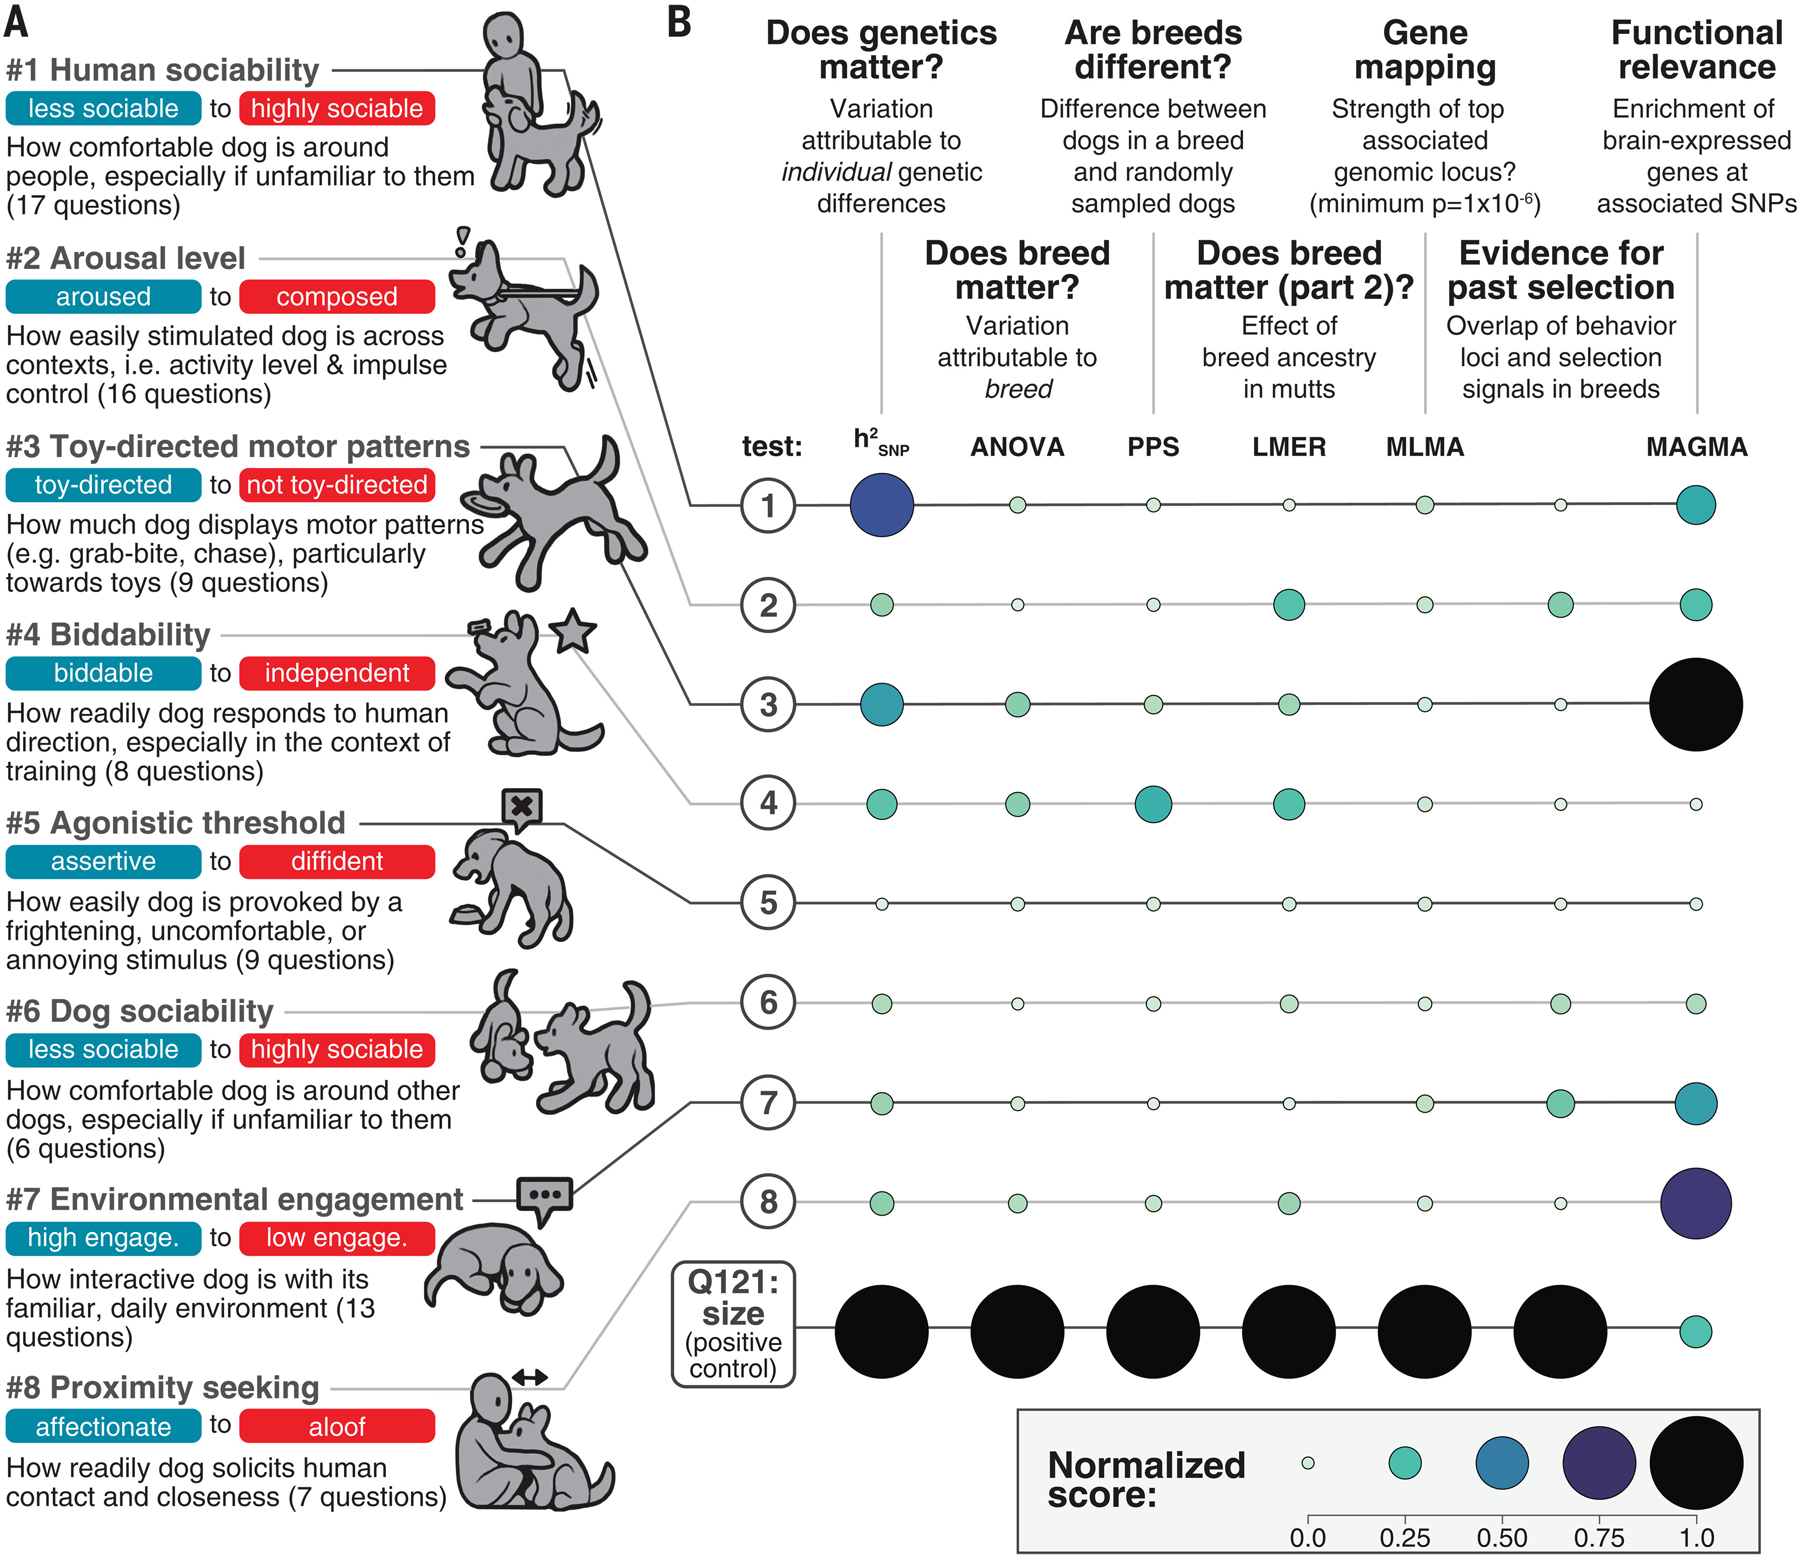
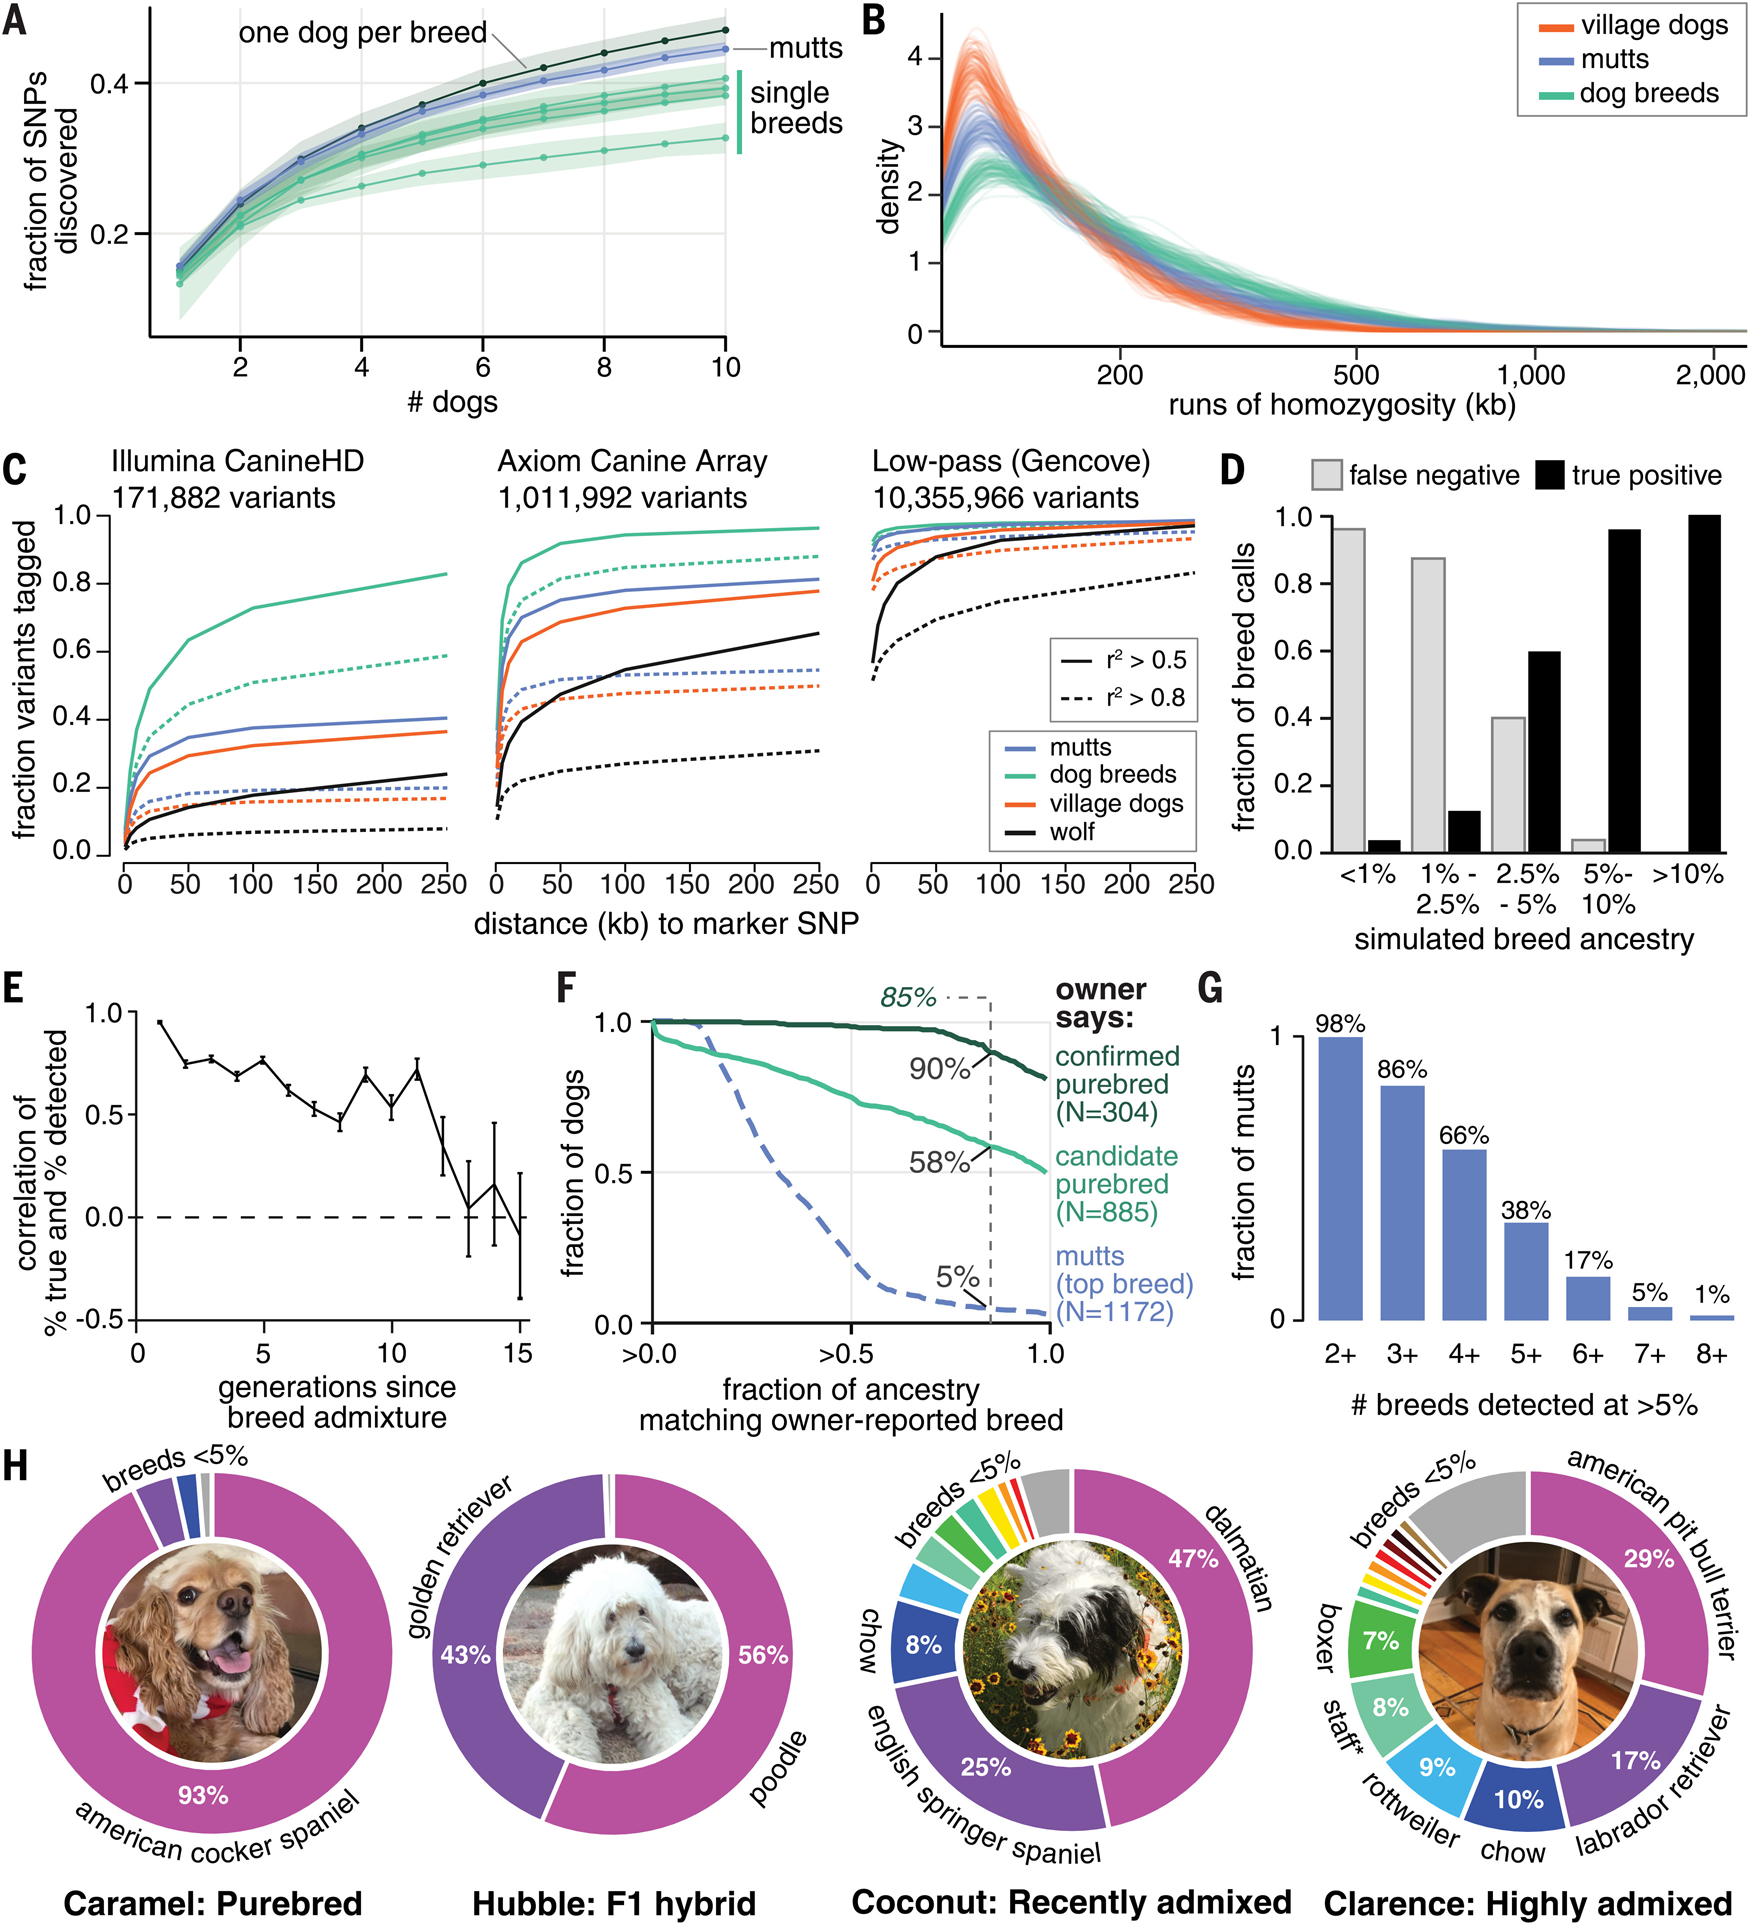
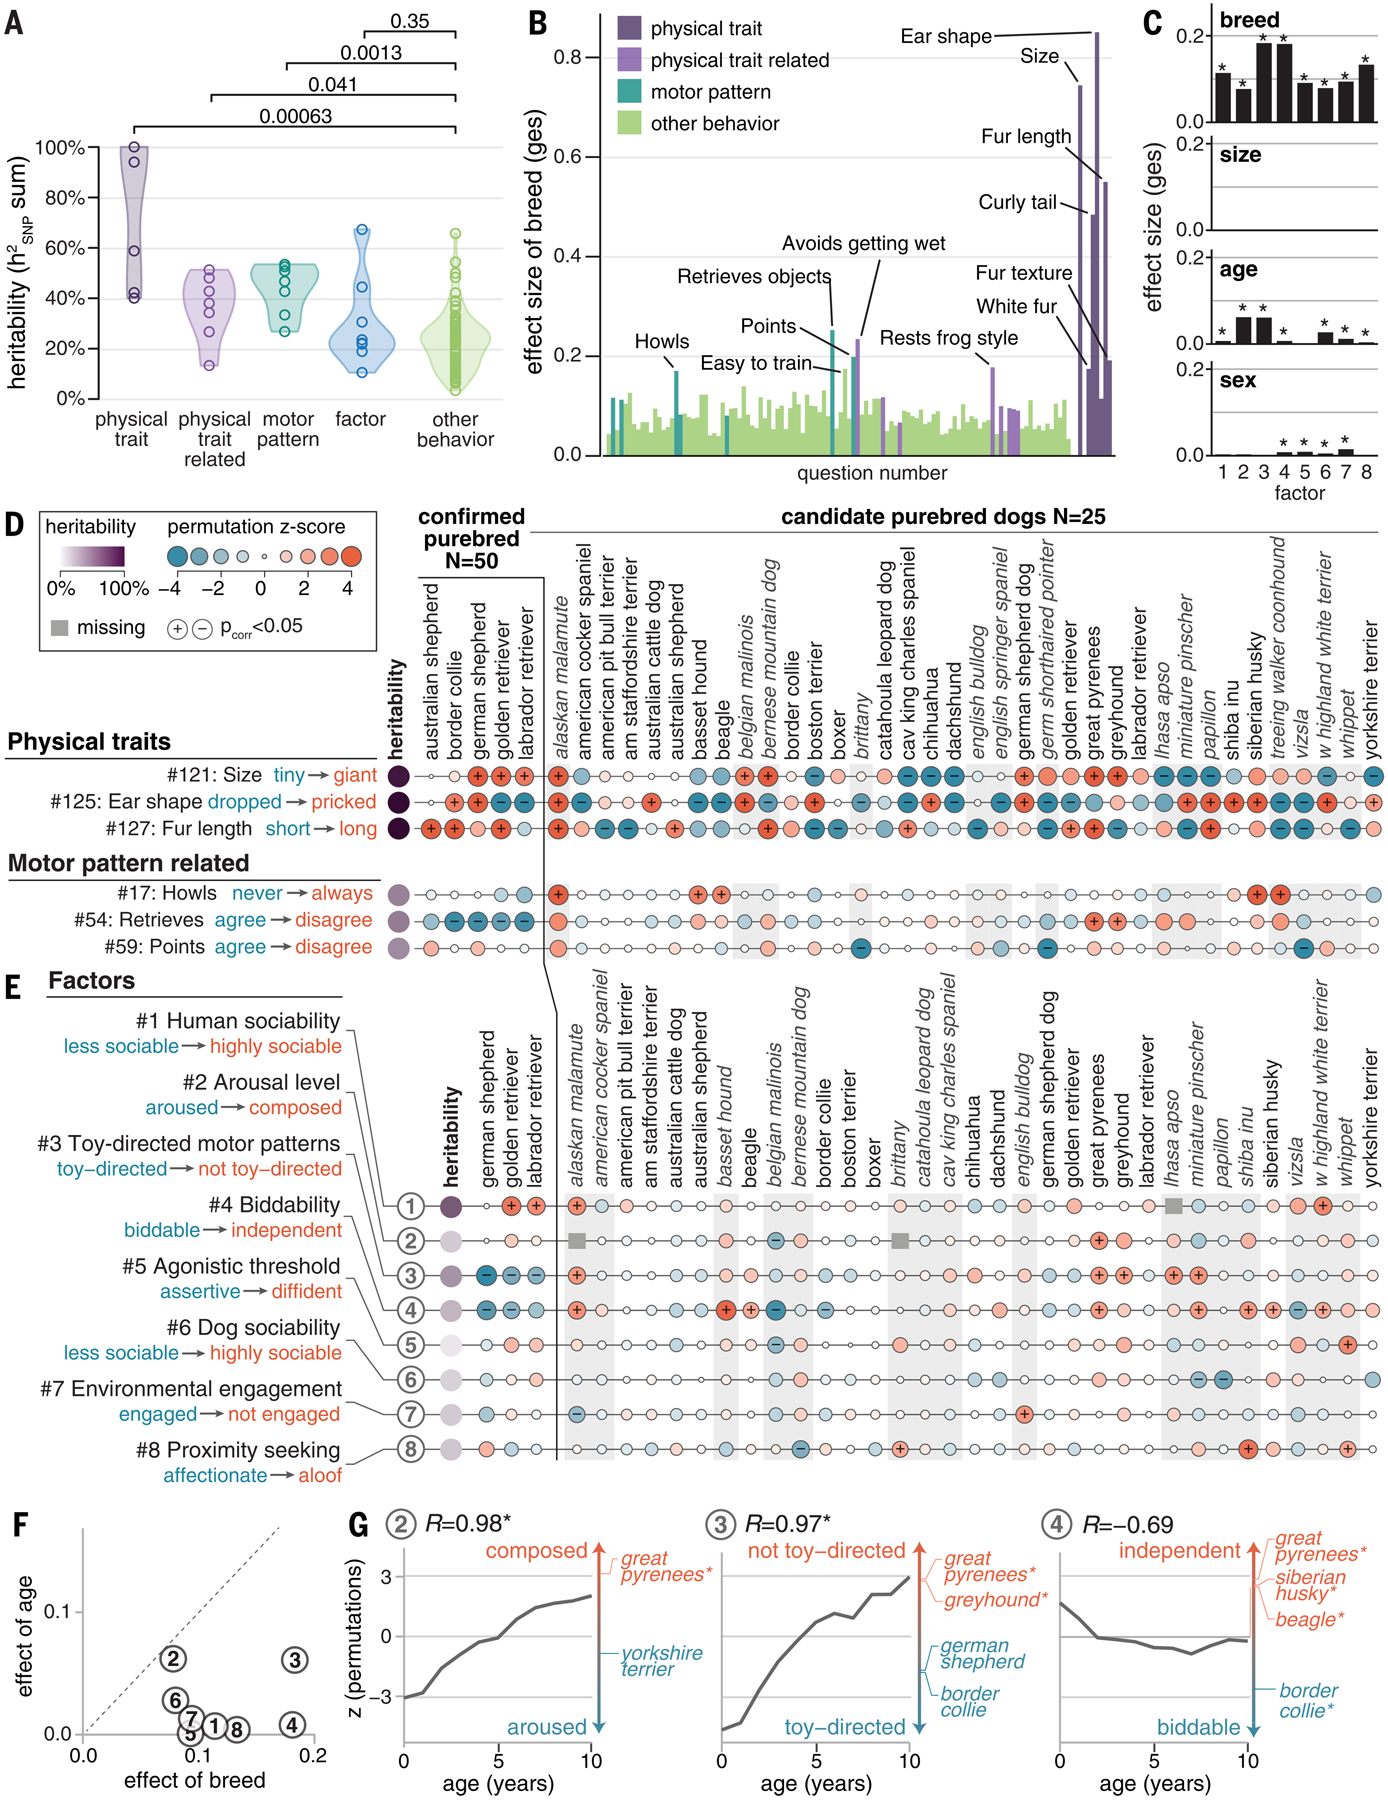
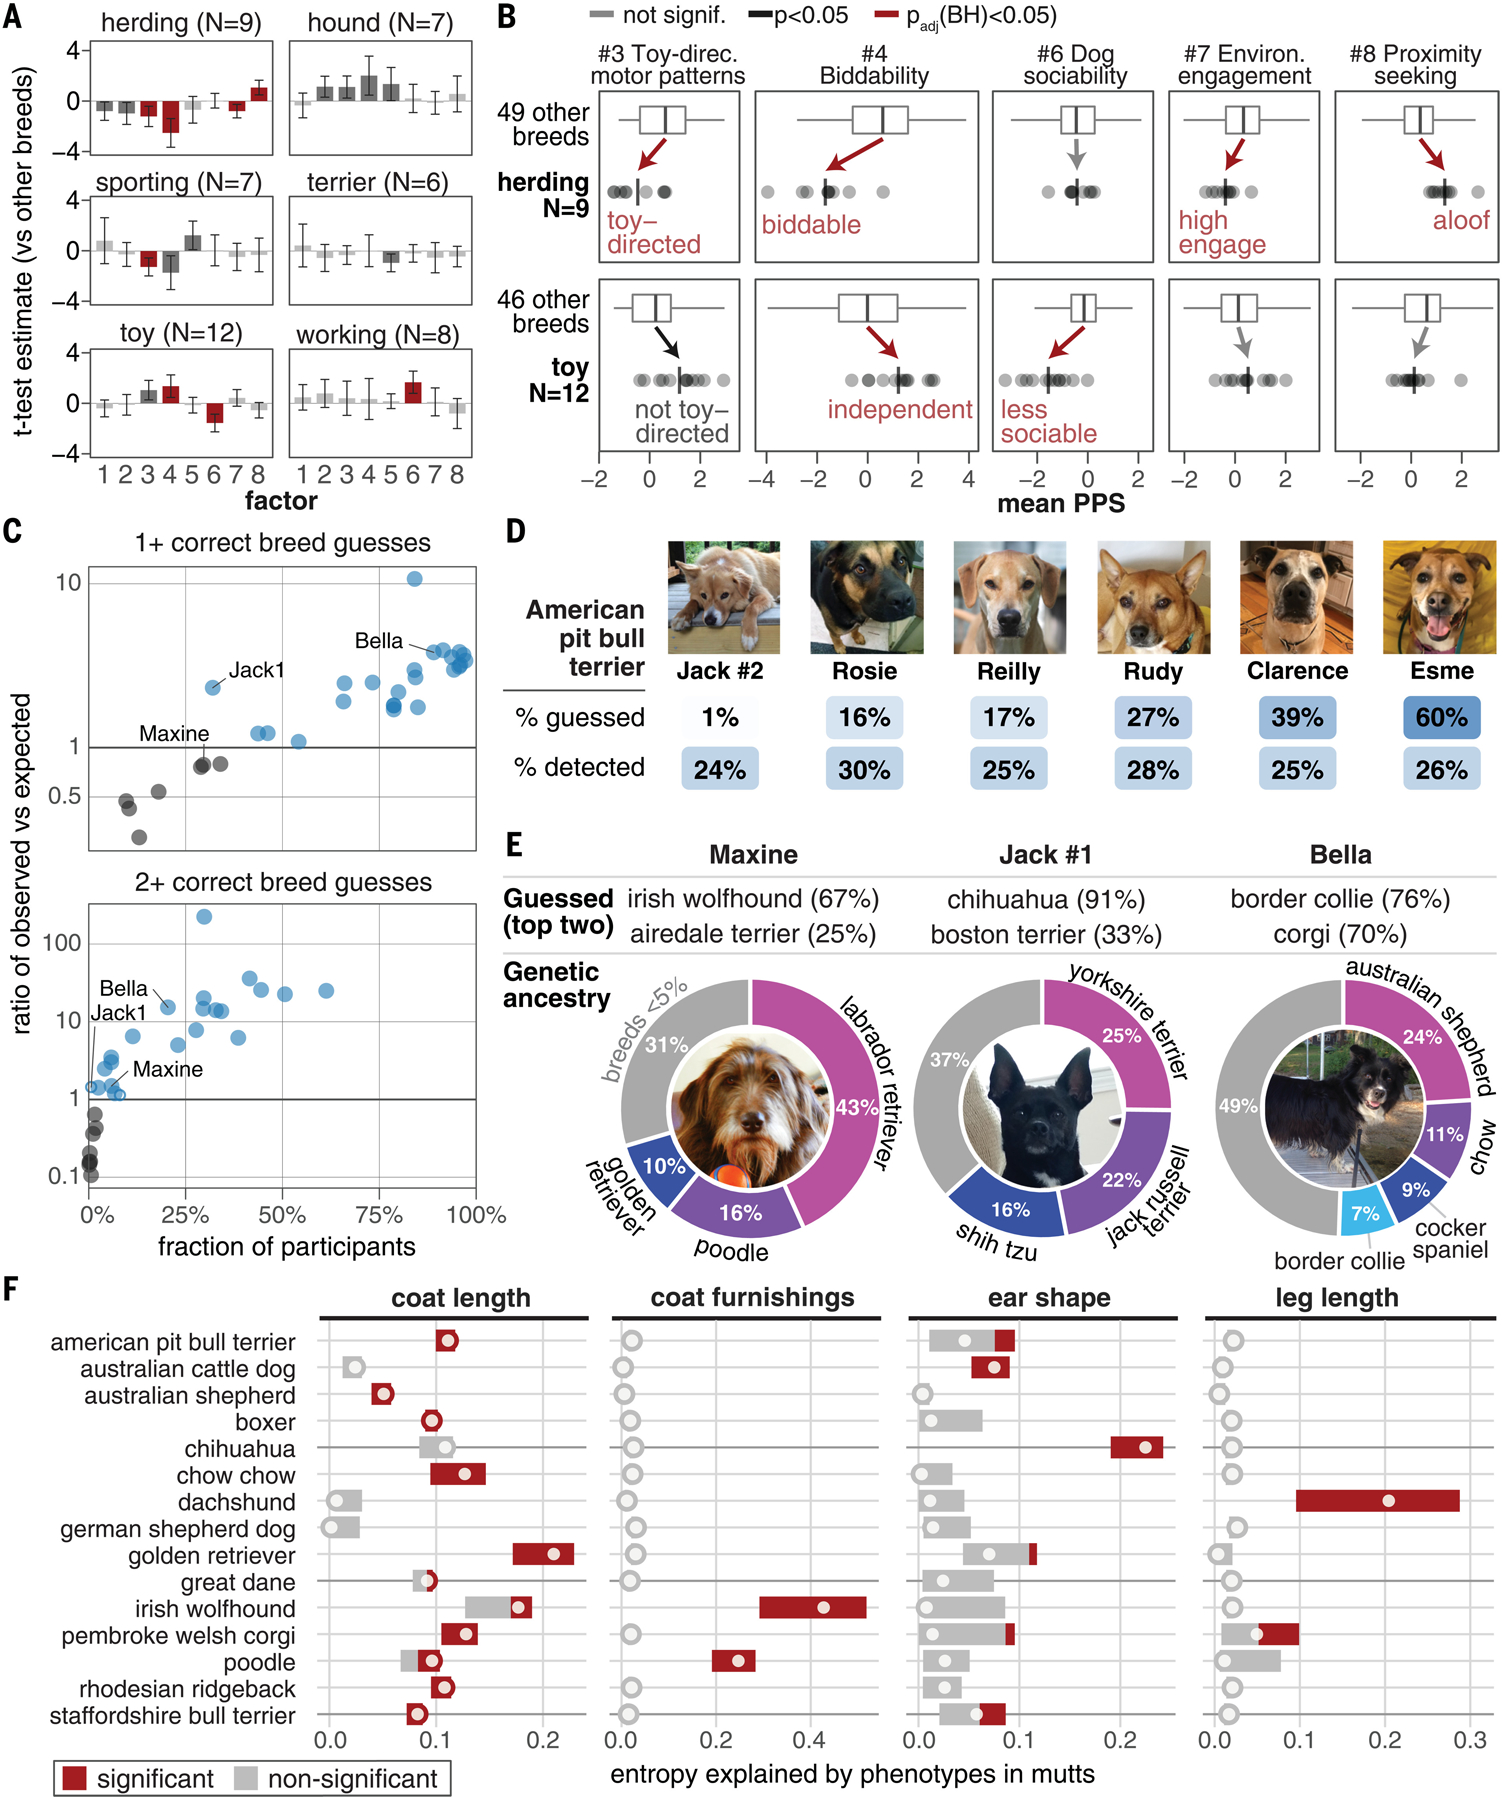
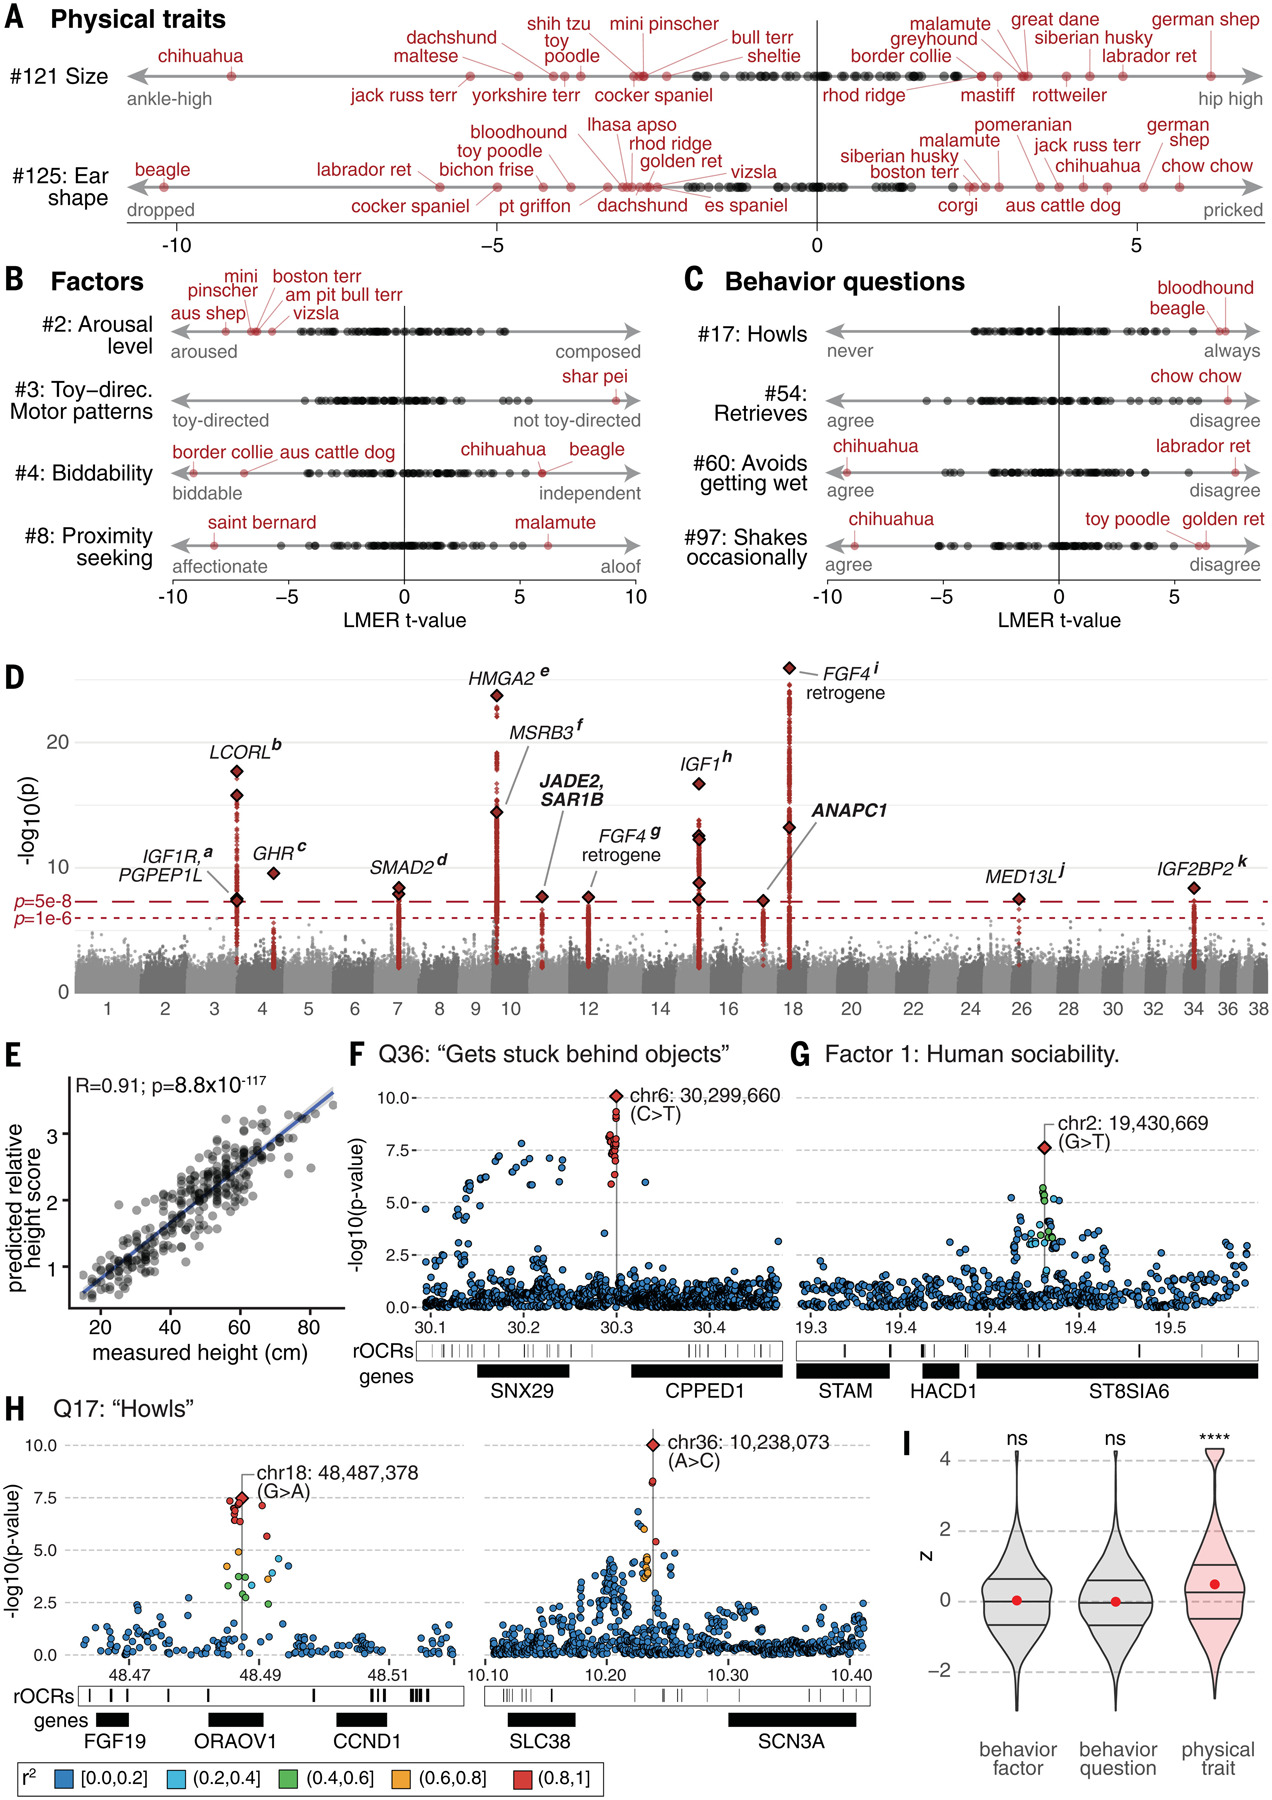
Behavioral genetics in dogs has focused on modern breeds, which are isolated subgroups with distinctive physical and, purportedly, behavioral characteristics. We interrogated breed stereotypes by surveying owners of 18,385 purebred and mixed-breed dogs and genotyping 2155 dogs. Most behavioral traits are heritable [heritability (h2) > 25%], and admixture patterns in mixed-breed dogs reveal breed propensities. Breed explains just 9% of behavioral variation in individuals. Genome-wide association analyses identify 11 loci that are significantly associated with behavior, and characteristic breed behaviors exhibit genetic complexity. Behavioral loci are not unusually differentiated in breeds, but breed propensities align, albeit weakly, with ancestral function. We propose that behaviors perceived as characteristic of modern breeds derive from thousands of years of polygenic adaptation that predates breed formation, with modern breeds distinguished primarily by aesthetic traits.


Conflict of interest statement

Competing interests: L.G. is a co-founder of, equity owner in, and chief technical officer at Fauna Bio Inc. H.J.N is an employee of AbbVie Inc.

Figures

Fig. 1.
Fig. 1.. The ancestry-inclusive Darwin’s Ark project collected surveys and genetic data from a diverse cohort of dogs.
(A) Selection on behavior in dogs predates modern breeds, which have existed for ~1% of dog history (10). (B and C) Surveys include (B) 79 published behavior questions (–37) and 39 new questions about heritable, easy-to-identify traits that fall into (C) four categories that potentially vary in heritability, including physical traits (fig. S3). (D) Owner responses to the size question (fig. S2) were highly correlated with measured size in 375 dogs (Pearson correlation). Boxes and whiskers represent 25% quartile, 75% quartile, minimum, and maximum, with horizontal line at median. (E) Owners of most dogs answered >95% of questions. (F) Upset plot visualizing the dataset. Six horizontal bars show the number of dogs subsetted by information type or breed category (“subsets”). Each column is a possible intersection of subsets, with black circles indicating the inclusion of a subset and vertical bars showing the number of dogs intersecting. Four rows (“pools”) represent the dogs used in four major analyses. Plus signs denote the inclusion of an intersection, with total number of dogs (N) on the right. (G) The frequency of breeds among purebred dogs in Darwin’s Ark (left), compared with the 14 most common breed ancestries we detected in all dogs through global ancestry inference (middle). More popular breeds tended to be guessed more frequently by MuttMix participants (right).
Fig. 2.
Fig. 2.. Behavioral traits do not define breeds the way aesthetic traits like size do.
(A) Exploratory factor analysis bins behavioral questions into eight inferred factors, which correspond to latent behavioral propensities (blue, negative score; red, positive score). (B) In a series of seven analyses, we explored how behavior relates to breed in the context of size, which is a strongly breed-differentiated trait. For each column, circle size is proportional to the minimum-maximum normalized values of (i) LD-corrected h2SNP, (ii) effect size of breed in ANOVA (confirmed breed), (iii) standard deviation of PPS (candidate breeds), (iv) standard deviation of LMER t scores, (v) −log10 (minimum p) for MLMA, (vi) fraction of breeds with significant overlap (pFDR < 0.05) between PBS and GWAS, and (vii) maximum MAGMA log10(p) for 13 brain regions in GTEx (85).
Fig. 3.
Fig. 3.. Mutts have complex ancestry from many breeds.
(A) Sequencing mutts discovers new variants at nearly the same rate as sequencing a series of purebreds of different breeds and faster than sequencing multiple individuals within any one breed (green; from top down: golden retriever, Labrador retriever, Yorkshire terrier, and Leonberger). Shaded regions indicate 95% confidence intervals from random reordering within each cohort. (B) Runs of homozygosity are shorter in mutts than in purebred dogs but are slightly longer than in outbred village dogs. (C) Fraction of variants tagged (out of a random sample of 20,000 autosomal SNPs) by a marker SNP is lower for the Illumina and Axiom genotyping arrays compared with low-pass sequencing with imputation, particularly in outbred populations like mutts. (D and E) Global breed ancestry inference pipeline (assessed using simulated breed admixture) (D) calls breeds comprising >5% ancestry accurately but misses lower-frequency breeds and (E) can discern admixture occurring up to ~12 generations ago (~24 to 36 years). Error bars in (E) represent standard deviation across 10 simulations of 100 admixed genomes. (F) For dogs categorized as confirmed purebred based on owner reports, breed calling assigns >85% ancestry (vertical dashed line) to the owner-reported breed in 90% of dogs. For candidate purebred dogs, 58% meet this criterion (4.4% had no detectable ancestry from the owner-reported breed). Just 5% of dogs categorized as mutts have >85% ancestry from their most common breed (blue dashed line). (G) Most mutts have ancestry detected (>5%) from more than three breeds (1205 dogs total). (H) Examples of breed calling in four dogs with different ancestry types: Caramel, a purebred dog, who has 93% of her ancestry assigned to her owner-reported breed; Hubble, an F1 goldendoodle; Coconut, who has apparent mutt ancestry mixed with dalmatian; and Clarence, a mutt with <45% ancestry from any one breed (*Staffordshire bull terrier). [Photo credits: M. Movassagh (Caramel); J. Luban (Hubble); A. Pensarosa (Coconut); R. Skloot (Clarence)]
Fig. 4.
Fig. 4.. Breed and age (and not size) have subtle effects on the behavior traits surveyed.
(A) LD-corrected SNP-based heritability is much higher for physical traits, and somewhat higher for motor patterns, compared with other behavioral traits (significance measured using Student’s t test; Benjamini-Hochberg (BH)–adjusted p value is shown). Shaded regions indicate the probability density. (B and C) ANOVA in confirmed purebred dogs shows that (B) the effect size of breed exceeds 15% for 6/7 physical traits and some behavioral questions (labeled bars) and that (C) for factors, breed explains more variation in scores than age and sex, and size has no significant effects. In (C), asterisks indicate statistical significance (BH-adjusted p < 0.05). (D and E) Permutations comparing breeds to randomly sampled dogs show that (D) many breeds are significantly differentiated on physical traits but that differentiation is much rarer for behavioral traits, including intrinsic motor patterns and (E) the eight behavioral factors. The selection of the most popular and/or most differentiated breeds is shown, with full results in fig. S12. Breeds in italics are represented by fewer than 50 individuals and skew toward more extreme z-scores (gray background; difference in mean score = 0.29; pt-test = 2 × 10−71). (F) The effect of age, compared with the effect of breed, in the ANOVA shows that age explains nearly as much variance as breed for factor 2. (G) The PPS for arousal level and toy-directed motor patterns are significantly correlated with age, whereas biddability is more breed driven. Asterisks indicate significant results.
Fig. 5.
Fig. 5.. Breed stereotypes can be assessed in mutts, where environmental effects (e.g., owner perception) are mitigated by the difficulty of accurately discerning the breed.
(A) Breeds grouped by purported historic working roles are more differentiated (measured by mean PPS) on some factors than other breeds (58 breeds total), measured as a t statistic using Student’s t test. Error bars represent 95% confidence intervals. (B) Toy and herding breeds illustrate groups with shifts in opposite directions (full results in fig. S18). Points are PPS for breed, vertical lines are mean PPS for group, boxes enclose the 25 to 75% quartiles, and horizontal lines extend from 1.5 times the interquartile range (IQR) below the 25% quartile to 1.5 times the IQR above the 75% quartile. Arrows indicate the direction of change in means, and words show the favored behavioral propensity. Herding breeds are Australian cattle dog, Australian shepherd, Belgian malinois, border collie, Catahoula leopard dog, collie, German shepherd dog, Pembroke Welsh corgi, and Shetland sheepdog. Toy breeds are bichon frise, Cavalier King Charles spaniel, Chihuahua, Havanese, Maltese, miniature pinscher, papillon, Pomeranian, pug, shih tzu, toy poodle, and Yorkshire terrier. (C) For each dog in the MuttMix survey, the ratio of observed:expected correct guesses for (i) one or more or (ii) two or more of the highest-content breed ancestries (blue indicates a ratio >1; open circles are not significant). (D) For six dogs that have a similar amount of genetic ancestry detected from American pit bull terrier (~25 to 30%), participants guessed this breed at rates ranging from 1 to 60%. [Photo credits: J. O’Donnell (Jack); T. Fortier (Rosie); A. Phelps (Reilly); L. Moses (Rudy); R. Skloot (Clarence); M. Bishop (Esme)] (E) For three individual mutts, the most guessed breeds (top) differ from the genetically inferred breed ancestry (bottom). [Photo credits: E. Winchester (Maxine); R. Bacon (Jack); E. Stackpole (Bella)] (F) The dogs in (E) illustrate how a mutt’s physical characteristics influence participant breed guesses. Points show entropy explained by traits using guesses for all mutts (22), and bars span values from a leave-one-out analysis (full results in fig. S18). For example, 67% of participants likely guessed Irish wolfhound for Maxine because of her coat furnishings.
Fig. 6.
Fig. 6.. Genetics of aesthetic and behavioral traits in dogs and influence of breed ancestry in mutts.
(A to C) In highly admixed dogs with no breed ancestry over 45%, the fixed effects of breed ancestry on (A) physical traits, (B) behavioral factor scores, and (C) individual behavioral question scores are shown. (D) Manhattan plot for the GWAS of surveyed height (Q121) from 1951 dogs, including covariates for age and sex. Linkage blocks (r2 > 0.2) associated (p < 5 × 10⁻⁸) with stature align with previous associations for body size in (a) IGF1R (68), (b) LCORL (40), (c) GHR (69), (d) SMAD2 (84), (e) HMGA2 (69) and the nearby (f) MSRB3, (g) a chromosome 12 retrogene insertion of FGF4 (70), (h) IGF1 (–66), (i) another FGF4 retrogene on chromosome 18 (67), (j) MED13L (40), and (k) IGF2BP2 (40). Two previously unknown associations were found spanning JADE2 and SAR1B, and in ANAPC1. (E) Random forest models based on size-associated SNPs (p < 1 × 10⁻⁵) accurately predict body size and correlate strongly (N = 310 dogs; Rpearson = 0.91, p = 8.8 × 10−117, t = 37.451, df = 308) with real measurements in those dogs. (F to H) Regional association plots for (F) scores on Q36 “gets stuck behind objects,” (G) human sociability, and (H) frequency of howling from Q17. In addition to protein coding genes (black boxes), we also show representative open chromatin regions (rOCRs; narrow vertical lines). We annotated rOCRs genome-wide using ENCODE methods (101) applied to canine ATAC-seq (assay for transposase-accessible chromatin using sequencing) data from 14 tissues (102) and mammalian sequence constraint (103). (I) Breeds show high genetic differentiation, measured as the population branch statistic, overlapping physical trait associated loci compared with ~100,000 randomly permuted regions (N = 1232, mean z = 0.49, p = 7.3 × 10⁻³³). Regions associated with behavioral factors (N = 512, mean z = 0.03, p = 0.224) and question scores (N = 9317, mean z = 0.00, p = 0.603) do not show such differentiation in breeds. Red circles indicate mean, with horizontal lines at the 25% quartile, median, and 75% quartile. The shaded area is the probability density, with significant differentiation in red. ns, not significant; ****p < 0.0001 (Student’s t test).

References

    1. Lindblad-Toh K et al., Genome sequence, comparative analysis and haplotype structure of the domestic dog. Nature 438, 803–819 (2005). doi: 10.1038/nature04338 - DOI - PubMed
    1. Bergström A et al., Origins and genetic legacy of prehistoric dogs. Science 370, 557–564 (2020). doi: 10.1126/science.aba9572 - DOI - PMC - PubMed
    1. Lord K, Feinstein M, Smith B, Coppinger R, Variation in reproductive traits of members of the genus Canis with special attention to the domestic dog (Canis familiaris). Behav. Processes 92, 131–142 (2013). doi: 10.1016/j.beproc.2012.10.009 - DOI - PubMed
    1. Hansen Wheat C, van der Bijl W, Temrin H, Dogs, but not wolves, lose their sensitivity toward novelty with age. Front. Psychol 10, 2001 (2019). doi: 10.3389/fpsyg.2019.02001 - DOI - PMC - PubMed
    1. Moretti L, Hentrup M, Kotrschal K, Range F, The influence of relationships on neophobia and exploration in wolves and dogs. Anim. Behav 107, 159–173 (2015). doi: 10.1016/j.anbehav.2015.06.008 - DOI - PMC - PubMed