. 2022 Apr 29;376(6592):483-491.
doi: 10.1126/science.abn2479. Epub 2022 Apr 28.

Molecular and neural basis of pleasant touch sensation

Affiliations

Molecular and neural basis of pleasant touch sensation

Benlong Liu et al. Science. .

Abstract

Pleasant touch provides emotional and psychological support that helps mitigate social isolation and stress. However, the underlying mechanisms remain poorly understood. Using a pleasant touch-conditioned place preference (PT-CPP) test, we show that genetic ablation of spinal excitatory interneurons expressing prokineticin receptor 2 (PROKR2), or its ligand PROK2 in sensory neurons, abolishes PT-CPP without impairing pain and itch behaviors in mice. Mutant mice display profound impairments in stress response and prosocial behaviors. Moreover, PROKR2 neurons respond most vigorously to gentle stroking and encode reward value. Collectively, we identify PROK2 as a long-sought neuropeptide that encodes and transmits pleasant touch to spinal PROKR2 neurons. These findings may have important implications for elucidating mechanisms by which pleasant touch deprivation contributes to social avoidance behavior and mental disorders.


Figures

Fig. 1.
Fig. 1.. PROKR2 neurons are a unique population of spinal excitatory interneurons.
(A to E) Double staining of GFP with PKCγ at three levels of the spinal cord (A); GFP with various markers in the lumbar cord (B), (C). Arrows: double-labeled cells. Arrowheads: GFP only. n = 3. Scale bar, 100 μm for (A), (C), 20 μm for (B). (D), Quantification of (C), percentage of Prokr2GFP cells in lamina II (green) and lamina I (blue). (E), Quantification of (B), (C). Red in (E): percentage of double-labeled cells of Prokr2GFP cells; blue: GFP only. (F) Schematic of intraspinal injection of virus AAV5-Ef1a-DIO-EGFP-2a-TK-WPRE-pA (TK-GFP) and HSV-dTK-LSL-tdTomato (HSV-dTK-Tdtomato) in the dorsal horn of Prokr2Cre mice at the lumbar level (left); Image showing virus expression in a starter neuron (yellow) expressing GFP and Tdtomato (right). Scale bar, 20 μm. (G) Double staining of Gpr83 or NK1R anterogradely labeled with Tdtomato. (H) Quantification of (G), n = 3. Scale bar, 20 μm. (I to K) Schematic of the whole-cell patch-clamp recording of Prokr2GFP neurons in the spinal cord slice preparations (I), a representative trace of initial firing pattern (red) and single spike firing pattern (blue) at 20 pA (rheobase or Rb) and 40 pA (2-fold rheobase or 2 × Rb) (J) and proportions of different types of firing pattern (K). n = 66 neurons. (L to N) Schematic of the recording of the type of inputs onto Prokr2GFP neurons with dorsal root stimulation (L), representative traces of different types of inputs (M) and their proportions (N). n = 41 neurons. All data are presented as mean ± s.e.m.
Fig. 2.
Fig. 2.. PROKR2 neurons are dispensable for acute pain and itch transmission.
(A) Schematic of intraspinal injection of Cre-dependent AAV virus expressing YFP. (B and C) Double staining of YFP and Prokr2 (Arrow: a double-stained cell) in the lumbar cord (B) and percentage of overlapping cells (C). Scale bar, 50 μm (left), 5 μm (right). (D) Strategy for intersectional genetic ablation of spinal Prokr2Cre neurons. Prokr2Cre mice were mated with Lbx1Flpo, Tauds-DTR, Prokr2GFP lines to generate diphtheria toxin receptor (DTR)-expressing Prokr2 neurons by injection of diphtheria toxin (50 μg/kg, i.p). (E and F) Images of Prokr2GFP neurons in WT and ABL mice (E) and quantification of Prokr2GFP neurons of (E) (F). Scale bar, 150 μm. (G to L) Comparable latencies in hot plate (G), Hargreaves (H), cold plate (I) tests, withdraw threshold in von Frey test (J), licking/flinching time induced by capsaicin (2 g, i.pl.) (K) and scratching numbers induced by chloroquine (200 μg, i.d.) (L) between WT and ABL mice. i.pl., intraplantar injection. i.p., intraperitoneal injection, i.d., intradermal injection. WT, wild-type; ABL, mice with ablation of spinal Prokr2 neurons; n = 3 for (F), n = 8~9 for (G to L); unpaired t-test in (F), (G to I); ***P < 0.001. n.s. – not significant. Error bars indicate s.e.m.
Fig. 3.
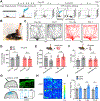
Fig. 3.. PROKR2 neurons transmit pleasant touch sensation.
(A) A schematic diagram of the experimental procedure for PT-CPP. (B) Photo of a mouse being stroked with a soft brush. (C and D) Representative trajectory plot (C) and time spent (D) in stroking-paired chamber for WT and ABL mice in the pre-conditioning baseline (Pre-c BL) and preference test (Pref T). Pre-c BL versus Pref T, P < 0.01 for WT and P = 0.6822 for ABL mice. (E and F) Heart rate (E) and thermal pain threshold (F) in the baseline and post-stroking test. Heart rate, BL versus post-stroking, P < 0.01 for WT and P = 0.1563 for ABL mice; hot plate, BL versus post-stroking, P < 0.001 for WT and P = 0.5206 for ABL mice. (G) Schematic of intraspinal injection of Cre-dependent AAV virus expressing ChR2-eYFP or eYFP (top, left) and image showing ChR2-eYFP in the cervical cord (top, right). Schematic of real-time place preference test (RTPP) (bottom). Scale bar, 50 μm. (H and I) Representative heat map (5 Hz) (H) and the percentage of time spent (I) in the chamber paired with the laser in the RTPP test. n = 9 for (D to F), n = 6 for (I); two-way repeated measures ANOVA followed by Bonferroni's multiple comparisons test in (D), (E), (F), two-way ANOVA followed by Bonferroni's multiple comparisons test in (I); **P < 0.01, ***P < 0.001. n.s. – not significant. Error bars indicate s.e.m.
Fig. 4.
Fig. 4.. PROKR2 neurons display characteristic features in response to gentle stroking.
(A) Left, dorsal view of an anesthetized Prokr2Cre;Ai32 mouse showing the position of optical fiber and electrode implanted in the lumbar spinal cord. Right, cross-section view of the lumbar spinal cord showing optogenetic tagging of Prokr2ChR2 neurons in lamina II with blue lights on. (B) Example response of a PROKR2-expressing neuron to blue light activation. Left, spike raster showing multiple trials of laser stimulation at 1 Hz. Right, the firing rate of one opto-tagged neuron within 10 ms light pulses. Inset, waveform on expanded time scale. Blue bar, light pulse. (C to E) Schematic of brush stroking across the receptive field (C), representative traces (top) and corresponding peristimulus time histogram (PSTH, 1s bin) (bottom) (D), and firing rate (E) of Prokr2ChR2 neurons in response to a soft brush stroking moving at different speeds (slow, 2~3 cm/s; medium, 18~22 cm/s; fast, 37~45 cm/s) cross the receptive filed of hindlimb hairy skin. Dots represent spike rate of a single trial from individual neurons (E). (F to H) Schematic of brush stroking in different directions ((F), L-R: from left to right; R-C: from rostral to caudal), representative traces (top), corresponding PSTH (1s bin, bottom) (G) and firing rate (H) of spinal Prokr2ChR2 neurons in response to stroking in different directions. Brush stroking was applied across the receptive field of the hindlimb in different directions at a speed of 18~22 cm/s. (I and J) Representative trace (top), corresponding PSTH (1s bin, bottom) (I) and firing rate (J) of spinal Prokr2ChR2 neurons in response to 10 repeated brush stroking stimuli with intervals of 2 s. Inset, superimposed waveforms on expanded time scale representing spikes of Prokr2ChR2 neurons evoked by stroking in (D), (G), (I). n = 8~10 neurons from 3~4 mice; one-way repeated measures ANOVA followed by Bonferroni post hoc in (E), (J), paired t-test in (H); *P < 0.05, **P < 0.01, ***P < 0.001. n.s. – not significant. Error bars indicate s.e.m.
Fig. 5.
Fig. 5.. Conditional deletion of Prok2 in sensory neurons abolishes pleasant touch sensation.
(A) Double staining of Prok2 with various markers in DRG neurons. Arrows: double-stained cells; arrowheads: Prok2 cells only. TH, tyrosine hydroxylase. (B) Overlapping percentages of (A). Grey: double-stained ratio; blue: Prok2 only. Scale bar, 20 μm. (C) Left, schematic of targeting strategy for generating Prok2 floxed (Prok2f/f) mice which were mated with Nav1.8Cre mice to generate Prok2f/f;Nav1.8Cre mice or Prok2 CKO mice. Right, Gel electrophoresis of genotyping PCR from Prok2f/f, wt/wt and Prok2f/wt samples. (D) Expression of Prok2 in DRGs of the control (Prok2f/f, WT) and Prok2 CKO mice (Prok2f/f;Nav1.8Cre, CKO). (E) Quantification of (D). Scale bar, 20 μm. (F) A schematic of the experimental procedure. Parallel symbols indicate that PT-CPP, heart rate and hot plate tests were performed independently following single housing and homecage stroking. (G and H) Representative trajectory plot (G) and time spent (H) in stroking-paired chamber for WT and CKO mice in the pre-conditioning baseline (Pre-c BL) and preference test (Pref T). Pre-c BL versus Pref T, P < 0.01 for WT and P = 0.9552 for CKO mice. (I and J) Heart rate test (I) and hot plate test (J) in WT and CKO mice. Heart rate, BL versus post-stroking, P < 0.01 for WT and P = 0.8737 for CKO mice; hot plate, BL versus post-stroking, P < 0.01 for WT and P = 0.1531 for CKO mice. (K to O) Comparable latencies in Hargreaves test (K), cold plate test (L), withdraw threshold in von Frey test (M), licking/flinching time induced by capsaicin (2 g, i.pl.) (N) and scratching numbers induced by Chloroquine injection (200 μg, i.d.) (O) between WT and CKO mice. WT, wild-type; CKO, Prok2 CKO mice. n = 3 for e, n = 8 for (H) to (O); unpaired t-test in (E), (K)-(O), two-way repeated measures ANOVA followed by Bonferroni's multiple comparisons test in (H), (I), (J); **P < 0.01, ***P < 0.001. n.s. – not significant. Error bars indicate s.e.m.
Fig. 6.
Fig. 6.. Profound impairments of PROR2/PROKR2 mutant mice in stress response and prosocial behaviors.
(A to C) Stress and anxiety-like behavioral tests. The percentage of time spent in the center zone of the open field apparatus (A), light illuminated chamber of the light-dark box (B) and the open quadrants of the elevated zero maze (C). WT versus ABL, P = 0.2795 (A); P = 0.3514 (B); P = 0.4312 (C). WT versus CKO, P < 0.05 (A); P < 0.001 (B); P < 0.01 (C). (D) The three-chamber social novelty test. The preference index for the percentage of time spent exploring the chamber with a novel mouse versus a familiar mouse (left). Right, representative heat maps of locomotor activity in the chambers. WT versus ABL, P < 0.05; WT versus CKO, P < 0.01. (E-G) The homecage social grooming test. Cartoons showing mouse allogrooming in the homecage (E). (F and G) Allogrooming time for each pair. Groomer-groomee (F), WT-WT pair versus WT-ABL pair, *P < 0.05; WT-WT pair versus ABL-WT pair, ***P < 0.001. Groomer-groomee (G), WT-WT pair versus WT-CKO pair, ***P < 0.001; WT-WT pair versus CKO-WT pair, ***P < 0.001. n = 8 for (A to D), (G), n = 10~11 for (F); unpaired t-test in (A to D), one-way ANOVA followed by Bonferroni post hoc in (F), (G); *P < 0.05, **P < 0.01, ***P < 0.001. n.s. – not significant. Error bars indicate s.e.m.

Comment in

References

    1. McGlone F, Wessberg J, Olausson H, Discriminative and affective touch: sensing and feeling. Neuron 82, 737–755 (2014). - PubMed
    1. Abraira VE, Ginty DD, The sensory neurons of touch. Neuron 79, 618–639 (2013). - PMC - PubMed
    1. Morrison I, Loken LS, Olausson H, The skin as a social organ. Experimental Brain Research 204, 305–314 (2010). - PubMed
    1. Montagu A, Touching: The Human Significance of the Skin. (HarperCollins; New York, ed. 3rd ed, 1986).
    1. Harlow HF, Suomi SJ, Nature of love--simplified. Am Psychol 25, 161–168 (1970). - PubMed

Publication types