. 2022 May 3;119(18):e2118927119.
doi: 10.1073/pnas.2118927119. Epub 2022 Apr 28.

Small-world connectivity dictates collective endothelial cell signaling

Affiliations

Small-world connectivity dictates collective endothelial cell signaling

Matthew D Lee et al. Proc Natl Acad Sci U S A. .

Abstract

Every blood vessel is lined by a single layer of highly specialized, yet adaptable and multifunctional endothelial cells. These cells, the endothelium, control vascular contractility, hemostasis, and inflammation and regulate the exchange of oxygen, nutrients, and waste products between circulating blood and tissue. To control each function, the endothelium processes endlessly arriving requests from multiple sources using separate clusters of cells specialized to detect specific stimuli. A well-developed but poorly understood communication system operates between cells to integrate multiple lines of information and coordinate endothelial responses. Here, the nature of the communication network has been addressed using single-cell Ca2+ imaging across thousands of endothelial cells in intact blood vessels. Cell activities were cross-correlated and compared to a stochastic model to determine network connections. Highly correlated Ca2+ activities occurred in scattered cell clusters, and network communication links between them exhibited unexpectedly short path lengths. The number of connections between cells (degree distribution) followed a power-law relationship revealing a scale-free network topology. The path length and degree distribution revealed an endothelial network with a “small-world” configuration. The small-world configuration confers particularly dynamic endothelial properties including high signal-propagation speed, stability, and a high degree of synchronizability. Local activation of small clusters of cells revealed that the short path lengths and rapid signal transmission were achieved by shortcuts via connecting extensions to nonlocal cells. These findings reveal that the endothelial network design is effective for local and global efficiency in the interaction of the cells and rapid and robust communication between endothelial cells in order to efficiently control cardiovascular activity.

Keywords: calcium; endothelium; network; signaling; small-world.


Conflict of interest statement

The authors declare no competing interest.

Figures

Fig. 1.
Fig. 1.
Parameters of the network structure. (A) Topologies of a regular, small-world, and random network with the shortest path length between the same two nodes for each network indicated (red line). (B) Clustering coefficient for the blue node is calculated for no connections between active neighbors, one connection between active neighbors, and all three connections between active neighbors. (C) Illustration of the structural (Left) and functional network (Right) of endothelial cells. The functional network operates on the structural network with links connecting the most correlated cells. (D) Pseudo Ca2+ responses from color-matched cells indicated in C. (E) The network parameters of the pink cell are indicated. The pink signal is shown with one strongly (blue) and one weakly (gray) correlated signal. (F) Schematic representation of random and scale-free networks, with degree distribution for each node indicated. Random networks follow a Poisson degree distribution with no hubs (nodes with high degree) present. Scale-free networks have a power-law degree distribution with hubs.
Fig. 2.
Fig. 2.
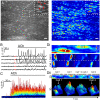
Ca2+ signaling in intact mesenteric endothelium. (A) Representative image showing ∼1,000 endothelial cells from an en face second order mesenteric artery (Left). ACh-induced (15 nM) Ca2+ activity from a 5-min recording (Right). (B) Baseline corrected Ca2+ signals (F/F0) obtained from the ROIs in (A, red dots). The highlighted section (red) on each individual Ca2+ signal indicates the software-determined baseline region. (C) Overlaid Ca2+ signals from all cells in A. The individual Ca2+ signals have been color-coded according to the amplitude of the initial rise in Ca2+; red indicates the highest amplitude and blue the lowest amplitude. (D, i) Zoomed region taken from A showing a 2D kymograph (linescan) of the Ca2+ signal intensity (color) plotted against time (x-axis) from the two cells indicated. (D, ii) A 2D and 3D surface plot showing signal propagation between the two cells highlighted in B, i. Scale bars, 50 µm.
Fig. 3.
Fig. 3.
Network analysis of ACh- and histamine-evoked Ca2+ responses in the endothelium. Scatterplots of cross-correlation coefficients were plotted as a function of intercellular distance for experimental (Left) and random data (Middle) derived from ACh (A) and histamine-evoked (B) Ca2+ responses in the intact endothelium. Agonists were applied for 30 min, and the first 5 min of activation (in which an initial synchronized burst of activity occurred) was excluded from the analysis. The red line indicates the 99.9th percentile from the random data. (C) Network plot of cross-correlation coefficients greater than the 99.9th percentile for ACh. (D) Single-cell Ca2+ traces from two cells (ii, iii) that are strongly correlated to cell i (>99.9th percentile). (E) Cross-correlation coefficients as a function of agonist concentration for ACh (green) and histamine (red) from experimental and randomized data for data greater than 99.9th percentile. Data are representative of n = 5 independent experiments, from artery preparations, from different animals; *P < 0.05, paired Student t test. Scale bars, 50 µm.
Fig. 4.
Fig. 4.
Network analysis summary. (A) Illustration showing network parameters. (B) Probability distribution for ACh (green) and histamine (red) plotted on a log-log scale with a linear regression fit in gray. (C, D) Summary data of network parameters. Slope (γ) is a connectivity measure that provides information on network structure. Mean path length (λ), cluster coefficient (C), and small-world coefficient (σ) are also shown at four agonist concentrations for ACh (C) and histamine (D). Data are representative of n = 5 independent experiments, from artery preparations, from different animals and means ± SEM values are shown in panels C and D.
Fig. 5.
Fig. 5.
Clustering of ACh- and histamine-sensitive endothelial cells. The first 25% of responding cells to ACh (EC25) and their spatial relationships were calculated from neighbor analysis. (A) Reconstructed endothelial network (Left) showing locations of active cells (purple dots), inactive cells (green dots), and boundary cells (gray dots). Lines connect responding cells to their nearest responding neighbors (red) or nonresponding neighbors (gray). (Right) Shows the individual clusters (color) and isolated components (gray). Clusters are cells that respond with an active neighbor. (Bottom) A random model of the endothelial network shown in A. (B) Summary data illustrating the distribution of ACh- and histamine-sensitive cells across the endothelium compared to a random distribution. Degree is the average number of edges between an active cell and its active neighbors. Data are representative of n = 5 independent experiments, from artery preparations, from different animals; *P < 0.05, paired Student t test.
Fig. 6.
Fig. 6.
Ca2+ activity evoked by ACh and histamine occur in spatially discrete cells. (A) Composite endothelial Ca2+ image (second-order mesenteric artery, ∼1,000 cells) with activity evoked by the EC25 of ACh (green) and histamine (magenta) overlaid in the same field of endothelium. (B) Cellular Ca2+ signals from respective dataset shown in A. Ca2+ signals have been colored according to the magnitude of the response to ACh (red [highest] to blue [lowest]) and the color (identity) of each trace has been maintained across the histamine dataset (i.e., if a cells’ trace is colored red for ACh then it is also colored red for histamine). (C) Heatmap representation of Ca2+ signals, of the active signals, shown in B. Each line represents the Ca2+ response from a separate endothelial cell. (D) Summary data showing the percentage of the total population of cells activated at the EC25 (red) and the percentage of these same cells (active; red bar) that are activated by the other agonist (blue). Data are representative of n = 5 independent experiments, from artery preparations, from different animals; *P < 0.05 compared to EC25 response, paired Student t test. Scale bars, 50 µm.
Fig. 7.
Fig. 7.
Endothelial cell projections permit rapid signal communication. (A) Representative composite image of Ca2+ activity in an en face second-order mesenteric artery endothelium to IP3 uncaging (5 μM, 30-min incubation). The heatplot shows the time of activation post uncaging. (B) Scatterplot of distance from the uncaging site plotted against time postuncaging. Cells that respond quickly but at significant distance from the uncaging region (three times the SD of the mean distance) are shown in red. (C) A distance threshold was set as the minimum distance required for an active cell to exceed three times the SD, for each dataset (shown as a blue line in B). Histogram (Left) and summary data (Right) of propagation velocity of cells that exceeded this threshold distance and do (red)/do not (green) exceed three times the SD. (D) Intercellular propagation may be facilitated by extended endothelial cell projections. (E) Electron tomographs showing projections that extend significant lengths. Data are representative of n = 5 independent experiments, from artery preparations, from different animals; *P < 0.05 compared to EC25 response, paired Student t test. Scale bars, 50 µm.

Similar articles

Cited by

References

    1. Zuccolo E., et al. , Glutamate triggers intracellular Ca2+ oscillations and nitric oxide release by inducing NAADP- and InsP3-dependent Ca2+ release in mouse brain endothelial cells. J. Cell. Physiol. 234, 3538–3554 (2019). - PubMed
    1. Shinde A. V., et al. , STIM1 controls endothelial barrier function independently of Orai1 and Ca2+ entry. Sci. Signal. 6, ra18 (2013). - PMC - PubMed
    1. Garland C. J., et al. , Voltage-dependent Ca2+ entry into smooth muscle during contraction promotes endothelium-mediated feedback vasodilation in arterioles. Sci. Signal. 10, eaal3806 (2017). - PubMed
    1. Nausch L. W. M., et al. , Sympathetic nerve stimulation induces local endothelial Ca2+ signals to oppose vasoconstriction of mouse mesenteric arteries. Am. J. Physiol. Heart Circ. Physiol. 302, H594–H602 (2012). - PMC - PubMed
    1. Lee M. D., et al. , Spatially structured cell populations process multiple sensory signals in parallel in intact vascular endothelium. Sci. Signal. 11, eaar4411 (2018). - PMC - PubMed

Publication types

MeSH terms

LinkOut - more resources