. 2022 May 3;119(18):e2112781119.
doi: 10.1073/pnas.2112781119. Epub 2022 Apr 28.

Chronic inflammatory arthritis drives systemic changes in circadian energy metabolism

Affiliations

Chronic inflammatory arthritis drives systemic changes in circadian energy metabolism

Polly Downton et al. Proc Natl Acad Sci U S A. .

Abstract

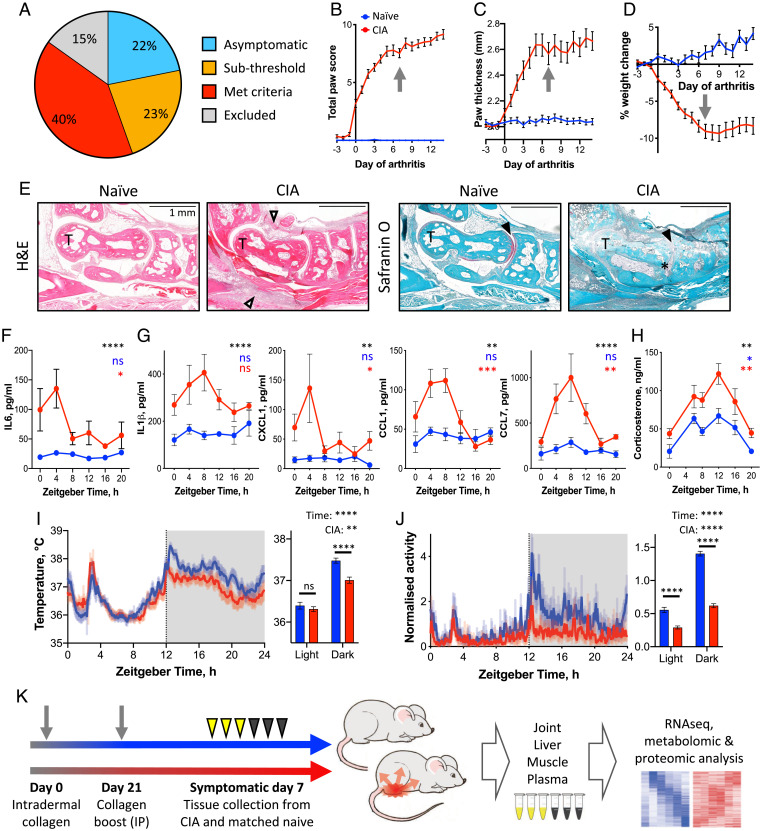
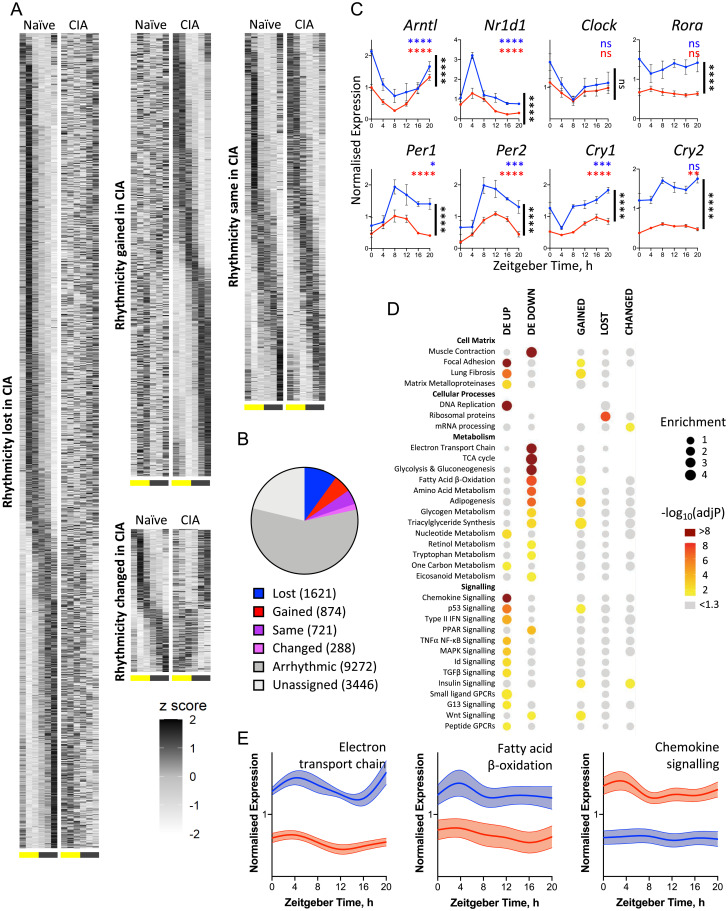
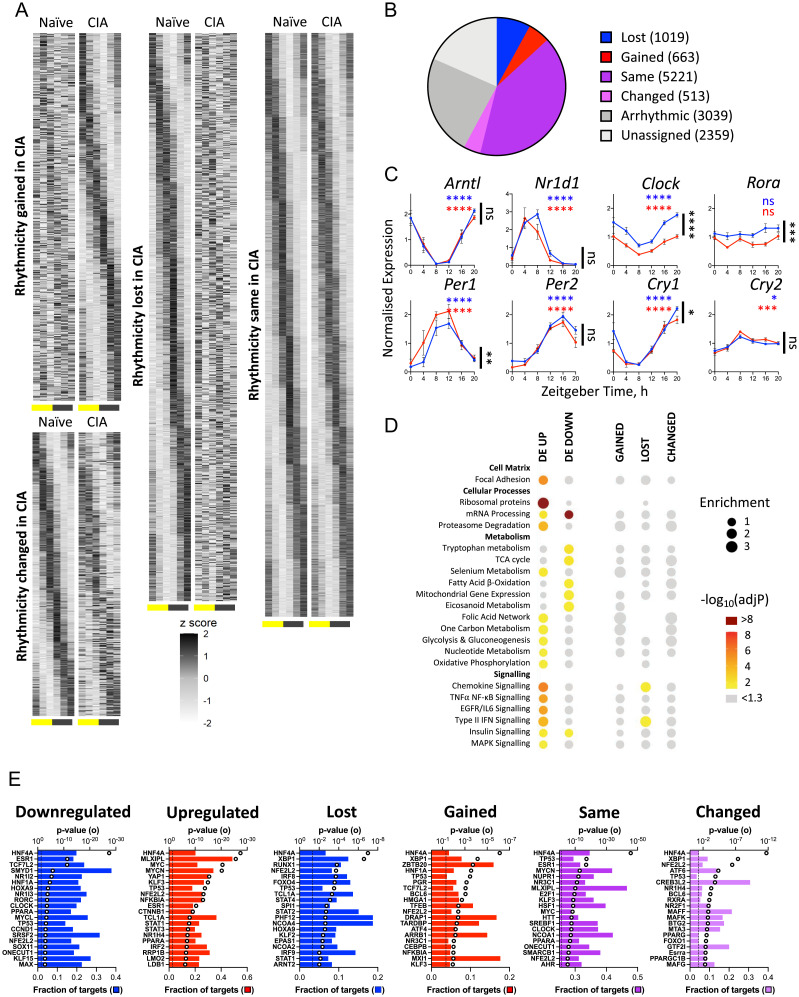
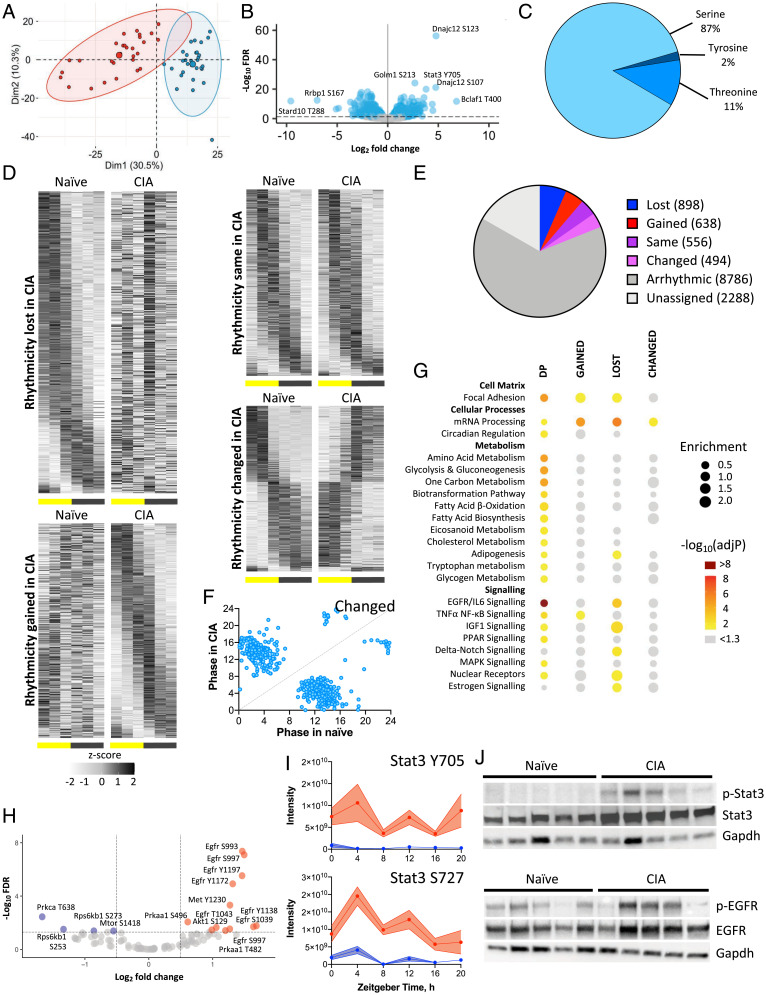
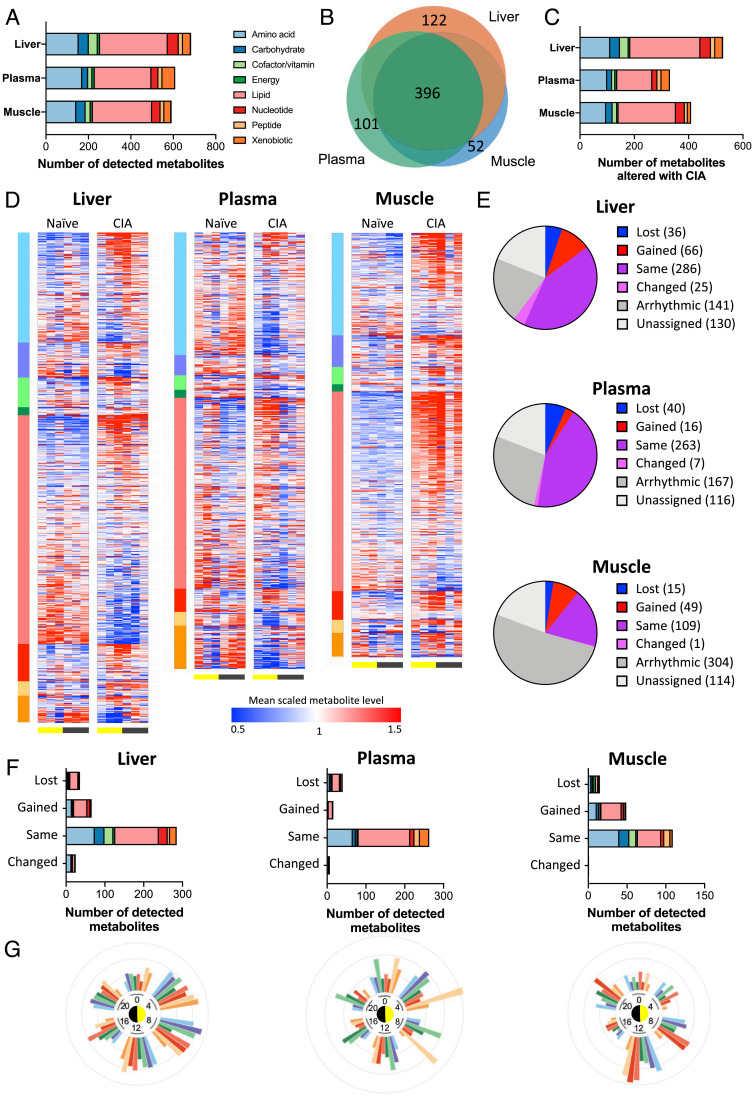
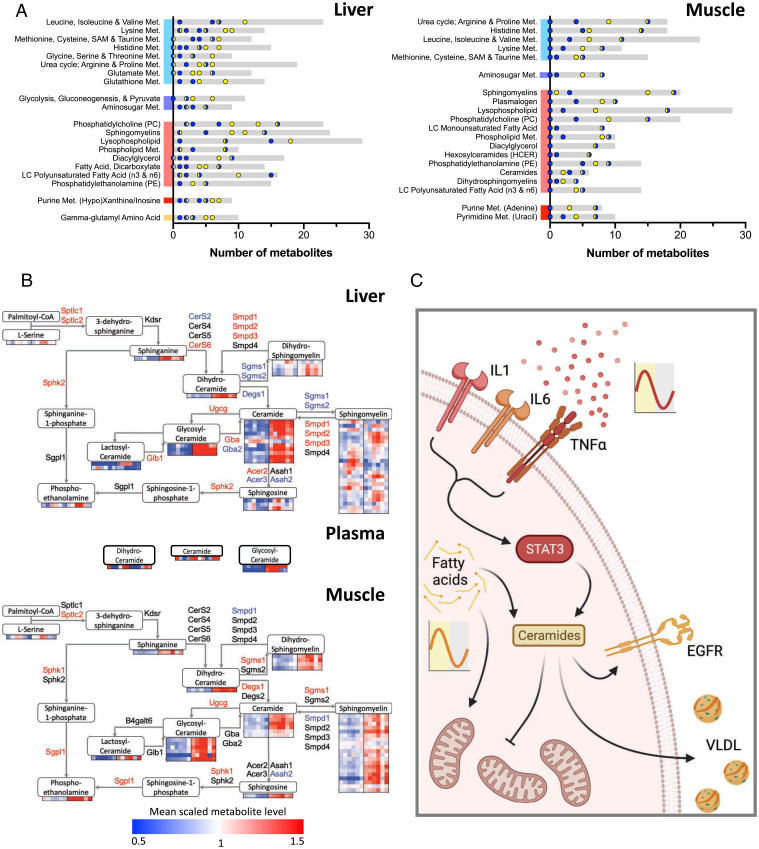
Chronic inflammation underpins many human diseases. Morbidity and mortality associated with chronic inflammation are often mediated through metabolic dysfunction. Inflammatory and metabolic processes vary through circadian time, suggesting an important temporal crosstalk between these systems. Using an established mouse model of rheumatoid arthritis, we show that chronic inflammatory arthritis results in rhythmic joint inflammation and drives major changes in muscle and liver energy metabolism and rhythmic gene expression. Transcriptional and phosphoproteomic analyses revealed alterations in lipid metabolism and mitochondrial function associated with increased EGFR-JAK-STAT3 signaling. Metabolomic analyses confirmed rhythmic metabolic rewiring with impaired β-oxidation and lipid handling and revealed a pronounced shunt toward sphingolipid and ceramide accumulation. The arthritis-related production of ceramides was most pronounced during the day, which is the time of peak inflammation and increased reliance on fatty acid oxidation. Thus, our data demonstrate that localized joint inflammation drives a time-of-day–dependent build-up of bioactive lipid species driven by rhythmic inflammation and altered EGFR-STAT signaling.

Keywords: ceramide; circadian clock; inflammation; mitochondria; rheumatoid arthritis.


Conflict of interest statement

The authors declare no competing interest.

Figures

Fig. 1.
Fig. 1.
CIA as a model of rhythmic inflammation. (A) CIA mice exhibited variation in severity of disease, and were carried forward for subsequent analyses based on selection criteria (Materials and Methods). (BD) Upon development of symptoms, paw inflammation score (B), paw thickness (C), and body weight loss (D) progressed rapidly before stabilizing at approximately 5 to 7 d after onset (n = 14 naïve mice; n = 36 CIA mice). Arrows indicate symptomatic day 7, chosen for terminal tissue collection. (E) Histological staining of paw sections around the talus (T) from naïve and CIA mice illustrates inflammatory cell infiltration (open arrowheads), loss of cartilage (filled arrowheads), and synovial hyperplasia (*). (F and G) Plasma cytokine concentrations showed elevation and rhythmicity in arthritic (red) compared with naïve mice (blue) (treatment comparison by two-way ANOVA indicated in black; adjusted P value of JTK analysis indicated in blue [naïve mice] and red [CIA mice]; n = 4–5/point). (H) Plasma corticosterone level was elevated and rhythmic in CIA mice (treatment comparison by two-way repeated-measures ANOVA in black; rhythmicity, according to Lomb-Scargle analysis, is indicated in blue (naïve mice) and red (CIA mice), n = 5–9/condition). (I and J) Body temperature (I) and activity (J) similarly showed maintained rhythmicity in CIA mice (3-d average recordings; blue, presymptomatic; red, symptomatic days 5–7). Summary statistics exclude ZT2–3.5, when the mice were handled for scoring (two-way repeated-measures ANOVA in black; n = 7–8). (K) Schematic showing experimental design. Data are presented as mean ± SEM throughout; details of statistical tests are provided in Dataset S1. *P < 0.05, **P < 0.01, ***P < 0.001, ****P < 0.0001. IP, intraperitoneal; RNAseq, RNA sequencing.
Fig. 2.
Fig. 2.
Inflamed joint tissue shows extensive changes in circadian transcriptional regulation. (A and B) Joint samples from naïve and CIA mice were collected on symptomatic day 7 at six time points and analyzed by RNA sequencing (n = 5/time point per condition). Heat maps (A) represent the normalized (z-scored) transcript expression levels in naïve (Left) and CIA (Right) mice over time (columns, from ZT0 at 4-h intervals). Differential rhythmicity analysis categorized transcript expression profiles according to change or maintenance of rhythmicity with disease (B). (C) CIA significantly altered the transcript expression of a number of core clock genes (CIA vs. naïve comparison by two-way ANOVA indicated in black; adjusted P [adjP] value of JTK analysis indicated in blue and red; n = 5/point. *P < 0.05, **P < 0.01, ***P < 0.001, ****P < 0.0001. Data are presented as mean ± SEM). (D) Groups of genes showing significant differential expression (DE) or rhythmic change with disease were analyzed for functional enrichment using the Enrichr tool (Materials and Methods) to identify altered gene expression across metabolic and signaling pathways (spot size represents fold enrichment of genes in group vs. the genome; color represents significance of enrichment; spot absence means no genes from the pathway were allocated to the group on statistical categorization). (E) Spline graphs show the mean normalized expression of all genes in selected WikiPathways gene sets (WP295, WP1269, and WP2292; error bars represent 95% CIs around the mean), demonstrating altered pathway expression in CIA mice. GPCR, G-protein-coupled receptor; ns, not significant.
Fig. 3.
Fig. 3.
The liver transcriptome shows circadian perturbation in response to arthritis. (A and B) Matched liver samples were analyzed by RNA sequencing to characterize the effect of distal inflammatory disease. The majority of genes were rhythmic under at least one condition, and genes were grouped according to change or maintenance of rhythmicity with CIA using compareRhythms (Fig. 2). (C) Rhythmic expression of most core clock genes was maintained in liver, although expression of Clock and Rora was significantly reduced with disease (CIA vs. naïve comparison by two-way ANOVA in black; adjusted P [adjP] value of JTK analysis in blue and red; n = 5/point. *P < 0.05, **P < 0.01, ***P < 0.001, ****P < 0.0001. Data are presented as mean ± SEM). (D) Groups of genes showing significant differential expression (DE) or rhythmic change with disease were analyzed using the Enrichr tool (Materials and Methods and Fig. 2). Enrichment of metabolic and signaling categories were predominantly associated with changes in expression level rather than rhythmicity. (E) Upstream regulator analysis of liver transcripts differentially expressed with CIA identified metabolic and inflammatory mediators. The top 20 most significant regulators are shown for each category. Open circle represents significance of enrichment; filled bar represents fraction of downstream targets found in the category; dashed line indicates P = 0.05. ns, not significant.
Fig. 4.
Fig. 4.
Phosphoproteomic analysis of liver identifies EGFR signaling as a potential mediator of inflammatory disease response. (AC) The phosphoproteome of the same liver samples (n = 5/time per condition) was analyzed by mass spectrometry. Principle component analysis identified disease as the largest source of variation (A; naïve mice, blue; CIA mice, red). Significantly altered phosphopeptides (B, blue), predominantly serine residues (C), were identified. (DF) Differential rhythmicity analysis using compareRhythms (D and E) highlighting a switch in predicted phase for phosphopeptides belonging to the “altered” group (F). (G) Groups of genes associated with sites of DP and/or rhythmic phosphorylation were analyzed for functional enrichment using the Enrichr tool (spot size represents fold enrichment of genes in group vs. the genome; color represents significance of enrichment; spot absence means no genes from the pathway belonged to the group), highlighting enrichment of genes involved in EGFR/IL6 signaling. (H) The KinSwingR package was used to predict kinases associated with significant (FDR < 0.05) phosphoproteome changes (increased phosphorylation with CIA indicated in red; reduced phosphorylation indicated in blue), also highlighting EGFR signaling. (I) Among predicted regulatory kinases, Stat3 showed DP. Treatment effect by two-way ANOVA. ****P < 0.0001. Error bars represent SEM. (J) Western blot analysis of phospho-Stat3, Stat3 (Top), phospho-EGFR and EGFR (Bottom) confirmed increased phosphorylation in CIA liver samples collected at ZT4. GAPDH immunoblot was used as a loading control.
Fig. 5.
Fig. 5.
The majority of detected metabolites in distal tissues are significantly altered by inflammatory disease. (A and B) Global metabolomic profiling of samples from naïve and CIA mice (n = 5/time per condition) identified overlapping metabolite profiles in liver, plasma, and muscle. Color indicates metabolite superclass of detected metabolites; scale indicates number of identified metabolites. (C) Significant numbers of detected metabolites showed differential abundance with disease (q < 0.05 on two-way ANOVA). (D) Heat maps of tissue-specific metabolite abundance (sorted by metabolite class and then fold change in detection level) represent alterations to metabolite level with disease. (E and F) The effect of distal inflammatory disease on metabolite rhythmicity was categorized using compareRhythms (E) and represented by superclass (F). (G) The proportion of metabolites showing differential detection between naïve and CIA tissue at each time point are presented on radial plots, indicating tissue- and time-specific changes in metabolite abundance with disease.
Fig. 6.
Fig. 6.
Metabolomic profiling highlights differential lipid use in liver and muscle. (A) Metabolite subpathways were sorted according to average differential detection between light (ZT4, 8, 12) and dark (ZT16, 20, 0) conditions to identify metabolic processes altered by disease and diurnal rhythm in liver (Left) and muscle (Right) (gray bars represent total detected metabolites; points represent number of differentially detected metabolites at light (yellow), dark (blue), or transition (yellow and blue) time points). (B) Integrating differential gene expression (named genes; red and blue indicate significant up- and down-regulation, respectively) and metabolite-detection profiles (heat maps) into a schematic representation of the ceramide biosynthesis pathway in liver (Top) and muscle (Bottom) highlights the accumulation of ceramides and sphingolipids with disease. (C) We propose a model in which chronic inflammatory signaling impacts rhythmic metabolism in distal tissues via the EGFR/STAT3 circuit. This results in rhythmic accumulation of fatty acid precursors, increased ceramide abundance, and deleterious effects upon mitochondrial function. Fig. 6C was created with BioRender.com. Met, metabolism.

References

    1. Dibner C., Schibler U., Albrecht U., The mammalian circadian timing system: Organization and coordination of central and peripheral clocks. Annu. Rev. Physiol. 72, 517–549 (2010). - PubMed
    1. West A. C., Bechtold D. A., The cost of circadian desynchrony: Evidence, insights and open questions. BioEssays 37, 777–788 (2015). - PMC - PubMed
    1. Bass J., Lazar M. A., Circadian time signatures of fitness and disease. Science 354, 994–999 (2016). - PubMed
    1. Takahashi J. S., Transcriptional architecture of the mammalian circadian clock. Nat. Rev. Genet. 18, 164–179 (2017). - PMC - PubMed
    1. Scheiermann C., Gibbs J., Ince L., Loudon A., Clocking in to immunity. Nat. Rev. Immunol. 18, 423–437 (2018). - PubMed

Publication types