

Improving small animal cone beam CT resolution by mitigating x-ray focal spot induced blurring via deconvolution
- PMID: 35483338
- PMCID: PMC9225679
- DOI: 10.1088/1361-6560/ac6b7a
Improving small animal cone beam CT resolution by mitigating x-ray focal spot induced blurring via deconvolution
Abstract
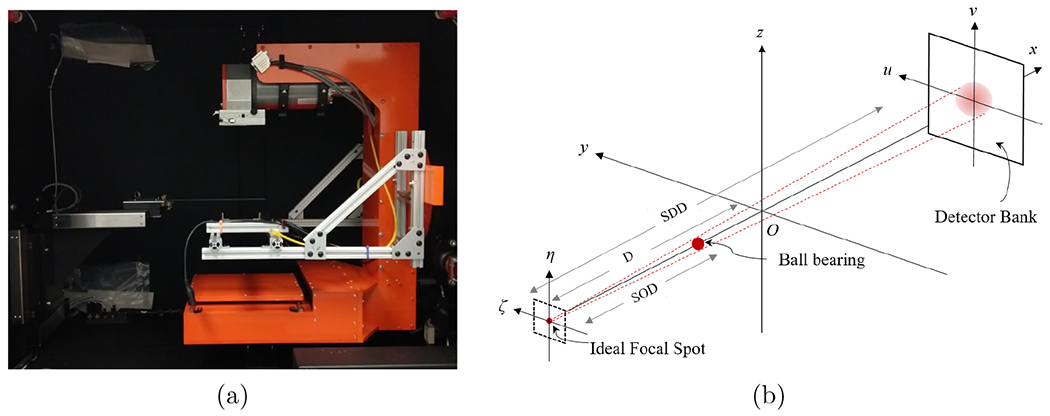
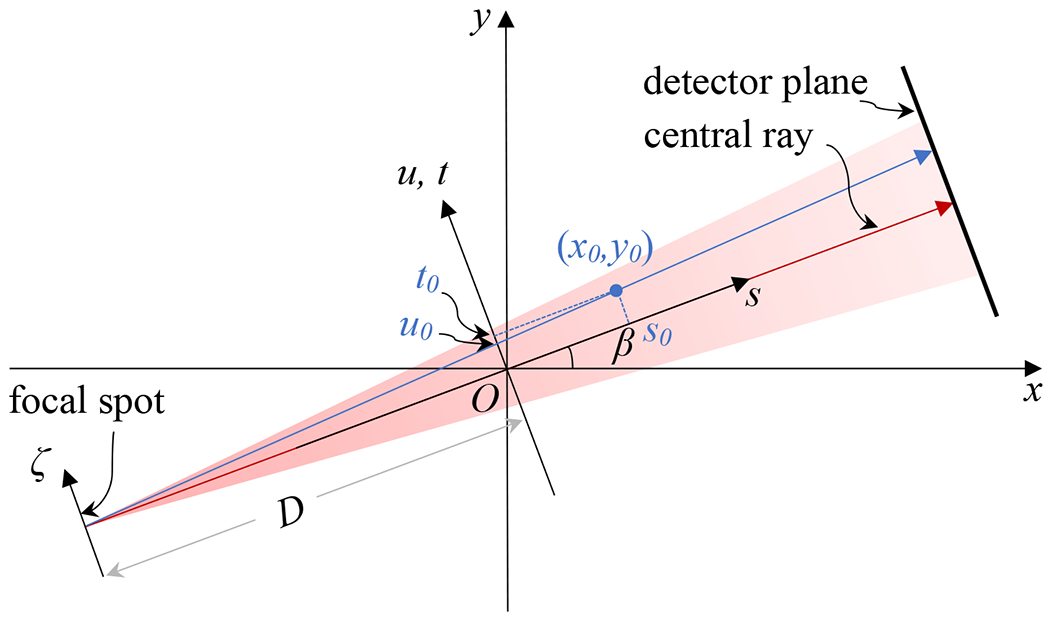
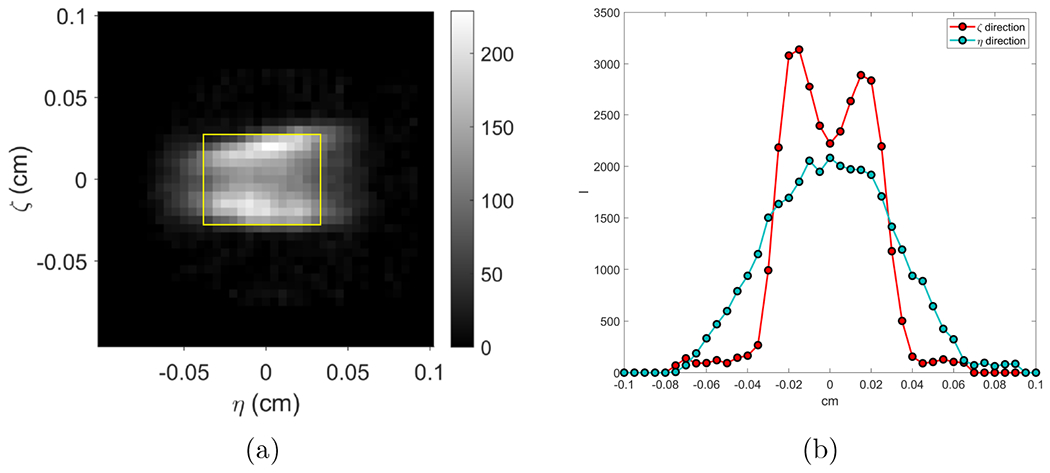
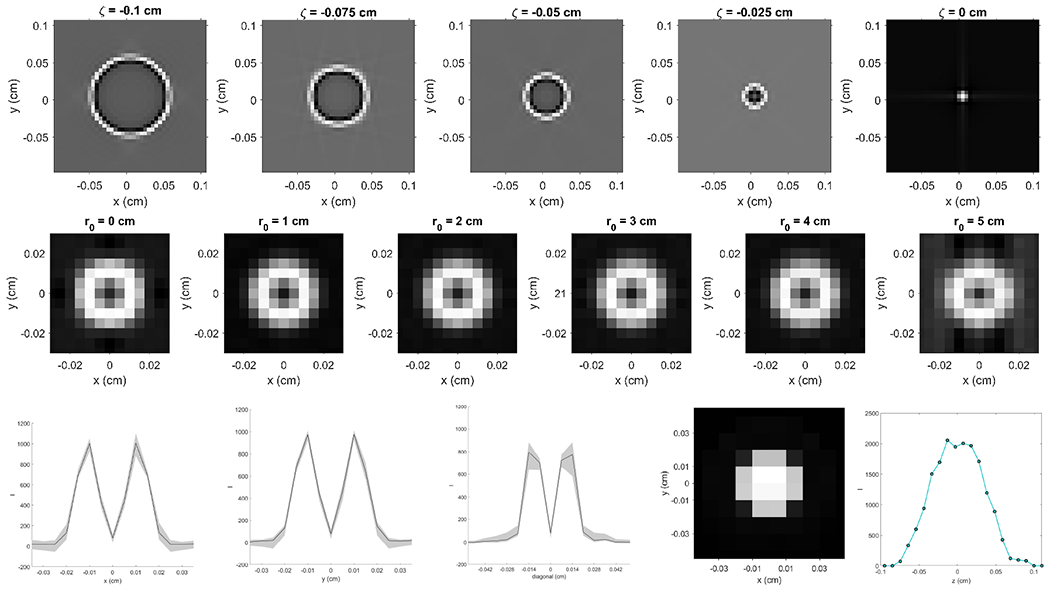
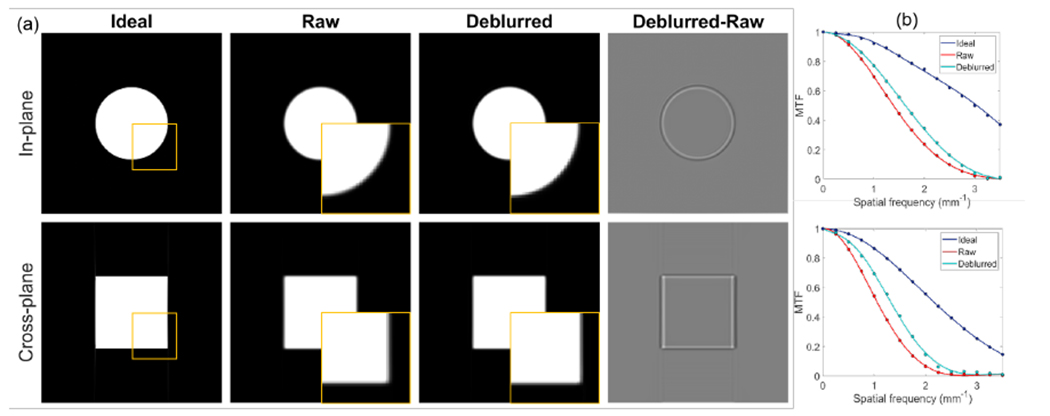
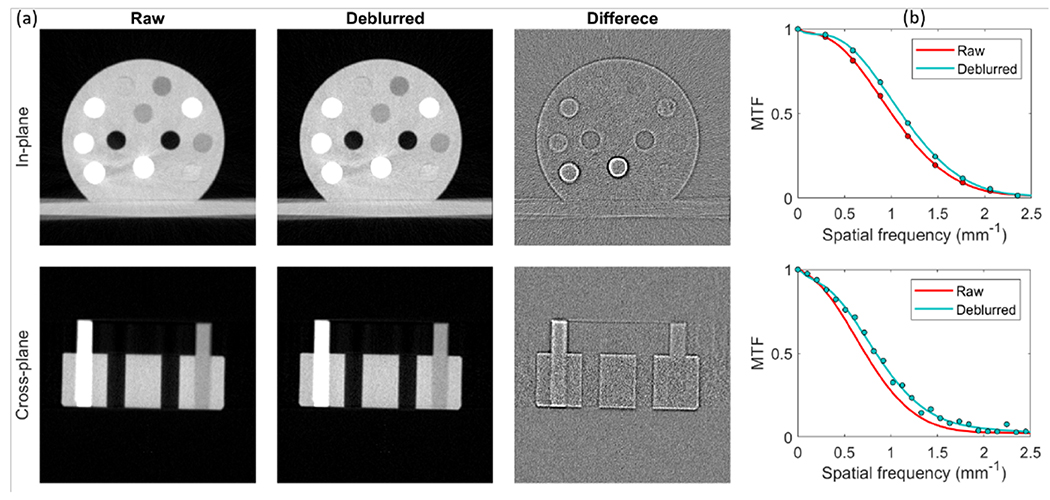
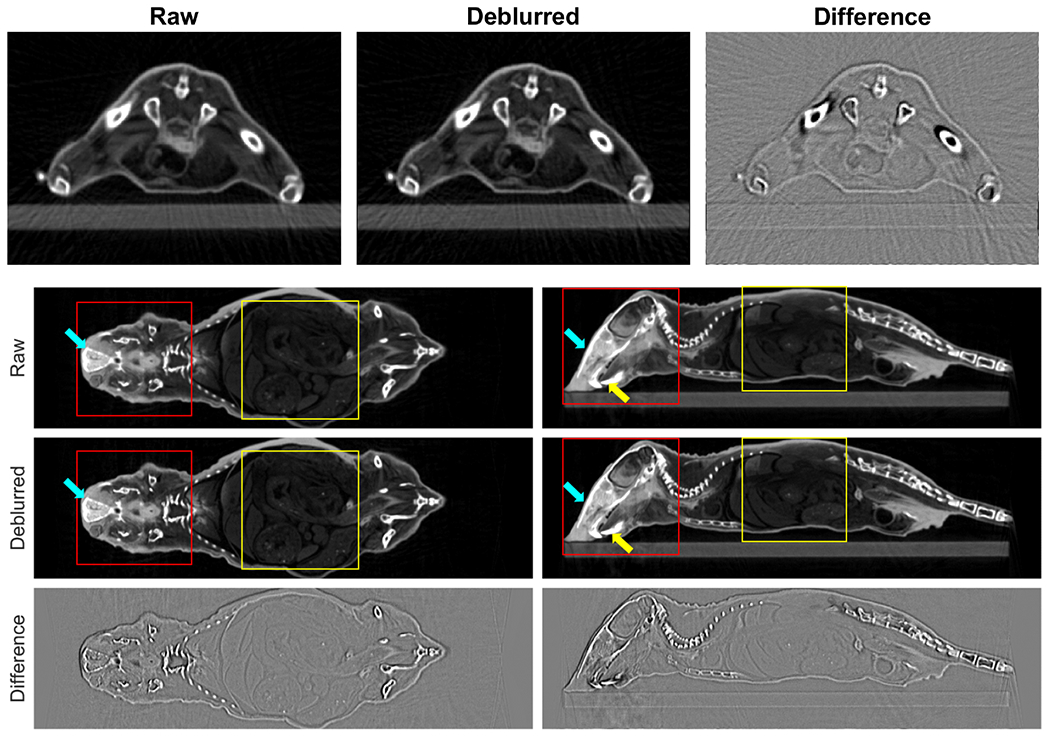
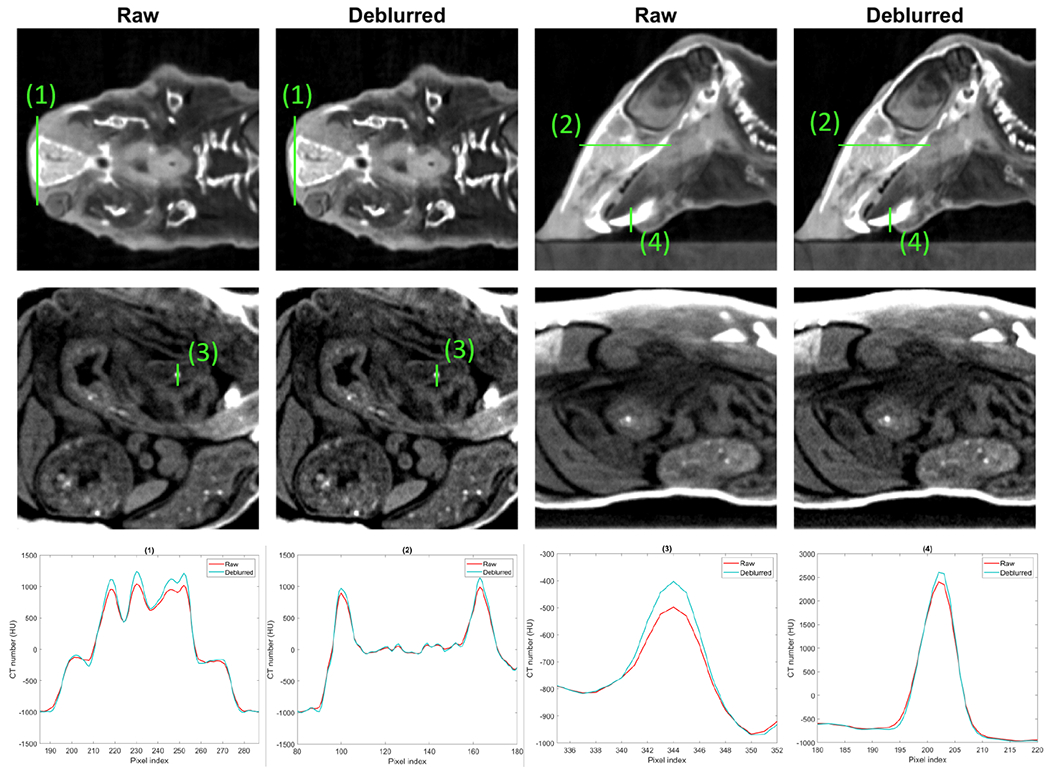
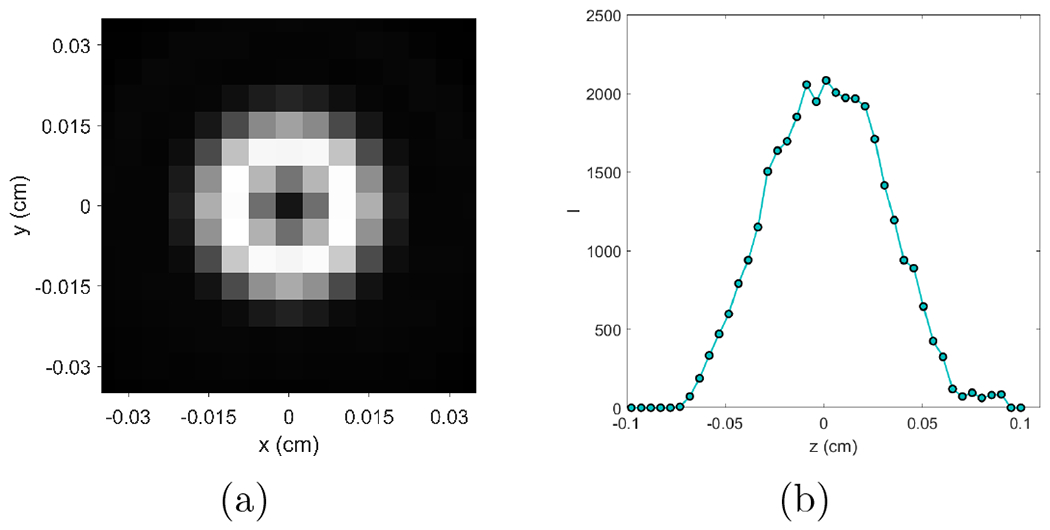
Objective.Modern preclinical small animal radiation platforms utilize cone beam computerized tomography (CBCT) for image guidance and experiment planning purposes. The resolution of CBCT images is of particular importance for visualizing fine animal anatomical structures. One major cause of spatial resolution reduction is the finite size of the x-ray focal spot. In this work, we proposed a simple method to measure x-ray focal spot intensity map and a CBCT image domain deblurring model to mitigate the effect of focal spot-induced image blurring.Approach.We measured a projection image of a tungsten ball bearing using the flat panel detector of the CBCT platform. We built a forward blurring model of the projection image and derived the spot intensity map by deconvolving the measured projection image. Based on the measured spot intensity map, we derived a CBCT image domain blurring model for images reconstructed by the filtered backprojection algorithm. Based on this model, we computed image domain blurring kernel and improved the CBCT image resolution by deconvolving the CBCT image.Main results.We successfully measured the x-ray focal spot intensity map. The spot size characterized by full width at half maximum was ∼0.75 × 0.55 mm2at 40 kVp. We computed image domain convolution kernels caused by the x-ray focal spot. A simulation study on noiseless projections was performed to evaluate the spatial resolution improvement exclusively by the focal spot kernel, and the modulation transfer function (MTF) at 50% was increased from 1.40 to 1.65 mm-1for in-plane images and 1.05-1.32 mm-1for cross-plane images. Experimental studies on a CT insert phantom and a plastinated mouse phantom demonstrated improved spatial resolution after image domain deconvolution, as indicated by visually improved resolution of fine structures. MTF at 50% was improved from 1.00 to 1.12 mm-1for in-plane direction and from 0.72 to 0.84 mm-1for cross-plane direction.Significance.The proposed method to mitigate blurring caused by finite x-ray spot size and improve CBCT image resolution is simple and effective.
Keywords: cone beam CT; deconvolution; image resolution; x-ray spot size.
© 2022 Institute of Physics and Engineering in Medicine.
Figures
References
-
- Doi Kunio, Fromes Bernard, and Rossmann Kurt. New device for accurate measurement of the x-ray intensity distribution of x-ray tube focal spots. Medical physics, 2(5):268–273, 1975. - PubMed
-
- Feldkamp Lee A, Davis Lloyd C, and Kress James W. Practical cone-beam algorithm. Josa a, 1(6):612–619, 1984.
Publication types
MeSH terms
Grants and funding
LinkOut - more resources
Full Text Sources
Other Literature Sources
Miscellaneous