. 2022 May 10;55(5):827-846.e10.
doi: 10.1016/j.immuni.2022.04.004. Epub 2022 Apr 27.

Multimodal profiling of lung granulomas in macaques reveals cellular correlates of tuberculosis control

Affiliations

Multimodal profiling of lung granulomas in macaques reveals cellular correlates of tuberculosis control

Hannah P Gideon et al. Immunity. .

Abstract

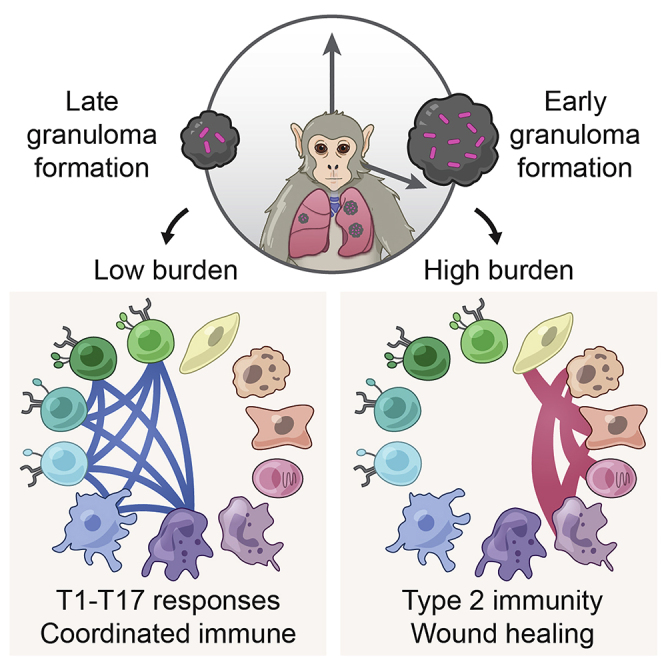
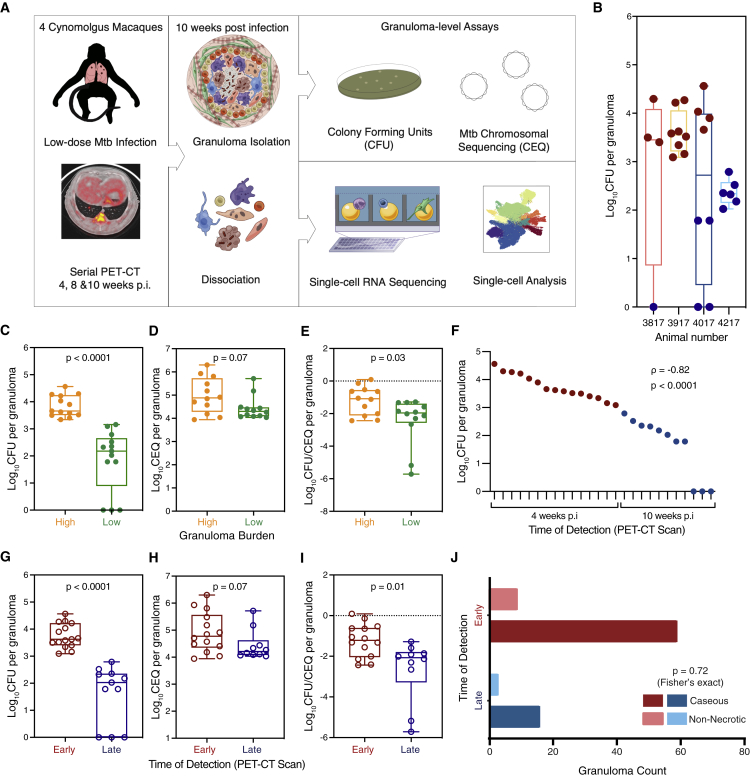
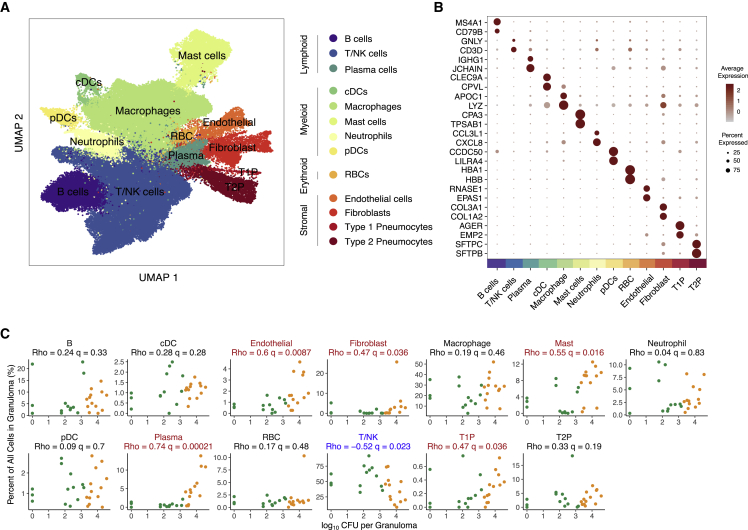
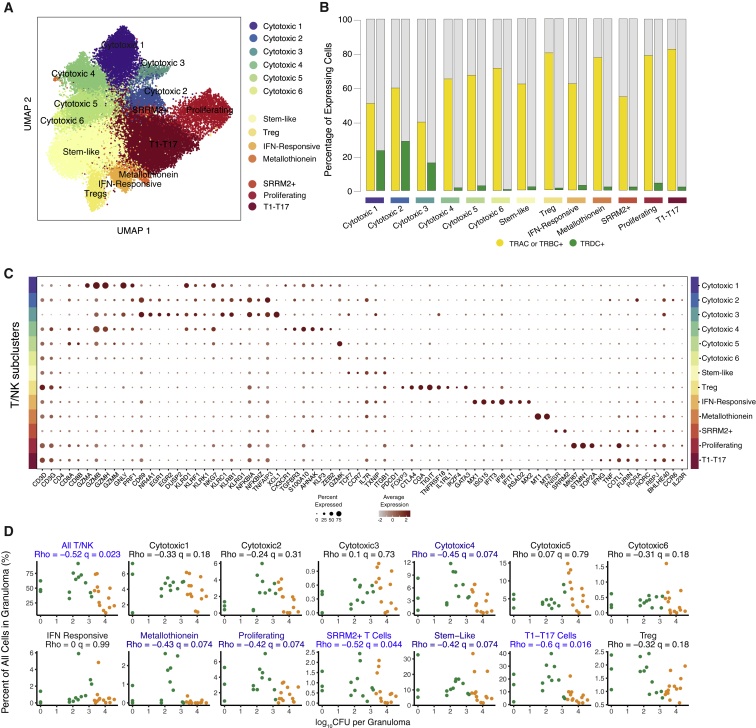
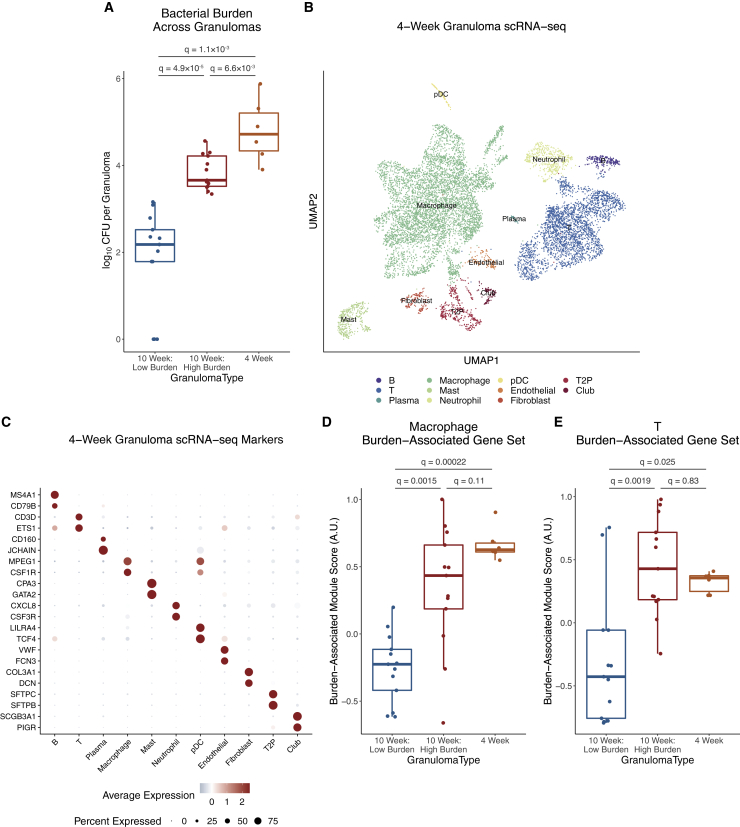
Mycobacterium tuberculosis lung infection results in a complex multicellular structure: the granuloma. In some granulomas, immune activity promotes bacterial clearance, but in others, bacteria persist and grow. We identified correlates of bacterial control in cynomolgus macaque lung granulomas by co-registering longitudinal positron emission tomography and computed tomography imaging, single-cell RNA sequencing, and measures of bacterial clearance. Bacterial persistence occurred in granulomas enriched for mast, endothelial, fibroblast, and plasma cells, signaling amongst themselves via type 2 immunity and wound-healing pathways. Granulomas that drove bacterial control were characterized by cellular ecosystems enriched for type 1-type 17, stem-like, and cytotoxic T cells engaged in pro-inflammatory signaling networks involving diverse cell populations. Granulomas that arose later in infection displayed functional characteristics of restrictive granulomas and were more capable of killing Mtb. Our results define the complex multicellular ecosystems underlying (lack of) granuloma resolution and highlight host immune targets that can be leveraged to develop new vaccine and therapeutic strategies for TB.

Keywords: Mycobacterium tuberculosis; PET-CT; immunology; intercellular interactions; scRNA-seq; single-cell RNA sequencing; type 1-type 17; type 2 responses.


Conflict of interest statement

Declaration of interests A.K.S. reports compensation for consulting and/or SAB membership from Merck, Honeycomb Biotechnologies, Cellarity, Repertoire Immune Medicines, Third Rock Ventures, Hovione, Relation Therapeutics, FL82, Empress Therapeutics, Ochre Bio, and Dahlia Biosciences.C.L. is a shareholder and consultant for Honeycomb Biotechnologies. T.K.H. is a shareholder and consultant for nference, inc.

Figures

None
Graphical abstract
Figure 1
Figure 1
Characteristics of animals over the course of Mtb infection and granuloma bacterial burden (A) Study design: cynomolgus macaques (n = 4) were infected with a low-dose inoculum of Mtb (Erdman strain), and serial PET-CT scans were performed at four, eight, and 10 weeks post-infection (p.i.), with the final scan used as a map for lesion identification at necropsy. (B) Distribution of CFU per granuloma sampled for Seq-Well assay for each animal. (C and G) CFU log10 per granuloma (total live bacteria). Box plot showing median, interquartile range, and range with MWU. (D and H) CEQ log10 per granuloma (live + dead Mtb) organized by time of detection. Box plot showing median, interquartile range, and range with MWU. (E and I) Ratio between CFU (viable bacteria) and CEQ (total bacterial burden)—i.e., relative bacterial survival. Box plot showing median, interquartile range, and range with MWU. Lower ratio (negative values) corresponds to increased killing, and higher ratio corresponds to increased Mtb survival. (C–E) Organized by bacterial burden: low, green; high, orange. (F) Individual granuloma bacterial burden (log10 CFU) plotted with time of detection by PET-CT scans: four weeks p.i. (early) or 10 weeks p.i. (late). (F–I) Time of detection by PET-CT scan (Table S1): early granulomas (maroon), late granulomas (blue). (J) Histological evaluation of necrosis across early-arising and late-arising granulomas at 10–12 weeks post-infection (n = 87 granulomas across 16 macaques). See also Figures S1, S3, and S6; Table S1.
Figure 2
Figure 2
Analysis of scRNA-seq of tuberculosis lung granulomas (A) Uniform manifold approximation and projection (UMAP) plot of 109,584 cells from 26 granulomas colored by identities of 13 generic cell types. (B) Expression levels of cluster-defining genes. Color intensity corresponds to the level of gene expression, whereas the size of dots represents the percent of cells with non-zero expression in each cluster. (C) Significant correlations between proportion of canonical cell types with bacterial burden of individual granulomas (log10 CFU per granuloma) using non-parametric Spearman’s rho correlation test with Benjamini-Hochberg multiple testing correction. Color indicates binned granuloma bacterial burden. See also Figures S2, S3, and S5; Table S2.
Figure 3
Figure 3
Diversity in the unified T and NK cell cluster and relationship to granuloma-level bacterial burden (A) Subclustering of 41,222 cells in the unified T/NK cell cluster. (B) Frequency of expression of TCR genes TRAC, TRBC1, or TRBC2 (yellow) and TRDC (green). (C) Expression levels of T/NK cell cluster-defining genes. Color intensity corresponds to the level of gene expression and the size of dots represents the percent of cells with non-zero expression in each cluster. (D) Significant correlations between proportion of T/NK subclusters with bacterial burden of individual granulomas (log10 CFU per granuloma) using non-parametric Spearman’s rho correlation test with Benjamini-Hochberg multiple testing correction. See also Figure S4; Tables S2, S3, and S4.
Figure 4
Figure 4
Phenotypic Diversity in T1-T17 cells (A) T1-T17 subcluster overlaid on unified T/NK cell cluster (left) and colored by normalized expression values for T1-T17 subcluster-defining genes (bold outlined boxes) and non-enriched canonical Type1 and type 17 genes (right). (B) Subclustering of 9,234 T1-T17 cells resulting in four phenotypic sub-populations. (C) Cluster-defining genes for T1-T17 subpopulations 1, 2, 3 and 4. Color intensity corresponds to the level of gene expression, and the size of dots represents the percent of cells with non-zero expression in each cluster. (D) Subclustering of T1-T17 cells colored by normalized gene-expression values for selected subcluster (top row) and subpopulation defining genes. (E) Significant correlations between proportion of T1-T17 subcluster and subpopulations with bacterial burden of individual granulomas (log10 CFU per granuloma) using non-parametric Spearman’s rho correlation test with Benjamini-Hochberg multiple testing correction. See also Figure S4; Tables S3 and S4.
Figure 5
Figure 5
Profiling the temporal trajectory of granuloma development (A) Comparison of bacterial burdens across timing of granuloma development and time p.i., using MWU test with Benjamini-Hochberg correction for multiple hypothesis testing. (B) UMAP visualization of scRNA-seq data of 10,007 cells from six granulomas across two macaques at four weeks p.i. (C) Expression levels of cluster-defining genes. Color intensity corresponds to level of gene expression, and size of dots represents the proportion of cells with non-zero expression in each cluster. (D) Expression levels of macrophage burden-associated gene set, defined by using genes differentially expressed between macrophages in 10-week-p.i. high-burden and 10-week-p.i. low-burden granulomas; boxplot with median, interquartile range, and whiskers extending a maximum of 1.5∗IQR; MWU test with Benjamini-Hochberg correction for multiple hypothesis testing. (E) Expression levels of T cell burden-associated gene set, defined by using genes differentially expressed between T cells in 10-week p.i. high-burden and 10-week p.i. low-burden granulomas; MWU test with Benjamini-Hochberg correction for multiple hypothesis testing.
Figure 6
Figure 6
Cellular ecosystem in TB lung granulomas (A) Pairwise Pearson correlation values of cell type proportions across 26 10-week p.i. granulomas. (B) Composition of each granuloma by cell type group. Left shows grouped high- and low-burden granulomas; right bar graph is split by granuloma. (C) Number of interactions strengthened in high-burden granulomas, organized by sender cell clusters. (D) Representation of each cell type group as sender cell population among the 10% of ligands most strengthened in high-burden granulomas. (E) Number of interactions strengthened in low-burden granulomas, organized by sender cell clusters. (F) Representation of each cell type group as sender among the 10% of ligands most strengthened in low-burden granulomas. (G) Network of interactions across cell type groups, subsetted to interactions strengthened in high-burden granulomas. Widths of arcs are proportional to number of interactions between cell type groups, and widths are on same scale as for inset (H). n = 2,899 statistically significant interactions, 1,837 of which were strengthened in high-burden granulomas. (H) Network of interactions across cell type groups, subsetted to only highlight interactions strengthened in low-burden granulomas. Widths of arcs are proportional to number of interactions between cell type groups, and widths are on same scale as for inset (G). n = 2,899 statistically significant interactions, 1,062 of which were strengthened in low-burden granulomas. (I) Overall high-vs-low granuloma burden fold-change of interactions strengths of key ligands, averaged across all statistically significant interactions. (J) Cell-cluster-specific interaction strength fold changes of each ligand, averaged across all statistically significant interactions where each cell cluster was the sender population. See also Figure S6; Table S5.

Comment in

References

    1. Acosta-Rodriguez E.V., Rivino L., Geginat J., Jarrossay D., Gattorno M., Lanzavecchia A., Sallusto F., Napolitani G. Surface phenotype and antigenic specificity of human interleukin 17-producing T helper memory cells. Nat. Immunol. 2007;8:639–646. doi: 10.1038/ni1467. - DOI - PubMed
    1. Ahidjo B.A., Maiga M.C., Ihms E.A., Maiga M., Ordonez A.A., Cheung L.S., Beck S., Andrade B.B., Jain S., Bishai W.R. The antifibrotic drug pirfenidone promotes pulmonary cavitation and drug resistance in a mouse model of chronic tuberculosis. JCI Insight. 2016;1:e86017. doi: 10.1172/jci.insight.86017. - DOI - PMC - PubMed
    1. Ahmed R., Roger L., Costa Del Amo P., Miners K.L., Jones R.E., Boelen L., Fali T., Elemans M., Zhang Y., Appay V., et al. Human stem cell-like memory T cells are maintained in a state of dynamic flux. Cell Rep. 2016;17:2811–2818. doi: 10.1016/j.celrep.2016.11.037. - DOI - PMC - PubMed
    1. Scott Algood H.M., Lin P.L., Flynn J.L. Tumor necrosis factor and chemokine interactions in the formation and maintenance of granulomas in tuberculosis. Clin. Infect. Dis. 2005;41:S189–S193. doi: 10.1086/429994. - DOI - PubMed
    1. Amezcua Vesely M.C., Pallis P., Bielecki P., Low J.S., Zhao J., Harman C.C.D., Kroehling L., Jackson R., Bailis W., Licona-Limon P., et al. Effector TH17 cells give rise to long-lived TRM cells that are essential for an immediate response against bacterial infection. Cell. 2019;178:1176–1188.e15. doi: 10.1016/j.cell.2019.07.032. - DOI - PMC - PubMed

Publication types

LinkOut - more resources