. 2022 May 23;57(10):1226-1240.e8.
doi: 10.1016/j.devcel.2022.04.003. Epub 2022 Apr 27.

The myogenesis program drives clonal selection and drug resistance in rhabdomyosarcoma

Affiliations

The myogenesis program drives clonal selection and drug resistance in rhabdomyosarcoma

Anand G Patel et al. Dev Cell. .

Abstract

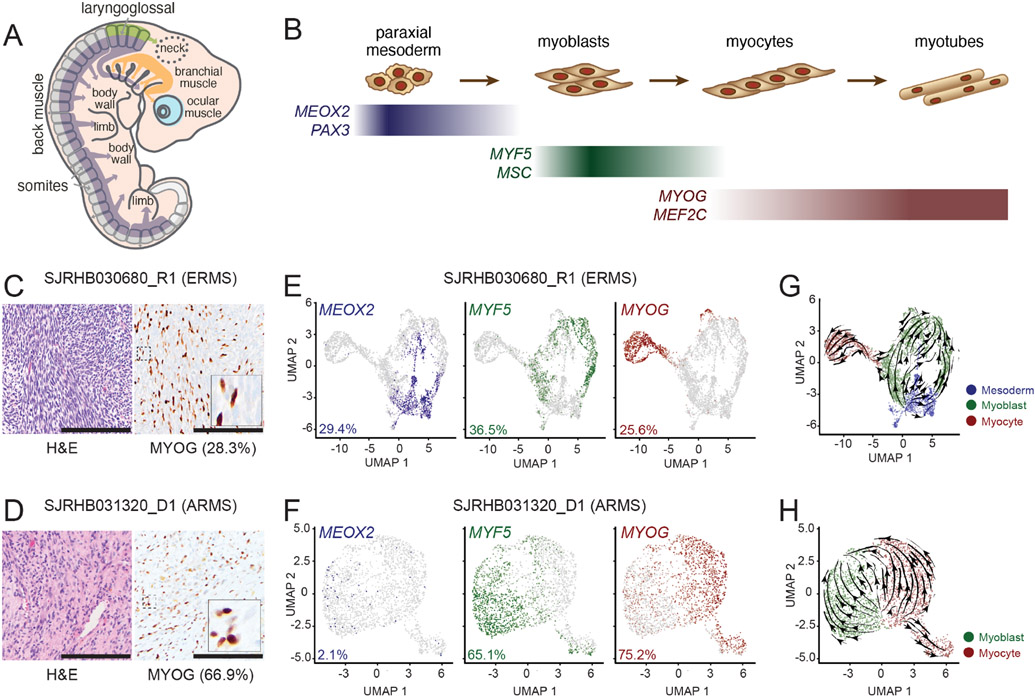
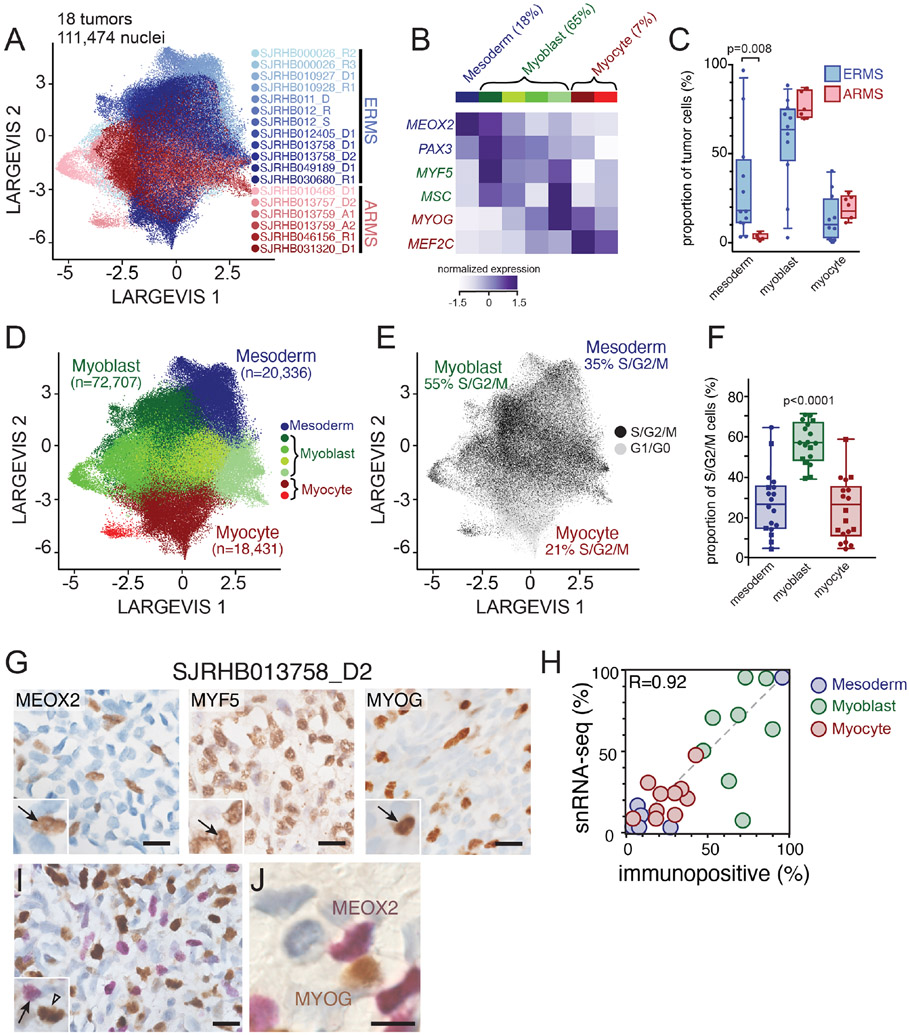
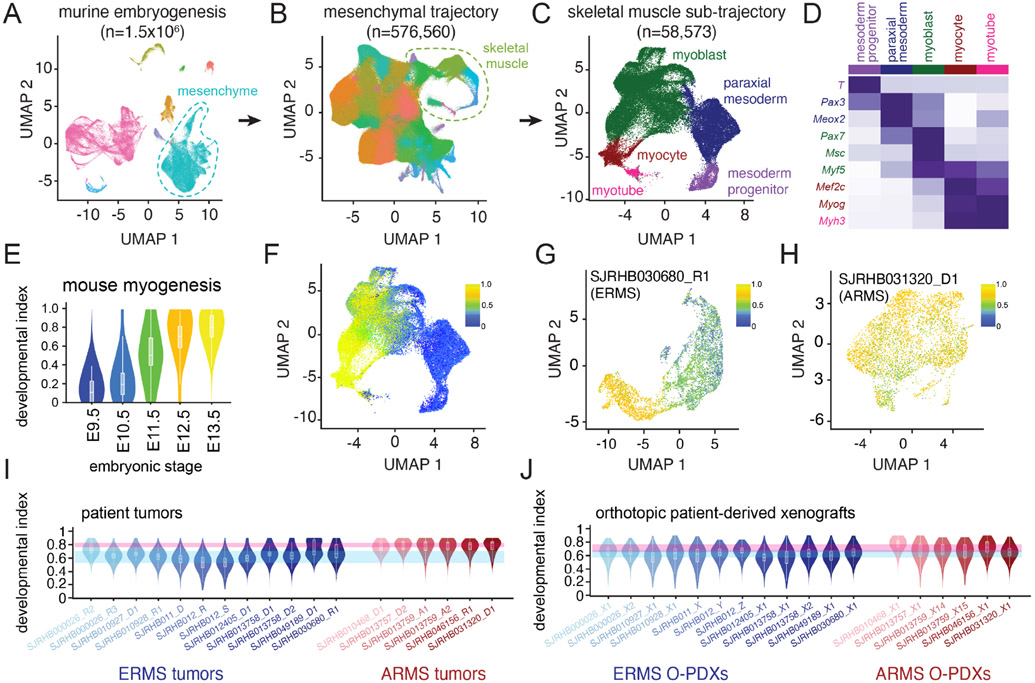
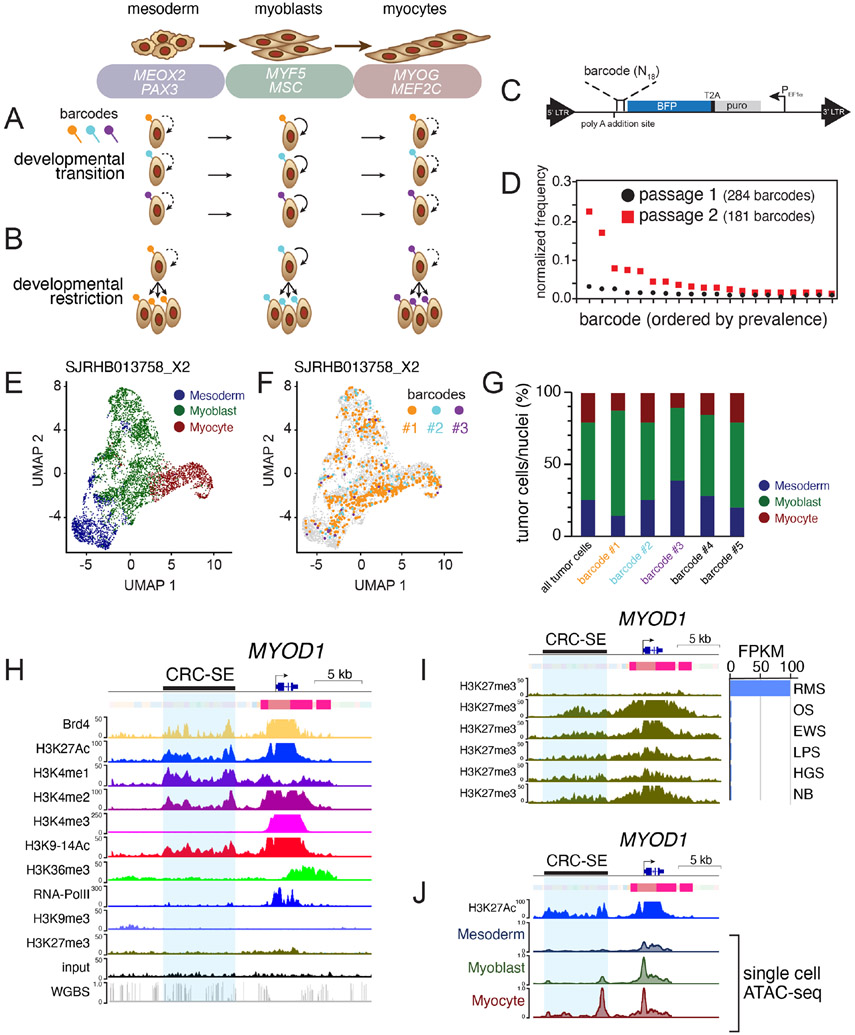
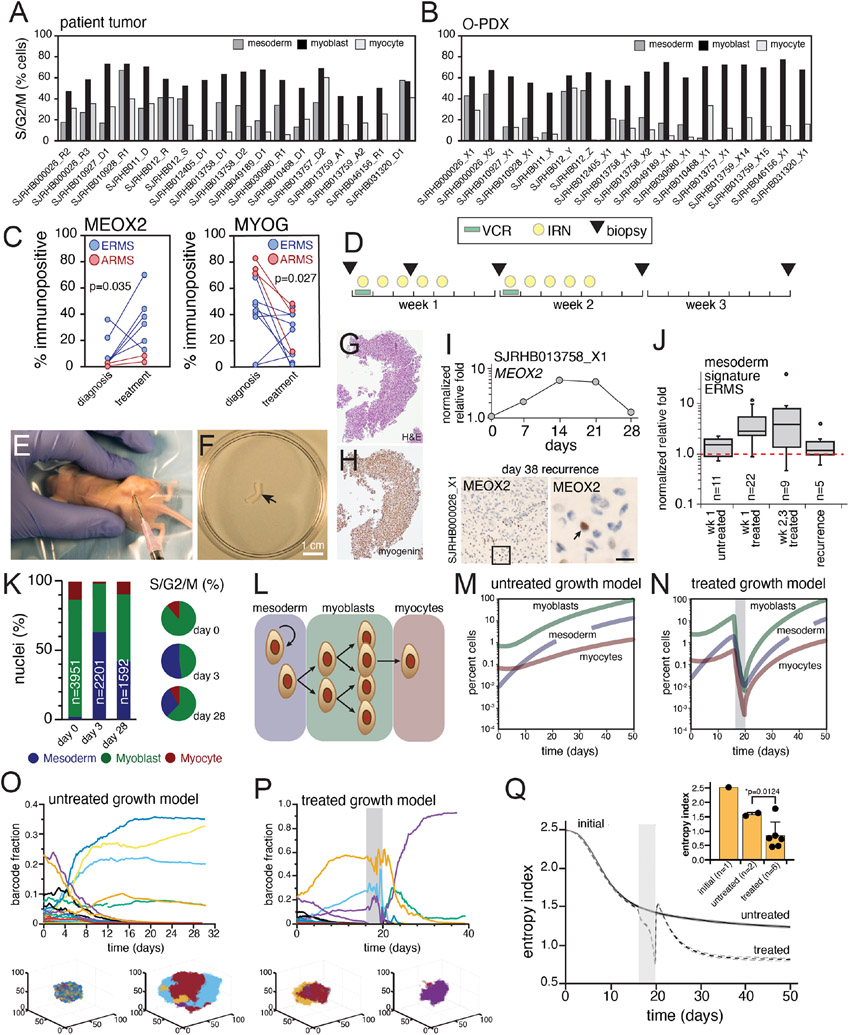
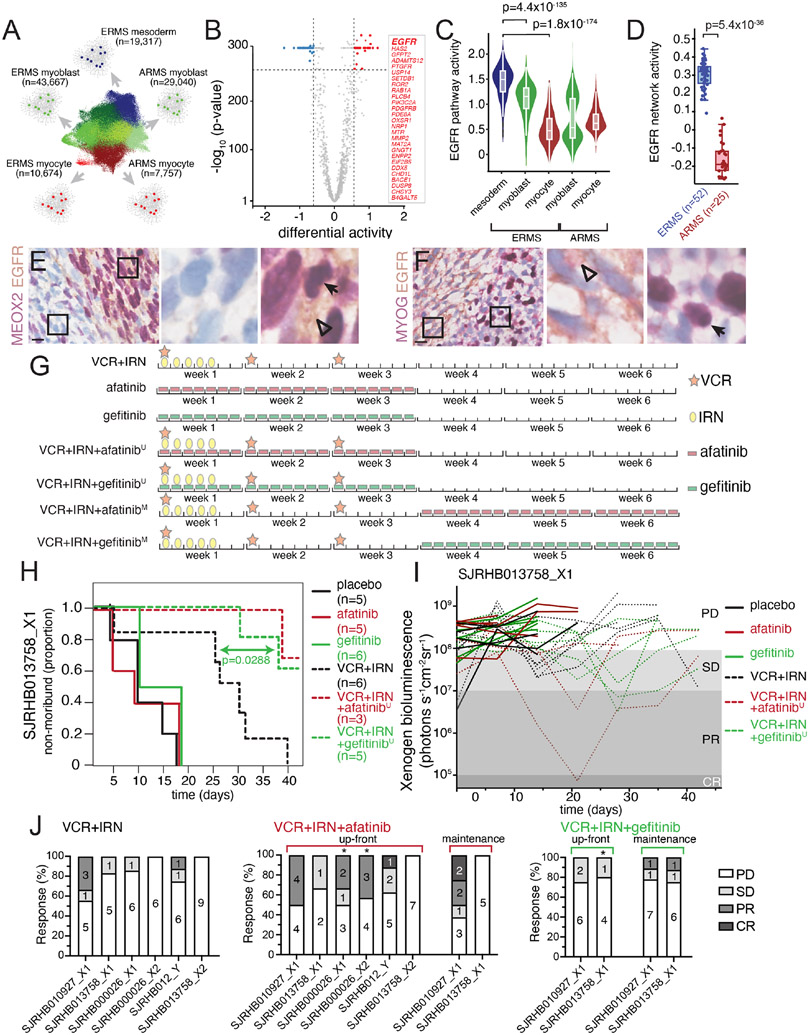
Rhabdomyosarcoma (RMS) is a pediatric cancer with features of skeletal muscle; patients with unresectable or metastatic RMS fare poorly due to high rates of disease recurrence. Here, we use single-cell and single-nucleus RNA sequencing to show that RMS tumors recapitulate the spectrum of embryonal myogenesis. Using matched patient samples from a clinical trial and orthotopic patient-derived xenografts (O-PDXs), we show that chemotherapy eliminates the most proliferative component with features of myoblasts within embryonal RMS; after treatment, the immature population with features of paraxial mesoderm expands to reconstitute the developmental hierarchy of the original tumor. We discovered that this paraxial mesoderm population is dependent on EGFR signaling and is sensitive to EGFR inhibitors. Taken together, these data serve as a proof of concept that targeting each developmental state in embryonal RMS is an effective strategy for improving outcomes by preventing disease recurrence.

Trial registration: ClinicalTrials.gov NCT01871766.

Keywords: cancer recurrence; muscle development; sarcoma; single-cell biology; tumor heterogeneity.


Conflict of interest statement

Declaration of interests The authors declare no competing interests.

Figures

Figure 1:
Figure 1:. Single-cell RNA-sequencing (scRNA-seq) reveal a developmental hierarchy within RMS.
A-B, During fetal myogenesis, mesodermal cells of the somite migrate to form skeletal muscle throughout the body (A). During that migration, these cells undergo stepwise differentiation typified by the transient expression of myogenic regulatory factors (B). C-D, Photomicrographs of an embryonal RMS tumor, SJRHB030680_R1 (C) and an alveolar RMS tumor, SHRHB031320_D1. Left, H&E staining. Right, Myogenin (MYOG) immunohistochemistry (IHC) with 20X magnification, inset, 80X magnification. E-F, UMAP visualization of 3,973 malignant cells from SJRHB030680_R1 (E) and 2,414 malignant cells from SJRHB031320_D1 (F). Cells are colored based on expression of MEOX2 (left), MYF5 (center), and MYOG (right). G-H, RNA velocity analysis of SJRHB030680_R1 (G) and SJRHB031320_D1 (H). Abbreviations: ERMS, embryonal rhabdomyosarcoma; UMAP, uniform manifold approximation and projection. Scale bars: C,D, 100 μm.
Figure 2:
Figure 2:. Identification of major cell clusters within patient RMS tumors using single-nucleus RNA-sequencing.
A, Large Vis visualization of snRNA-seq of 111,474 nuclei from 18 integrated patient RMS tumors, colored based on sample. B, Heatmap showing expression of myogenic regulatory factor expression across seven Leiden clusters. Expression is colored based on relative value (z-score). C, Boxplot showing the percentage of malignant nuclei within each muscle developmental state for each tumor. D-E, Large Vis visualization of Leiden clustering of snRNA-seq grouped based on expression of mesoderm, myoblast, or myocyte myogenic regulatory factors (D) or colored by predicted cell cycle phase (E). F, Plot of the proportion of proliferating cells (S/G2/M phase) in each group, estimated using gene signatures associated with G1, S, and G2/M phases. Circles are ERMS and squares are ARMS. G, Immunohistochemistry image of an ERMS tumor, SJRHB013758_D2 stained with antibodies against MEOX2 (left), MYF5 (center) and MYOG (right). H, Quantitation of the percentage of cells positive for MEOX2 (blue), MYF5 (green), or MYOG (red) immunohistochemical staining (x axis) compared to percentage of cells within each developmental state as determined by snRNA-seq (y axis). I-J, Dual staining of MEOX2 (purple) and MYOG (brown) within SJRHB013758 (I) with magnified view (J). Abbreviations: ERMS, embryonal rhabdomyosarcoma; ARMS, alveolar rhabdomyosarcoma. Scale bars: G, 10 μm.
Figure 3:
Figure 3:. Developmental indexing of patient RMS tumors and orthotopic patient-derived xenografts.
A, UMAP plot of 1.5 million nuclei from the Mouse Organogenesis Cell Atlas, downsampled to 100,000 nuclei. Clusters are colored based on trajectory. B, UMAP plot of 576,560 nuclei from the mesenchymal trajectory with identification of the skeletal myogenesis sub-trajectory. Nuclei are colored based on Leiden cluster. C, UMAP plot of 58,573 nuclei of the skeletal muscle sub-trajectory with computational clustering that identifies nuclei from early mesodermal progenitors, paraxial mesoderm, myoblasts, myocytes and myotubes. D, Heatmap of aggregated transcription from each cluster demonstrating expression of myogenic regulatory factors and additional mesodermal markers. E, Violin plot of projected developmental indices of embryonic skeletal muscle data separated by mouse embryonic stage. F, UMAP plot of developmental indices within the embryonic skeletal muscle sub-trajectory. G-H, Application of developmental indices to an ERMS tumor, SJRHB030680_R1 (G) and an ARMS tumor, SJRHB031320_D1 (H). I-J, Developmental indices of 18 patient RMS tumors (I) or 18 O-PDXs (J). Blue and red ribbons represent the range of median values for all ERMS (blue) or ARMS (red) tumors or O-PDXs. Abbreviations: ERMS, embryonal rhabdomyosarcoma; ARMS, alveolar rhabdomyosarcoma; UMAP, uniform manifold approximation and projection.
Figure 4:
Figure 4:. Developmental status in ERMS is plastic and associated with chromatin accessibility at core regulatory superenhancer regions.
A-B, Two competing models of tumor heterogeneity within RMS. In the first model, RMS cells transition across developmental states (A); in the alternate model, genetically distinct clones are restricted to muscle developmental states (B). C, Schematic of the lentiviral barcode plasmid. An 18-mer of random nucleotides is incorporated into the 3’-untranslated region of a blue fluorescent protein (BFP) tag, enabling barcode recovery from scRNA-seq libraries. D, Plot of frequency of individual barcodes for subsequent passages of an individual ERMS O-PDX, SJRHB00026_X1. E-F. UMAP plot of an ERMS O-PDX SJRHB013758_X2, colored based on developmental stage (E), or with 3 specific barcodes highlighted (F). G, Quantitation of the developmental state diversity of all tumor cells within SJRHB013758_X2, and from the 5 most prevalent barcoded clones. H, ChIP-seq and chromHMM of MYOD1 in an ERMS O-PDX, SJRHB10927_X1. Scales are indicated on the left, and a previously identified CRC-SE is highlighted in blue. I, Comparison of H3K27 trimethylation in various pediatric O-PDXs. OS, osteosarcoma; EWS, Ewing sarcoma; LPS, liposarcoma; HGS, high-grade sarcoma; NB, neuroblastoma. J, Single-cell ATAC-seq of SJRHB010927_X1 at the MYOD1 locus; cell identities were defined via gene activity estimation, and dataset integration with scRNA-seq data. Abbreviations: ERMS, embryonal rhabdomyosarcoma; ARMS, alveolar rhabdomyosarcoma; UMAP, uniform manifold approximation and projection; RMS, rhabdomyosarcoma; OS, osteosarcoma; EWS, Ewing sarcoma; LPS, liposarcoma; HGS, high grade sarcoma; NB, neuroblastoma.
Figure 5.
Figure 5.. Chemotherapy treatment of ERMS selects for mesoderm developmental stages.
A-B, Bar plots showing percentage of cells predicted to be dividing within each developmental stage for patient tumors (a) and O-PDXs (b). C, Plots showing immunopositivity for MEOX2 (left) and MYOG (right) in patient samples from RMS13 obtained before treatment (“diagnosis”) and during therapy (“mid-treatment”). D, Treatment schema for VI therapy of mice bearing RMS O-PDXs. Needle biopsies were performed at days 0, 3, 7, 14, and 21 or when tumors were large enough to sample. E, Photograph of needle biopsy of an orthotopically-injected xenograft. F-H, Photograph of tissue obtained by a biopsied O-PDX (F), which was fixed and stained using H&E (G) or MYOG (H). I, Plot showing longitudinal expression of MEOX2 by qRT-PCR during treatment. There is an increase in MEOX2 during chemotherapy (days 7,14,21) but the proportion resets to basal levels after 28 days. This was verified by IHC (lower panel). J, Boxplot of all biopsies for ERMS tumor bearing mice for the untreated and treated samples. The plot is an integration of expression of 6 genes (MEOX2, PAX3, EGFR, CD44, DCN, POSTN) expressed as normalized relative fold. K, Relative proportion of nuclei in each developmental state for longitudinal biopsies of a single O-PDX, determined using snRNA-seq of biopsied tissue. L, Diagram of the mathematical model of ERMS developmental heterogeneity. M-N, Simulated average population size for an untreated ERMS tumor (M) or a treated ERMS tumor (N) briefly exposed to an antiproliferative agent (gray bar). Average population size over 524 simulations are shown, standard error bars are too small to see. O-P, Simulated time course of barcode dynamics for an ERMS tumor that was either untreated (O) or briefly treated (P; duration of treatment in grey bar). Each curve represents a different barcoded lineage. One realization of the stochastic dynamics is shown. Insets under each graph show spatial distributions of bar codes (color coded) in myoblast cells at an early and late stage of tumor growth (O) and pre- and post-therapy (P). Q, Temporal development of the average entropy index (measure of barcode diversity) during barcoded ERMS tumor growth, either untreated or briefly treated (grey bar). Average entropy values over 524 simulations ± standard errors (dashed lines) are shown. Inset, bar plot comparing the initial entropy index to the final entropy index of untreated or treated SJRHB000026_X1 O-PDXs. Model parameters were: average value of Lmes =0.0035 (r1=1.5, r2=0.0001), Lblast =0.0045, Pmes =0.55, Pblast =0.49, D=0.035, αmes =0.0014, αblast =0.0035. The parameter units are per minute. Abbreviations: ERMS, embryonal rhabdomyosarcoma; ARMS, alveolar rhabdomyosarcoma; VCR, vincristine; IRN irinotecan.
Figure 6.
Figure 6.. Mesoderm-like ERMS cells are uniquely vulnerable to EGFR blockade.
A, Schematic workflow of NetBID algorithm to identify cell type-specific drivers from snRNA-seq data. B, Volcano plot of differential activity analysis of signaling drivers in ERMSmesoderm vs. other cell types. C-D, EGFR NetBID activity in different developmental states from snRNA-seq data (C) and inferred from bulk RNA-seq of patient tumors (D). E-F, Dual IHC staining of ERMS patient tumor, SJRHB030680_R1, combining EGFR (brown) with either MEOX2 (E) or MYOG (F) in purple. G, Schedules of drugs used for preclinical study. Mice were randomized into one of eight arms): placebo, gefitinib daily for 3 weeks, afatinib daily for 3 weeks, VCR+IRN, VCR+IRN+‘up-front’ afatinib (afatinibU), VCR+IRN+‘up-front’ gefitinib (gefitinibU), VCR+IRN+‘maintenance’ afatinib (afatinibM), or VCR+IRN+‘maintenance’ gefitinib (gefitinibM). In up-front arms (‘U’), mice received VCR+IRN while also receiving daily EGFRi. In maintenance arms (‘M’), mice received 3 weeks of VCR+IRN followed by 3 additional weeks of daily EGFRi. H, Survival curves for each treatment group for a ERMS tumor O-PDX (SJRHB013758_X1). I, Tumor response of SJRHB013758_X1 during preclinical testing. Outcomes were defined based on Xenogen signal at the end of therapy: progressive disease (PD, signal > 108); stable disease (SD, 107 < signal < 108); partial response (PR, 105 signal < 107); complete response (CR, signal < 105). J, Percent response for the six O-PDX models treated with VCR+IRN (left), VCR+IRN+afatinib (center) or VCR+IRN+gefitinib (right). Asterisks denote models that significant difference in tumor progression compared to VCR+IRN. Scale bars: E,F, 10 μm. Abbreviations: VCR, vincristine; IRN, irinotecan; ERMS, embryonal rhabdomyosarcoma; ARMS, alveolar rhabdomyosarcoma.

References

    1. Adamson B, Norman TM, Jost M, Cho MY, Nuñez JK, Chen Y, Villalta JE, Gilbert LA, Horlbeck MA, Hein MY, et al. (2016). A Multiplexed Single-Cell CRISPR Screening Platform Enables Systematic Dissection of the Unfolded Protein Response. Cell 167, 1867–1882. - PMC - PubMed
    1. Aran D, Looney AP, Liu L, Wu E, Fong V, Hsu A, Chak S, Naikawadi RP, Wolters PJ, Abate AR, et al. (2019). Reference-based analysis of lung single-cell sequencing reveals a transitional profibrotic macrophage. Nat Immunol 20, 163–172. - PMC - PubMed
    1. Arndt CAS, Bisogno G, and Koscielniak E (2018). Fifty Years of Rhabdomyosarcoma studies on both sides of the Pond and Lessons Learned. Cancer Treat Rev 68, 94–101. - PubMed
    1. Barkas N, Petukhov V, Nikolaeva D, Lozinsky Y, Demharter S, Khodosevich K, and Kharchenko PV (2019). Joint analysis of heterogeneous single-cell RNA-seq dataset collections. Nat Methods 16, 695–698. - PMC - PubMed
    1. Becht E, McInnes L, Healy J, Dutertre C-A, Kwok IWH, Ng LG, Ginhoux F, and Newell EW (2019). Dimensionality reduction for visualizing single-cell data using UMAP. Nat Biotechnol 37, 38–44. - PubMed

Publication types

Associated data