. 2022 May 12;185(10):1661-1675.e16.
doi: 10.1016/j.cell.2022.03.042. Epub 2022 Apr 27.

GPCR-mediated β-arrestin activation deconvoluted with single-molecule precision

Affiliations

GPCR-mediated β-arrestin activation deconvoluted with single-molecule precision

Wesley B Asher et al. Cell. .

Abstract

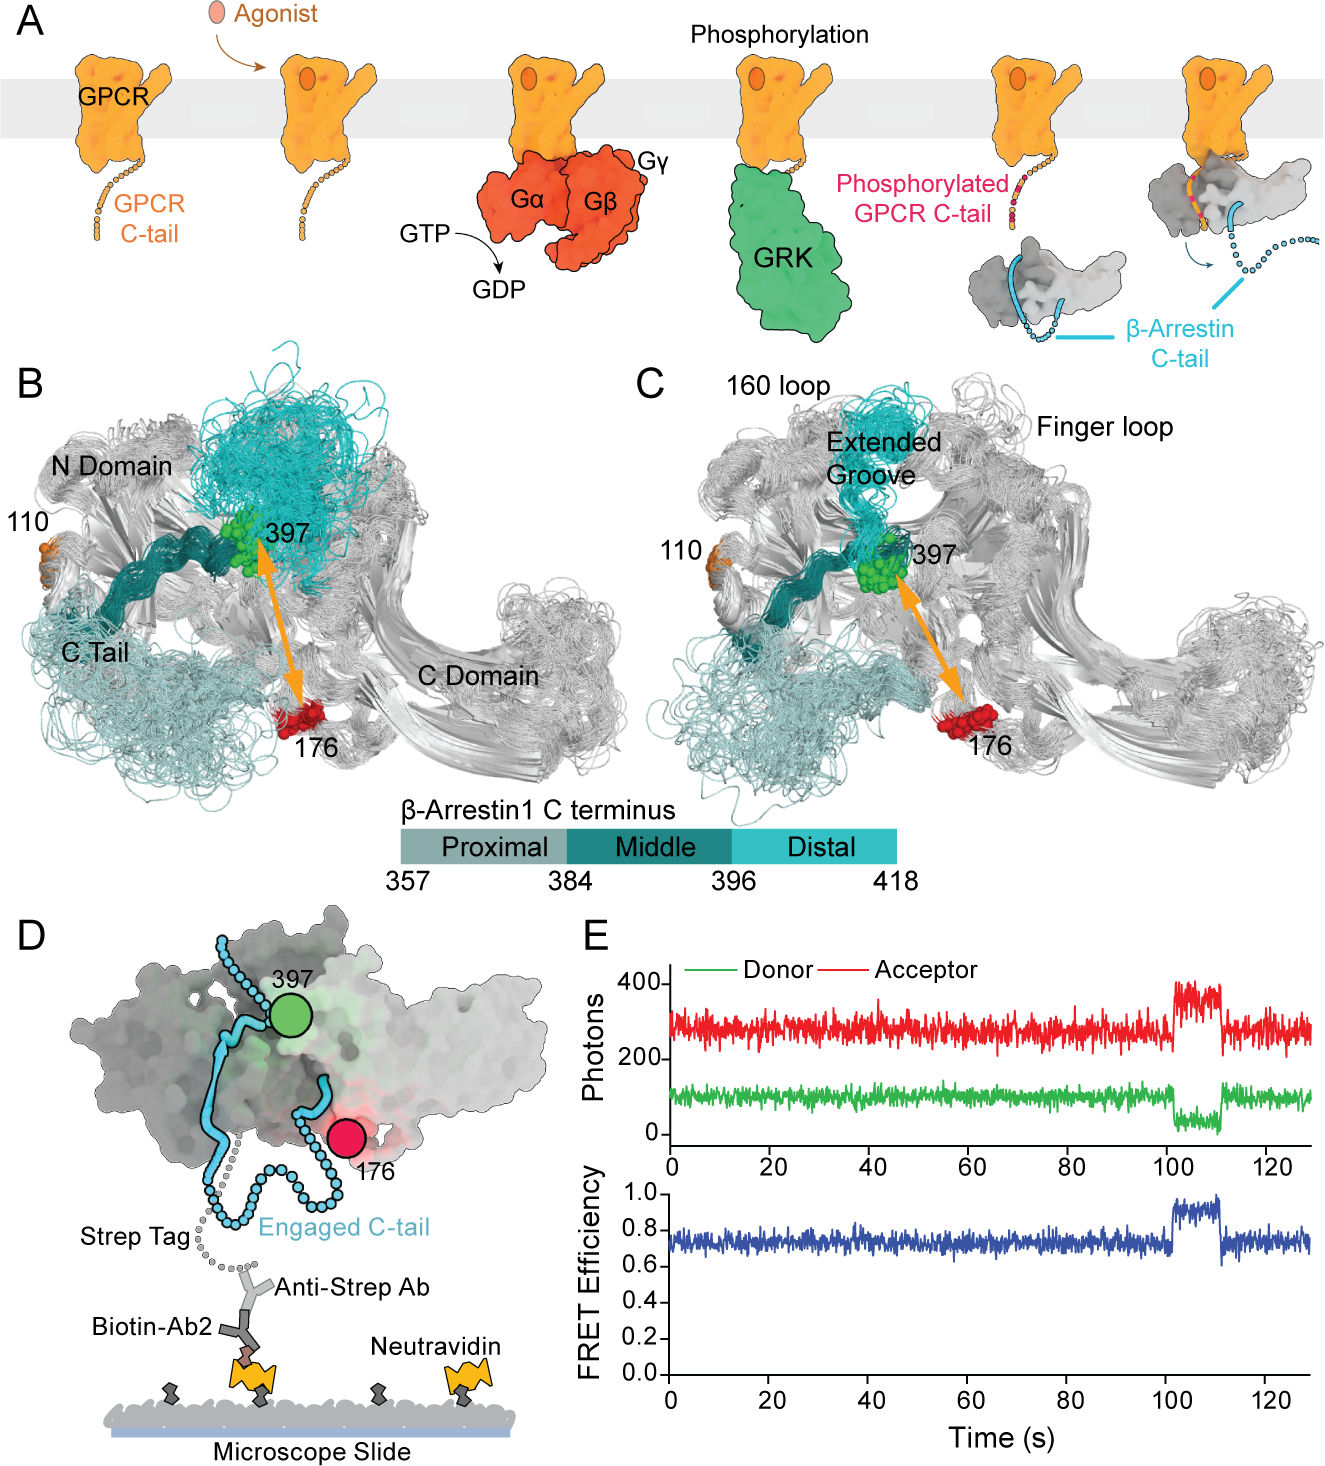
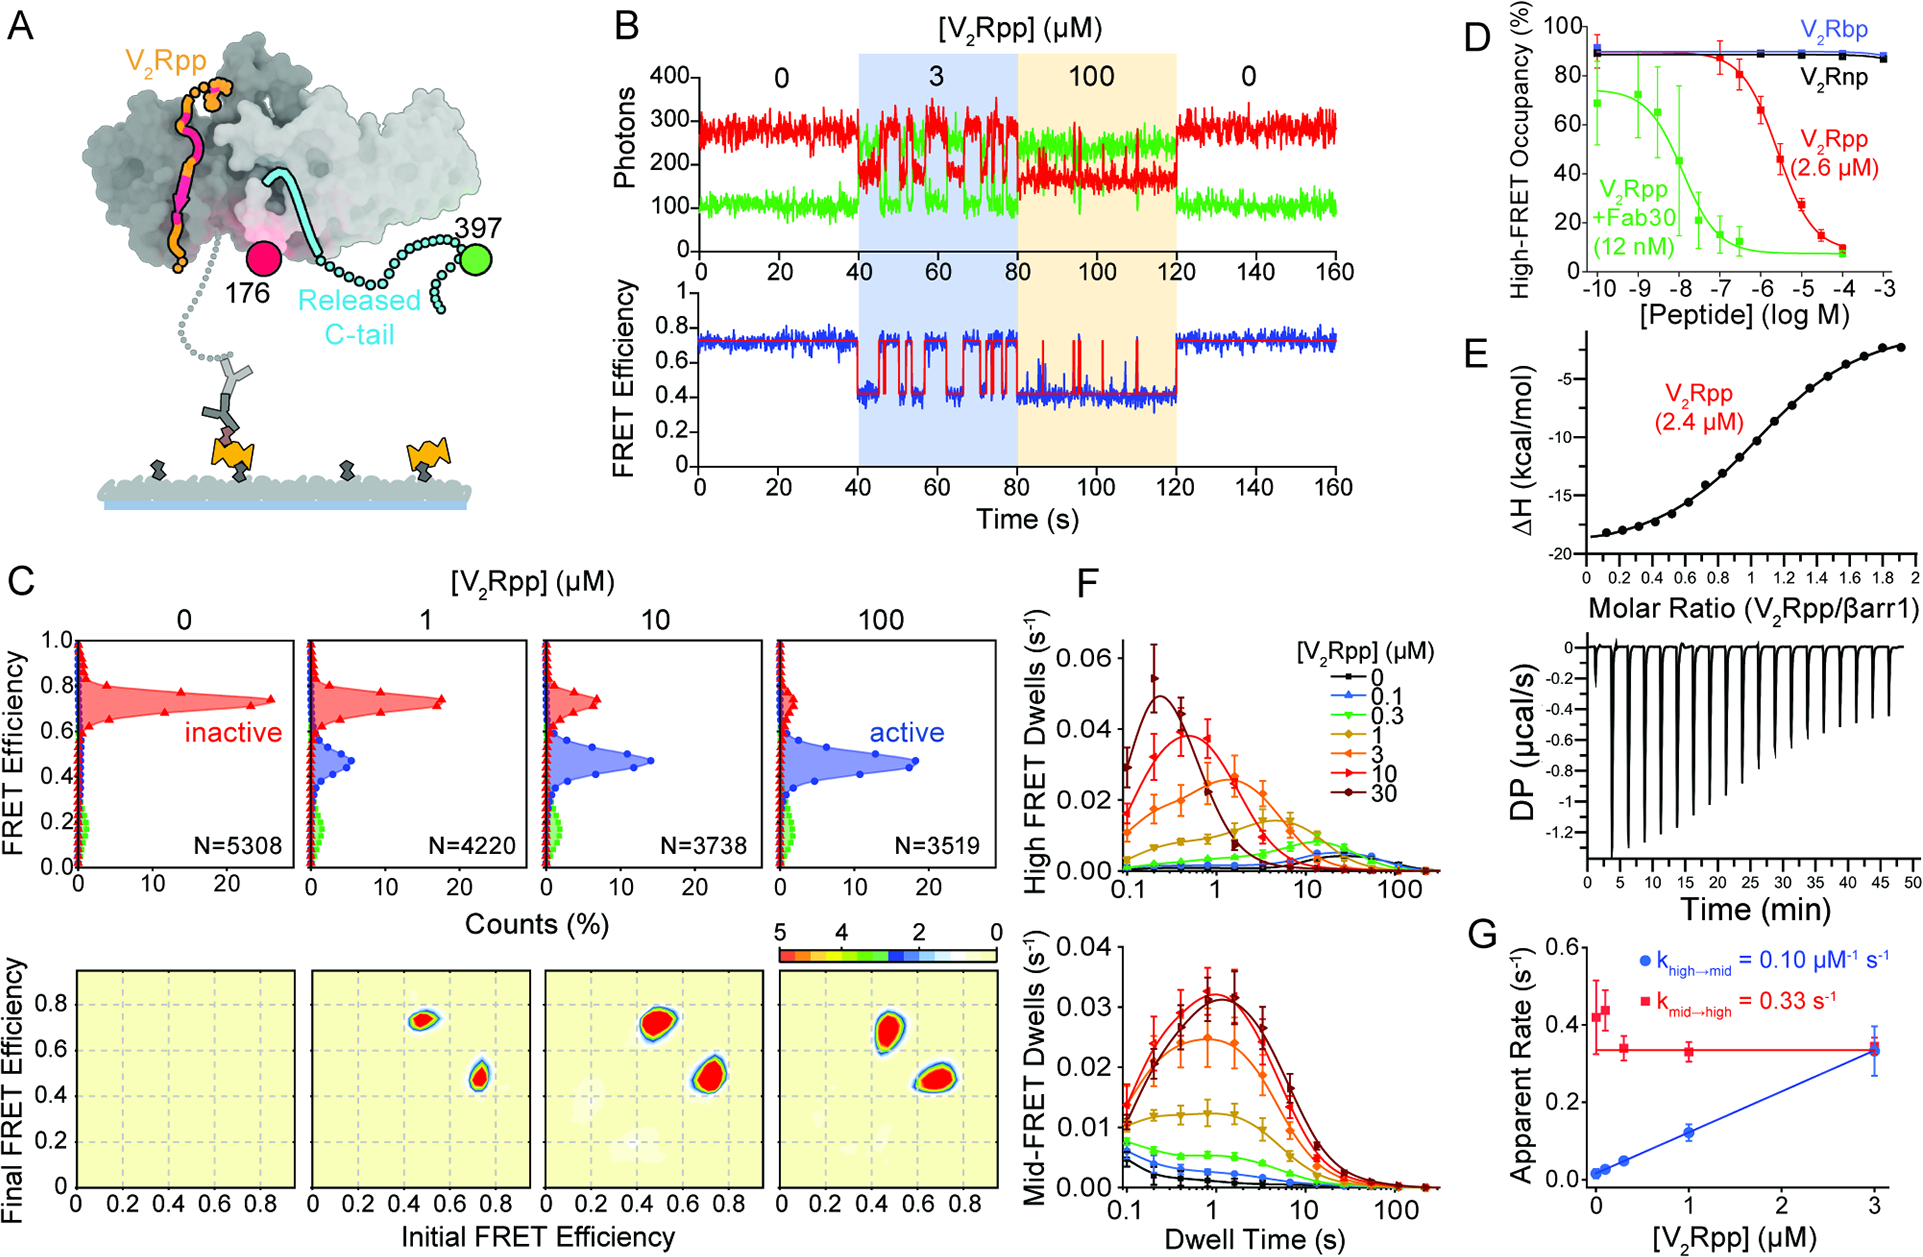
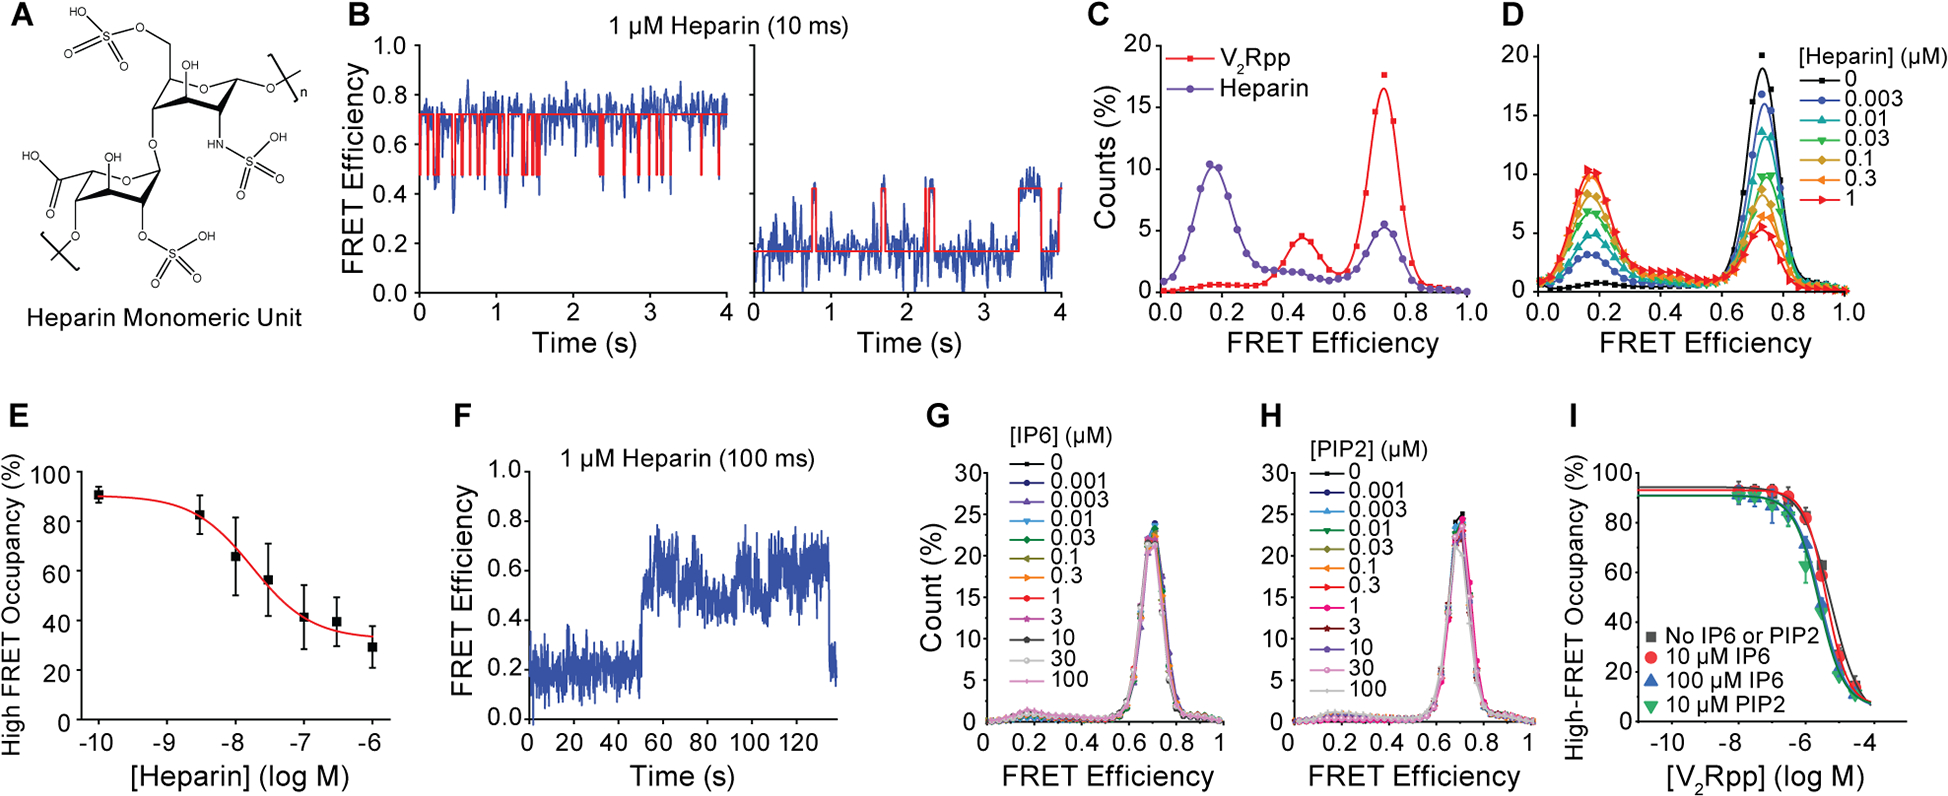
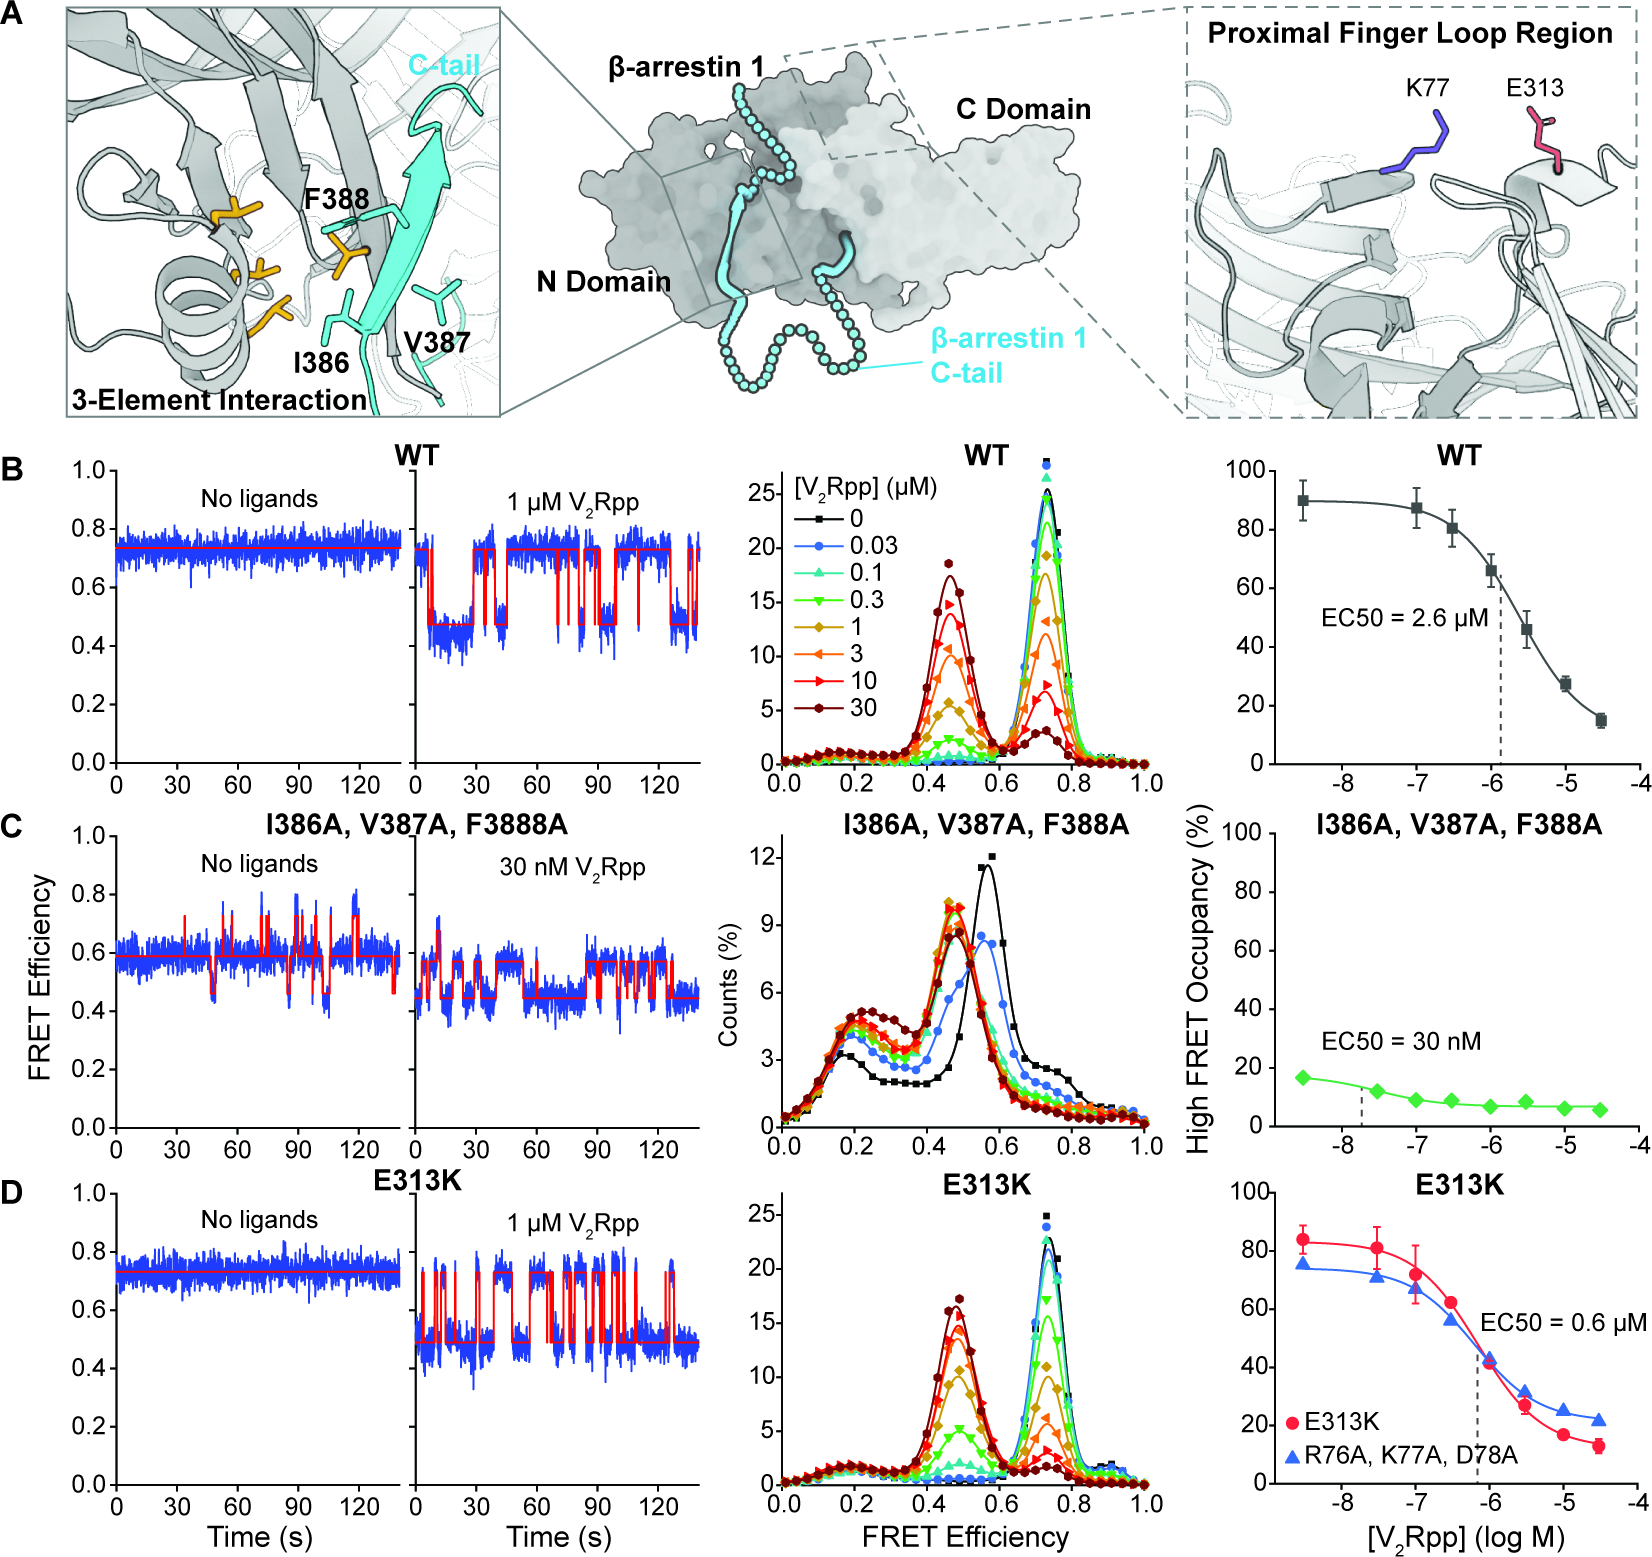
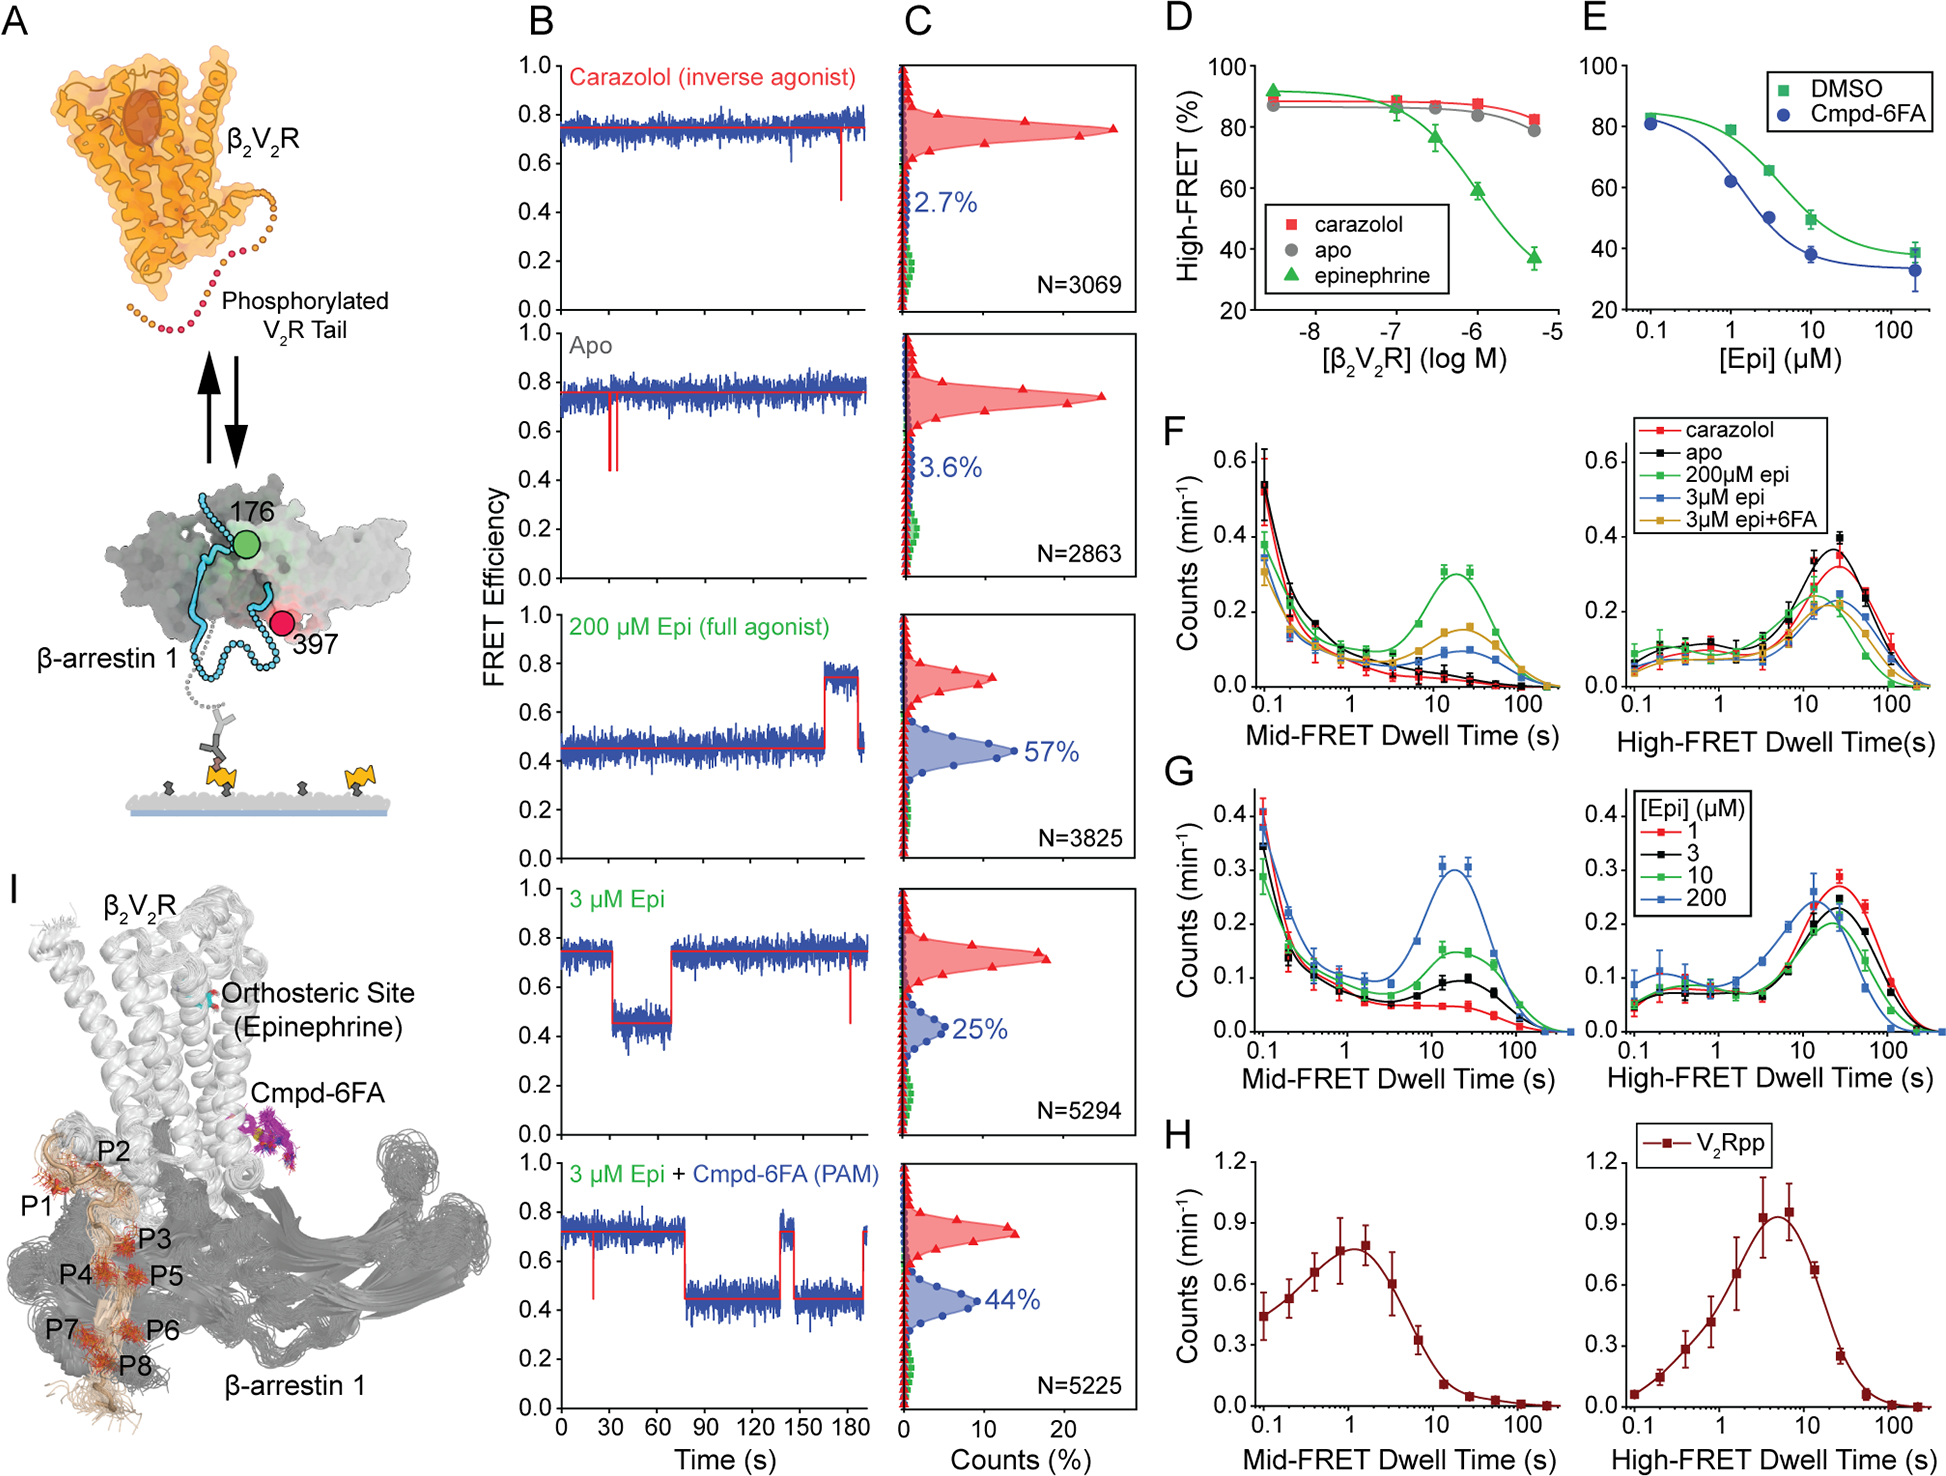
β-arrestins bind G protein-coupled receptors to terminate G protein signaling and to facilitate other downstream signaling pathways. Using single-molecule fluorescence resonance energy transfer imaging, we show that β-arrestin is strongly autoinhibited in its basal state. Its engagement with a phosphopeptide mimicking phosphorylated receptor tail efficiently releases the β-arrestin tail from its N domain to assume distinct conformations. Unexpectedly, we find that β-arrestin binding to phosphorylated receptor, with a phosphorylation barcode identical to the isolated phosphopeptide, is highly inefficient and that agonist-promoted receptor activation is required for β-arrestin activation, consistent with the release of a sequestered receptor C tail. These findings, together with focused cellular investigations, reveal that agonism and receptor C-tail release are specific determinants of the rate and efficiency of β-arrestin activation by phosphorylated receptor. We infer that receptor phosphorylation patterns, in combination with receptor agonism, synergistically establish the strength and specificity with which diverse, downstream β-arrestin-mediated events are directed.

Keywords: G protein-coupled receptor; GPCR; agonist; arrestin; conformational dynamics; phosphorylation; phosphorylation barcode; receptor signaling; single-molecule FRET; β-arrestin.


Conflict of interest statement

Declaration of interests S.C.B. has an equity interest in Lumidyne Technologies.

Figures

Figure 1.
Figure 1.. β-arrestin1 C-tail dynamic behavior in the basal state.
A, Schematic of βarr binding to an agonist-activated GPCR in the plasma membrane. B, Representative MD frames of simulated βarr1 in the inactive state showing the distal βarr1 tail outside the extended groove. C, MD frames from a subset of these simulations showing the distal tail can dock within the extended groove, bringing the mean dye positions closer together. D, Schematic of the smFRET experiment with fluorophore (green and red circles)-labeled βarr1 tail sensor tethered to an imaging surface. E, Representative single-molecule fluorescence (top; donor in green, acceptor in red) and FRET (bottom; blue) time traces of surface-tethered βarr1 recorded with 100 ms time resolution in the absence of ligands, with a rare excursion out of the basal state to a ~0.89 FRET state.
Figure 2.
Figure 2.. Activation of β-arrestin1 by V2Rpp.
A, Schematic of the smFRET experiment where V2Rpp (orange with red for phosphorylation sites) binding induces βarr1 tail (cyan) disengagement. B, Representative single-molecule traces with state assignment (bottom, red line);surface-tethered βarr1 tail sensor was sequentially exposed to buffer containing the indicated V2Rpp concentrations (shaded areas). C, Population smFRET histograms for inactive (red) and active (blue and green) states (top; N, number of traces) and corresponding transition density plots displaying the mean FRET values before (x axis) and after (y axis) each transition (bottom; scale bar, 10−3 transitions per bin per second) in the presence of the indicated V2Rpp concentrations. D, Ensemble average high FRET inactive state occupancy induced by increasing concentrations of various peptides: V2Rpp (red), V2Rpp with 0.1 μM Fab30 (green), V2Rbp (blue), and V2Rnp (black). Lines are fits to dose-response functions with Hill slope of 1.0 and EC50 of 2.6 μM for V2Rpp alone and 0.012 μM for V2Rpp with Fab30, respectively. E, Analysis of V2Rpp interaction with wildtype βarr1 by isothermal titration calorimetry (ITC). Representative binding isotherm (top) and thermogram (bottom), with the best titration curve fit are shown. Summary of thermodynamic parameters obtained by ITC: binding affinity (KD = 2.4 ± 0.2 μM), stoichiometry (N = 1.1 ± 0.1 sites), enthalpy (ΔH = −20.3 ± 0.4 kcal/mol), and entropy (−TΔS = 13.9 ± 2.0 kcal/mol). F, Dwell time histograms (symbols) in the inactive (top) and active (bottom) states from experiments corresponding to panels C-D with spline fits (lines). G, Apparent rate constants for V2Rpp binding (blue) and unbinding (red) of 0.10 μM−1 s−1 and 0.33 s−1, respectively. Error bars, mean ± S.D. of at least two repeats with at least 3,500 traces for each condition and a total of more than 33,000.
Figure 3.
Figure 3.. Activation of β-arrestin1 by heparin, IP6 and PIP2.
A, Structure of heparin. B, Representative smFRET traces from experiments imaging βarr1 tail sensor in the presence of 1 μM heparin with 10 ms time resolution. C, Overlay of FRET histograms experiments with 1 μM heparin (purple) and V2Rpp (red). D, FRET histograms and E, high-FRET state occupancy (symbols) from experiments imaging βarr1 tail sensor in the presence of the indicated concentrations of heparin. Line is a fit to a dose-response function (red line) with Hill slope of 1.0 and EC50 of 17 nM. F, Example trace recorded at 100 ms time resolution in the presence of 1 μM heparin showing rare switching between dynamic modes. Error bars, mean ± S.D. of two repeats. G, Population FRET histograms of βarr1 C tail sensor, imaged at 100 ms time resolution, with indicated concentrations of IP6 and H, PIP2. I, Ensemble average high-FRET inactive state occupancy as a function of V2Rpp concentrations in the absence and presence of indicated concentrations of IP6 or PIP2 (symbols) fit to dose-response functions (lines), revealing no substantial change in EC50 values.
Figure 4.
Figure 4.. Effect of activating mutations on β-arrestin1 tail disengagement.
A, Basal structure of βarr1 (PDB: 1G4M) showing regions and residues associated with the three-element interaction (left) and finger-loop proximal (right) mutants. B, WT-, C, I386A/V387A/F388A- and D, E313K-βarr1 tail sensor was imaged in the absence and presence of varying concentrations of V2Rpp. Left, Representative smFRET traces in the absence (left) and presence (right) of V2Rpp. Middle, population FRET histograms (symbols) with spline fits (lines). Right, ensemble average occupancy in the high-FRET inactive state as a function of V2Rpp concentration (symbols) fit to dose-response functions (lines) with Hill slope of 1.0 and EC50 values of 2.6(WT, black), 0.030 (3-EI mutant, green), 0.070 (E313K, red), and 0.063 μM (R76A/K77A/D78A, blue). Error bars, mean ± S.D. of at least two repeats.
Figure 5.
Figure 5.. Activation of β-arrestin1 by phosphorylated, agonist-bound receptor.
A, Schematic of the experiment showing βarr1 tethered to an imaging surface interacting with pβ2V2R free in solution and bound to ligands of varying efficacy. B, Representative FRET (blue) and state assignment (red) traces and C, population FRET histograms from smFRET imaging of βarr tail sensor conducted in the presence of 1 μM pβ2V2R and 10 μM carazolol, no ligands, 200 μM epi, 3 μM epi, or 3 μM epi with 10 μM Cmpd-6FA, respectively. D, High-FRET inactive state occupancy as a function of pβ2V2R concentration in the presence of saturating concentrations of the indicated receptor-binding ligand (symbols) fit to dose response functions (lines) with a Hill slope of 1 and EC50 values of 44 (carazolol; red), 30 (apo; gray), and 1.0 μM (epi; green). E, High-FRET inactive state occupancy from experiments conducted in the presence of 1 μM pβ2V2R and the indicated concentration of epinephrine in the absence (blue) and presence (green) of 10 μM Cmpd-6FA fit to dose response functions with Hill slope of 1.0 and EC50 values of 3.7 and 1.0 μM, respectively. F-H, Histograms of dwell times in the mid-FRET active (left) and high-FRET inactive (right) states: F, from experiments corresponding to panels B-C, G, from experiments with 1 μM pβ2V2R and the indicated concentrations of epinephrine, and H, from experiments with 1 μM V2Rpp duplicated from Figure 2 for comparison. I, Representative MD frames of the simulated pβ2V2R-βarr complex model bound to epinephrine (cyan) and Cmpd-6FA (magenta) showing the positions and dynamics of P1 to P8 in V2Rpp ( wheat color). Error bars, mean ± S.D. of two repeats.
Figure 6.
Figure 6.. The β2AR C-tail inhibits β-arrestin recruitment in living cells.
A, Schematic of the bystander BRET-based βarr membrane recruitment assay performed in living cells where the N-terminus of βarr is fused to the donor Rluc8 and a plasma membrane marker is fused to the acceptor citrine. Upon agonist stimulation, receptors with unmodified C-tails recruit βarr to the plasma membrane, resulting in an increase of BRET between the donor and acceptor molecules. B, Dose-response curves of βarr2 recruitment to the plasma membrane by wildtype (WT) β2AR (black squares) and β2AR-365tr (blue triangles) in HEK293 GRK2/3/5/6 knockout cells in the absence (GRK KO) or D, presence of GRK2 expression via transient transfection (GRK2 rescue). Dose-response curves of three independent experiments performed with triplicate samples (mean ± S. E.). C, βarr2 membrane recruitment by WT β2AR and β2AR-365tr in response to10 μM isoproterenol stimulation in the absence and E, presence of GRK2 transfection. Bars represents the mean ± S. E. of three independent experiments performed in triplicate. Symbols represent the measured drug-induced BRET value. **, p = 0.0056; ***, p = 0.0002, unpaired, two-tailed Mann-Whitney test.

Comment in

References

    1. Abreu N, Acosta-Ruiz A, Xiang G, and Levitz J (2021). Mechanisms of differential desensitization of metabotropic glutamate receptors. Cell Rep. 35, 109050. - PMC - PubMed
    1. Ahn S, Pani B, Kahsai AW, Olsen EK, Husemoen G, Vestergaard M, Jin L, Zhao S, Wingler LM, Rambarat PK, et al. (2018). Small-Molecule Positive Allosteric Modulators of the β2-Adrenoceptor Isolated from DNA-Encoded Libraries. Mol. Pharmacol 94, 850–861. - PMC - PubMed
    1. Asher WB, Geggier P, Holsey MD, Gilmore GT, Pati AK, Meszaros J, Terry DS, Mathiasen S, Kaliszewski MJ, McCauley MD, et al. (2021). Single-molecule FRET imaging of GPCR dimers in living cells. Nat. Methods 18, 397–405. - PMC - PubMed
    1. Attramadal H, Arriza JL, Aoki C, Dawson TM, Codina J, Kwatra MM, Snyder SH, Caron MG, and Lefkowitz RJ (1992). Beta-arrestin2, a novel member of the arrestin/beta-arrestin gene family. J. Biol. Chem 267, 17882–17890. - PubMed
    1. Blanchard SC, Gonzalez RL, Kim HD, Chu S, and Puglisi JD (2004). tRNA selection and kinetic proofreading in translation. Nat. Struct. Mol. Biol 11, 1008–1014. - PubMed

Publication types

MeSH terms