. 2022 Jul 1:376:109606.
doi: 10.1016/j.jneumeth.2022.109606. Epub 2022 Apr 26.

Measuring metabolic rate in single flies during sleep and waking states via indirect calorimetry

Affiliations

Measuring metabolic rate in single flies during sleep and waking states via indirect calorimetry

Elizabeth B Brown et al. J Neurosci Methods. .

Abstract

Background: Drosophila melanogaster is a leading genetic model for studying the neural regulation of sleep. Sleep is associated with changes in behavior and physiological state that are largely conserved across species. The investigation of sleep in flies has predominantly focused on behavioral readouts of sleep because physiological measurements, including changes in brain activity and metabolic rate, are less accessible. We have previously used stop-flow indirect calorimetry to measure whole body metabolic rate in single flies and have shown that in flies, like mammals, metabolic rate is reduced during sleep.

New method: Here, we describe a modified version of this system that allows for efficient and highly sensitive acquisition of CO2 output from single flies.

Results: In this modified system, we show that sleep-dependent changes in metabolic rate are diminished in aging flies, supporting the notion that sleep quality is reduced as flies age. We also describe a modification that allows for simultaneous acquisition of CO2 and O2 levels, providing a respiratory quotient that quantifies how metabolic stores are utilized. We find that the respiratory quotient identified in flies on an all-sugar diet is suggestive of lipogenesis, where the dietary sugar provided to the flies is being converted to fat.

Comparison with existing methods and conclusions: Taken together, the measurement of metabolic rate via indirect calorimetry not only provides a physiological readout of sleep depth, but also provides insight the metabolic regulation of nutrient utilization, with broad applications to genetic studies in flies.

Keywords: Aging; CO(2) output; Drosophila; Indirect calorimetry; Metabolism.


Conflict of interest statement

DECLARATIONS OF INTEREST

An author of this manuscript has the following competing interests: JK is employed by Sable Systems International, which designs and sells metabolic systems. The system design and analysis performed here required custom set up and programming. Therefore, we feel that he meets the requirements outlined in the journal for authorship.

Figures
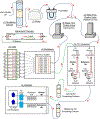
Figure 1 –
Figure 1 –. Single fly system overview
The Sleep, Activity, and Metabolic Monitor (SAMM) system can be used to measure sleep and CO2 output in single flies. Individual flies were fed 5% sucrose, during which sleep and CO2 output was measured over the course of 24 hours. Zero-grade air is first passed through a scrubbing column (1). The resulting dehumidified, CO2-free air is then re-humidified and pumped to two mass-flow control valves to maintain constant air flow into the system (2). One mass flow control valve regulates clean, reference air flow directly to the CO2 analyzer. The other mass flow control valve regulates air flow to the multiplexer, which directs the sampling of CO2 that accumulates in each behavioral chamber over a specified time-period (4). The behavioral chambers are housed inside a Drosophila Activity Monitor (DAM), allowing for the simultaneous measurement of CO2 output and activity/sleep (3). The accumulated air from each behavior chamber is then sent to the CO2 analyzer, where the reference air is subtracted from the air collected from each behavioral chamber to determine CO2 output for each individual fly (5). Both the reference and animal air were then passed individually through scrubbing columns before entering the O2 analyzer, where the reference air is again subtracted from the air collected from each behavioral chamber to determine O2 consumed for each group of flies. A detailed description of each component can be found in the ‘Measurement of CO2 output’ section of the Methods.
Figure 2 –
Figure 2 –. Single fly system data males/females
Nighttime sleep and CO2 output are reduced in male flies. (A) Schematic of experimental design. Sleep and CO2 output were assessed in male and female flies for 24 hrs on 5% sucrose. ZT=0 indicates time of lights on, while ZT=12 indicates time of lights off. (B) Sleep profile of female and male flies. (C) There is a significant effect of sex (two-way ANOVA: F1,156 = 21.32, P<0.0001, N = 40 per sex) and time of day (two-way ANOVA: F1,156 = 39.00, P<0.0001, N = 40 per sex) on sleep duration. Females sleep significantly more at night (P<0.0001), while no significant differences in sleep duration between day and night was observed in males (P=0.8362). Females also sleep significantly more than males during the night (P<0.0001), but no significant differences in sleep duration was observed between the sexes during the day (P=0.1798). (D) Representative trace from an individual female and male, indicating the unadjusted amount of CO2 produced over a 5 min time period (ppm: parts per million). (E) Profile of CO2 output of female and male flies. (F) There is a significant effect of sex (two-way ANOVA: F1,156 = 38.55, P<0.0001, N = 40 per sex) and time of day (two-way ANOVA: F1,156 = 12.47, P=0.0005, N = 40 per sex) on CO2 output. CO2 output is significantly higher in females during the day, relative to the night (P=0.0003), while no significant differences in CO2 output between day and night was observed in males (P=0.4760).CO2 output is also significantly higher in females both during the day (P<0.0001) and night (P=0.0065), compared to males. (G) Linear regression of daytime CO2 output as a function of time asleep for both males and females. The slope of each regression is significantly different from zero (females: F1,399 = 74.92, P<0.0001; males: F1,390 = 137.3, P<0.0001) as well as significantly different from each other (ANCOVA with time asleep as the covariate: F1,789 = 4.682, P=0.0308). (H) Linear regression of nighttime CO2 output as a function of time asleep for both males and females. The slope of each regression is significantly different from zero (females: F1,432 = 43.32, P<0.0001; males: F1,376 = 80.53, P<0.0001) as well as significantly different from each other (ANCOVA with time asleep as the covariate: F1,808 = 7.925, P=0.0050). For profiles and linear regressions, white background indicates daytime, while gray background indicates nighttime. ZT indicates zeitgeber time. Error bars represent +/− standard error from the mean. Grey dots represent measurements of individual flies. ** = P<0.01; **** = P<0.0001.
Figure 3
Figure 3. Single fly system details with sleep/metabolism breakdown with aging flies
Aging reduces sleep duration and metabolic rate during waking in female flies. (A) Schematic of experimental design. Sleep and CO2 output were assessed in young, 10 day-old flies and old 40-day old flies for 24 hrs on 5% sucrose. ZT=0 indicates time of lights on, while ZT=12 indicates time of lights off. (B) Sleep profile of 10 day-old flies and 40 day-old flies. (C) There is a significant effect of age (two-way ANOVA: F1,152 = 213.4, P<0.0001, N = 37–41) and time of day (two-way ANOVA: F11520 = 235.6, P<0.0001, N = 37–41) on sleep duration. For both ages, sleep duration is significantly higher during the night, relative to the day (10d: P<0.0001; 40d: P<0.0001). Sleep duration is significantly reduced in 40 day-old flies both during the day (P<0.0001) and night (P<0.0001), compared to 10 day-old flies. (D) Bout length is significantly reduced in 40 day-old flies, compared to 10 day-old flies (t-test: t73=9.318, P<0.0001). (E) Bout number is significantly increased in 40 day-old flies, compared to 10 day-old flies (t-test: t73=04.659, P<0.0001). (F) Waking activity is significantly increased in 40 day-old flies, compared to 10 day-old flies (t-test: t73=2.558, P=0.0126). (G) Representative CO2 trace from an individual 10 day-old and 40 day-old fly. (H) Profile of CO2 output of young, 10 day-old flies and old, 40 day-old flies. (I) There is no effect of age on CO2 output (two-way ANOVA: F1,152 = 3.155, P=0.0777, N = 37–41), but there is an effect of time of day (two-way ANOVA: F1,152 = 108.3, P<0.0001, N = 37–41) on CO2 output. At both ages, CO2 output is significantly higher during the day, relative to the night (10d: P<0.0001; 40d: P<0.0001). (J) When awake, there is a significant effect of age (two-way ANOVA: F1,154 = 15.90, P<0.0001, N = 37–41) and time of day (two-way ANOVA: F1,154 = 17.03, P<0.0001, N = 37–41) on CO2 output. For both ages, CO2 output is significantly higher during the day, relative to the night (10d: P<0.0457; 40d: P<0.0007). CO2 output is also significantly reduced in 40 day-old flies both during the day (P<0.0487) and night (P<0.0015), compared to 10 day-old flies. (K) When sleeping, there is no effect of age (two-way ANOVA: F1,154 = 1.794, P<0.1827, N = 37–41), but there is a significant effect of time of day (two-way ANOVA: F1,154 = 69.18, P<0.0001, N = 37–41) on CO2 output. For both ages, CO2 output is significantly higher during the day, relative to the night (10d: P<0.0001; 40d: P<0.0001). (L) Linear regression of daytime CO2 output as a function of time asleep for 10 day-old and 40 day-old flies. The slope of 10 day-old flies is significantly different from zero (F1,420 = 104.6, P<0.0001), while the slope of 40 day-old flies is not (F1,304 = 3.191, P<0.0751). They are, however, significantly different from each other (ANCOVA: F1,724 = 18.55, P<0.0001). (M) Linear regression of nighttime CO2 output as a function of time asleep for 10 day-old and 40 day-old flies. The slope of each regression is significantly different from zero (10d: F1,427 = 47.37, P<0.0001; 40d: F1,475 = 17.85, P<0.0001) as well as significantly different from each other (ANCOVA: F1,902 = 5.841, P=0.0159). For profiles and liner regressions, white background indicates daytime, while gray background indicates nighttime. ZT indicates zeitgeber time. Error bars represent +/− standard error from the mean. Grey dots represent measurements of individual flies. * = P<0.05; ** = P<0.01; *** = P<0.001; **** = P<0.0001.
Figure 4 –
Figure 4 –. O2 measurements and group data with males/females.
The Sleep, Activity, and Metabolic Monitor (SAMM) system can be used to measure CO2 output and O2 consumption in groups of flies. Groups of 25 flies were fed 5% sucrose, during which both CO2 and O2 were measured, as described in Figure 1, over the course of 24 hours. (A) Profile of CO2 output in female and male flies. (B) There is a significant effect of sex (two-way ANOVA: F1,80 = 85.25, P<0.0001, N = 21 per sex) and time of day (two-way ANOVA: F1,80 = 29.24, P<0.0001, N = 21 per sex) on CO2 output. For both sexes, CO2 output is significantly higher during the day, relative to the night (females: P<0.0001; males: P=0.0301). CO2 output is also significantly higher in males both during the day (P<0.0001) and night (P<0.0001), compared to females. (C) Profile of O2 consumption in female and male flies. (D) There is a significant effect of sex (two-way ANOVA: F1,80 = 95.36, P<0.0001, N = 21 per sex) and time of day (two-way ANOVA: F1,80 = 18.72, P<0.0001, N = 21 per sex) on O2 consumption. For both sexes, O2 consumption is significantly higher during the day, relative to the night (females: P<0.0001; males: P=0.0125). O2 consumption is also significantly higher in females both during the day (P<0.0001) and night (P<0.0001), compared to males. (E) Profile of the respiratory quotient (CO2 output / O2 consumption) in female and male flies. (F) There is no significant difference in the respiratory quotient between male and females (two-way ANOVA: F1,80 = 0.1353, P=0.7140, N = 21 per sex). For profiles, white background indicates daytime, while gray background indicates nighttime. ZT indicates zeitgeber time. Error bars represent +/− standard error from the mean. Grey dots represent measurements of individual flies. **** = P<0.0001.

Similar articles

Cited by

References

    1. Artiushin G, & Sehgal A (2017) The Drosophila circuitry of sleep–wake regulation. Curr Opin Neurobiol. 44:243–250. 10.1016/j.conb.2017.03.004 - DOI - PMC - PubMed
    1. Aurora RN, & Punjabi NM (2013) Obstructive sleep apnoea and type 2 diabetes mellitus: A bidirectional association. Lancet Respir Med. 1(4):329–338. 10.1016/S2213-2600(13)70039-0 - DOI - PubMed
    1. Bland ML (2016). Measurement of carbon dioxide production from radiolabeled substrates in Drosophila melanogaster. J Vis Exp. 112:e54045. 10.3791/54045 - DOI - PMC - PubMed
    1. Botero V, Stanhope BA, Brown EB, Grenci EC, Boto T, Park SJ, King LB, Murphy KR, Colodner KJ, Walker JA, Keene AC, Ja WW, & Tomchik SM (2021) Neurofibromin regulates metabolic rate via neuronal mechanisms in Drosophila. 12(1):4385. 10.1038/s41467-021-24505-x. - DOI - PMC - PubMed
    1. Brown EB, Shah KD, Faville R, Kottler B, & Keene AC (2020) Drosophila insulin-like peptide 2 mediates dietary regulation of sleep intensity. PLoS Genet. 16(3):e1008270. 10.1371/journal.pgen.1008270 - DOI - PMC - PubMed

Publication types

LinkOut - more resources