. 2022 Jun 1:444:116032.
doi: 10.1016/j.taap.2022.116032. Epub 2022 Apr 26.

Combining phenotypic profiling and targeted RNA-Seq reveals linkages between transcriptional perturbations and chemical effects on cell morphology: Retinoic acid as an example

Affiliations

Combining phenotypic profiling and targeted RNA-Seq reveals linkages between transcriptional perturbations and chemical effects on cell morphology: Retinoic acid as an example

Johanna Nyffeler et al. Toxicol Appl Pharmacol. .

Abstract

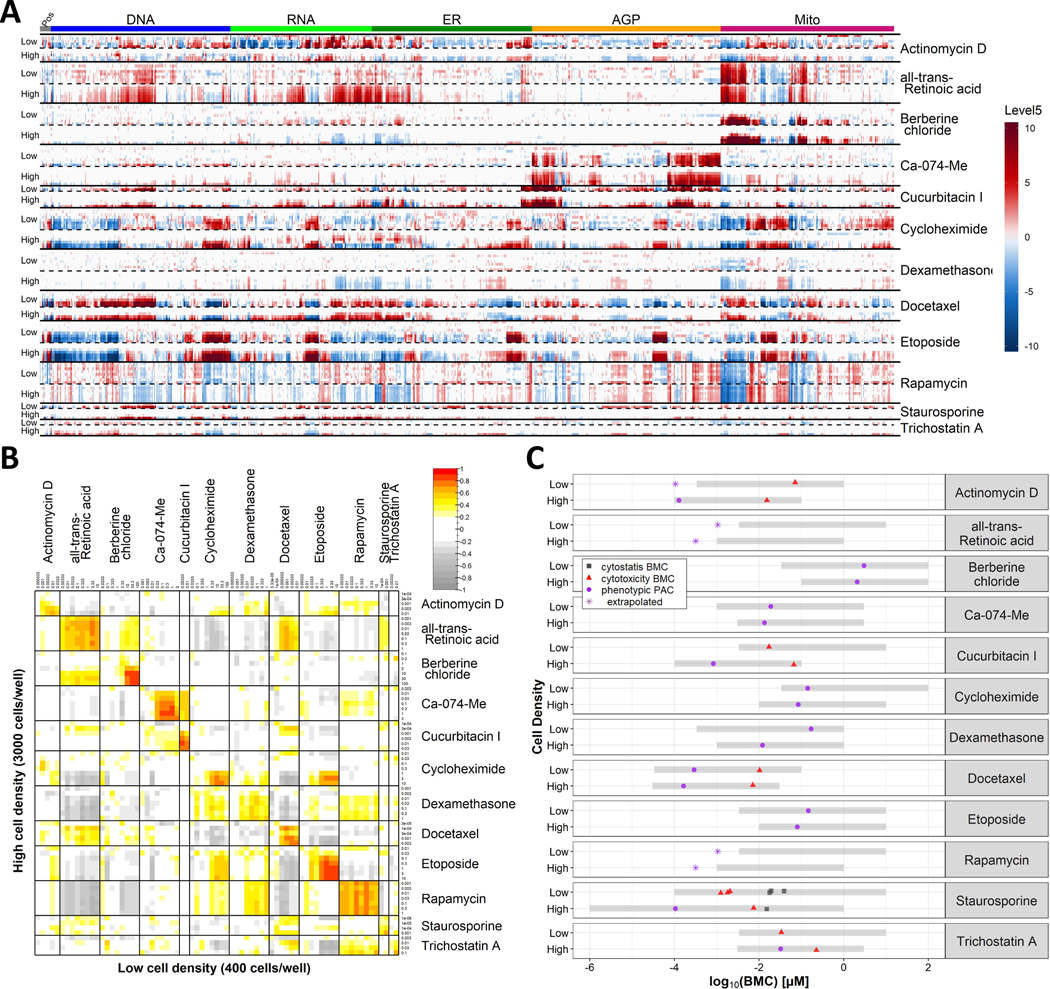
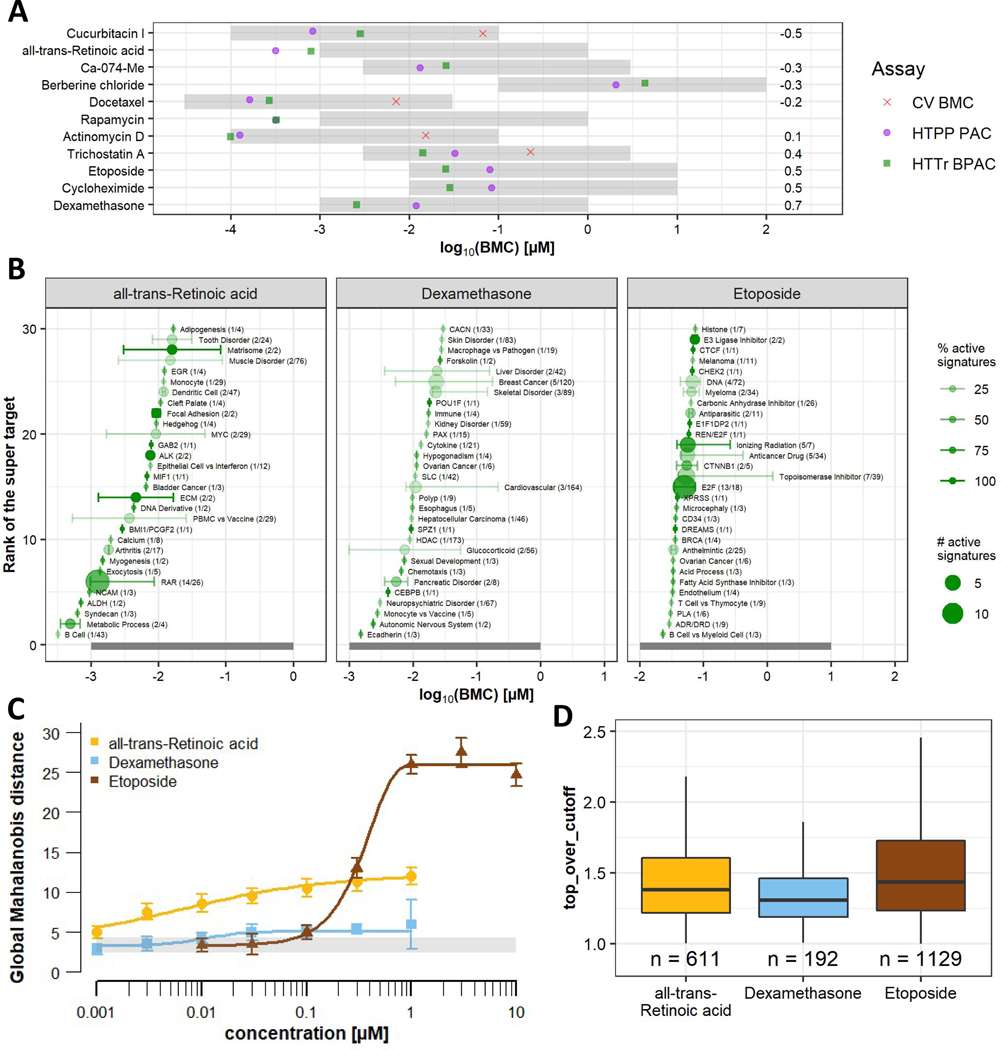
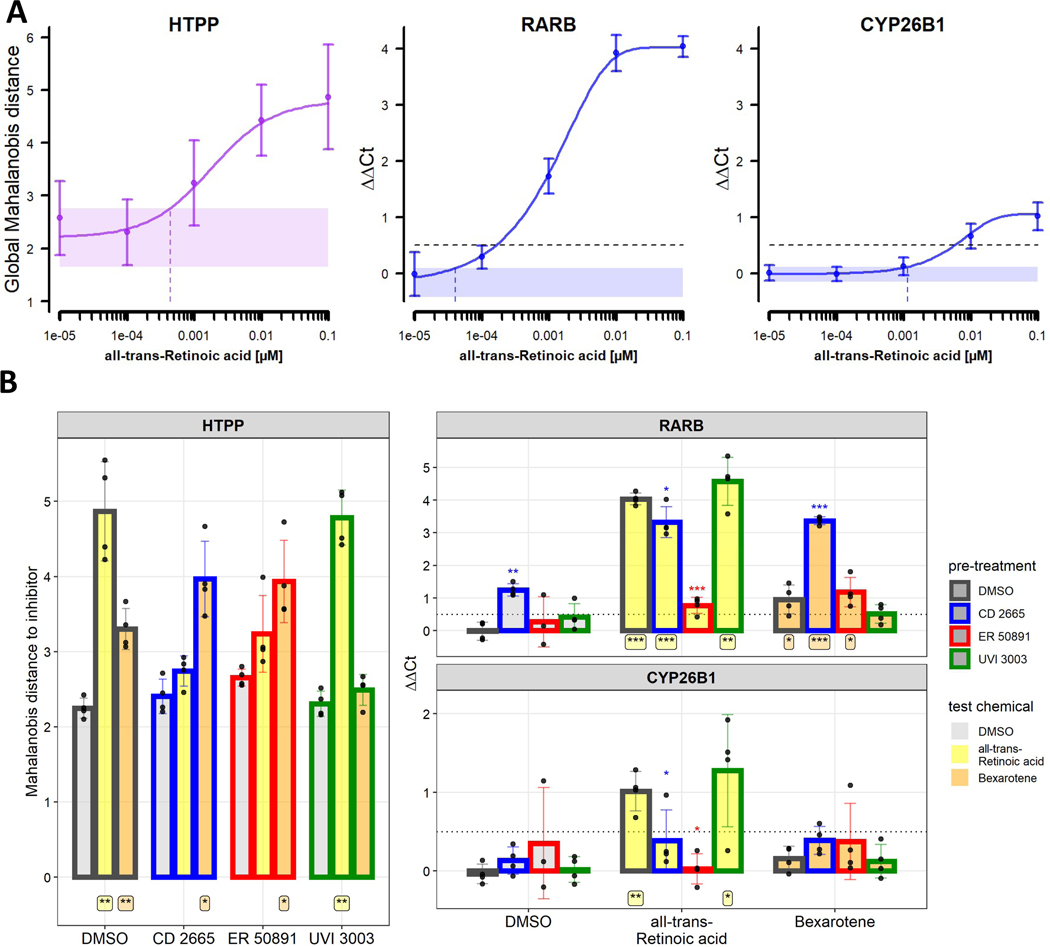
The United States Environmental Protection Agency has proposed a tiered testing strategy for chemical hazard evaluation based on new approach methods (NAMs). The first tier includes in vitro profiling assays applicable to many (human) cell types, such as high-throughput transcriptomics (HTTr) and high-throughput phenotypic profiling (HTPP). The goals of this study were to: (1) harmonize the seeding density of U-2 OS human osteosarcoma cells for use in both assays; (2) compare HTTr- versus HTPP-derived potency estimates for 11 mechanistically diverse chemicals; (3) identify candidate reference chemicals for monitoring assay performance in future screens; and (4) characterize the transcriptional and phenotypic changes in detail for all-trans retinoic acid (ATRA) as a model compound known for its adverse effects on osteoblast differentiation. The results of this evaluation showed that (1) HTPP conducted at low (400 cells/well) and high (3000 cells/well) seeding densities yielded comparable potency estimates and similar phenotypic profiles for the tested chemicals; (2) HTPP and HTTr resulted in comparable potency estimates for changes in cellular morphology and gene expression, respectively; (3) three test chemicals (etoposide, ATRA, dexamethasone) produced concentration-dependent effects on cellular morphology and gene expression that were consistent with known modes-of-action, demonstrating their suitability for use as reference chemicals for monitoring assay performance; and (4) ATRA produced phenotypic changes that were highly similar to other retinoic acid receptor activators (AM580, arotinoid acid) and some retinoid X receptor activators (bexarotene, methoprene acid). This phenotype was observed concurrently with autoregulation of the RARB gene. Both effects were prevented by pre-treating U-2 OS cells with pharmacological antagonists of their respective receptors. Thus, the observed phenotype could be considered characteristic of retinoic acid pathway activation in U-2 OS cells. These findings lay the groundwork for combinatorial screening of chemicals using HTTr and HTPP to generate complementary information for the first tier of a NAM-based chemical hazard evaluation strategy.

Keywords: Cell Painting; Computational Toxicology; Concentration-Response; High-Throughput Phenotypic Profiling.


Conflict of interest statement

Conflict of Interest

The authors declare no conflict of interest. This manuscript has been reviewed by the Center for Computational Toxicology and Exposure, Office of Research and Development, U.S. Environmental Protection Agency, and approved for publication. Approval does not signify that the contents reflect the views of the Agency, nor does mention of trade names or commercial products constitute endorsement or recommendation for use.

Figures

Figure 1:
Figure 1:. High-throughput phenotypic profiling of candidate reference chemicals at two seeding densities.
Test chemicals were screened in concentration-response using the HTPP assay in U-2 OS cells seeded at low (400 cells/well) or high (3000 cells/well) densities. Data were collected across four independent cell cultures. The exposure duration was 24 h. (A) The columns represent the 1300 features measured per cell, arranged within the fluorescent channel, as indicated by the color key on top. Phenotypic profiles for each chemical are visualized in rows, with increasing test concentrations arrayed from top to bottom in each horizontal section of the heatmap. Only non-cytotoxic, non-cytostatic concentrations are shown. Results from low and high seeding densities for each chemical are shown in consecutive horizontal sections of the heatmap. (B) Correlation matrix of the similarity of phenotypic profiles, as measured with Pearson correlation. A Pearson correlation of > 0.75 (red) is considered a strong correlation. (C) Potency estimates for each chemical, expressed as benchmark concentration (BMC). The cytotoxicity BMC (red triangles) is defined as an increase in % propidium-iodide positive cells. The cytostasis BMC (gray squares) is the EC50 of the normalized cell count. The phenotype altering concentration (PAC) (purple circles) is the concentration at which the phenotype was different from control. The gray shading indicates the tested concentration range for each chemical, which can be different between the two seeding densities. If the potency is below the tested range, it is set at ½ an order of magnitude below the lowest tested concentration and marked accordingly. For three chemicals (cucurbitacin I, staurosporine, trichostatin A) a PAC could not be estimated for the lower seeding density because too few non-cytotoxic concentrations were available for modeling. Abbreviations: AGP: actin, golgi, plasma membrane; ER: endoplasmic reticulum; Mito: mitochondria; Pos: position (features not associated with a particular channel).
Figure 2:
Figure 2:. Comparison of high-throughput transcriptomics and high-throughput phenotypic profiling.
Test chemicals were screened in concentration-response using the HTTr assay in U-2 OS cells seeded at high (3000 cells/well) density. The exposure duration was 24 h. (A) Comparison of the chemical-wise BPAC from HTTr (green squares), PAC from HTPP (purple circles), and cell viability BMC (red crosses). The numbers to the right indicate the difference between the HTPP and HTTr potency on the log scale. The gray shaded area indicates the tested concentration range of each chemical. Chemicals with BPACs below the tested concentration range were set to ½ an order of magnitude below the lowest tested concentration. (B) Accumulation plots of active signatures from HTTr, summarized by super target. Each graph displays the 30 most sensitive super target classes. The point and stems represent the median and the 10th and 90th percentile, respectively. The numbers in parentheses are the number of affected signatures and the number of total signatures in the signature catalog associated with the super target, respectively. The size of the points corresponds to the number of active signature and the shade of the point and stem (from light to dark) represents the percentage of signatures that were active in each super target class. The gray shaded area indicates the tested concentration range for each chemical. (C) Concentration-response curves from HTPP modeling global Mahalanobis distances. The gray shaded area indicates the noise level (median ± nMAD). (D) Efficacy measures (expressed as ‘top over cutoff’) for concentration-response modelled signature score data of all active signatures. The number of active signatures (n) is indicated on the plot.
Figure 3:
Figure 3:. High-throughput phenotypic profiling of retinoic acid pathway modulators.
Chemicals were screened in concentration-response using the HTPP assay in U-2 OS cells seeded at high (3000 cells/well) density. The exposure duration was 24 h. Data were collected across four independent cell cultures. (A) The columns represent the 1300 features, arranged within the fluorescent channel, as indicated by the color key on top. Phenotypic profiles for each chemical are visualized in rows, with increasing test concentrations arrayed from top to bottom in each horizontal section of the heatmap. Saccharin and sorbitol served as negative controls, while dexamethasone and etoposide served as reference chemicals (assay controls). (B) Correlation matrix of the similarity of phenotypic profiles, as measured with Pearson correlation. (C) Representative images of cells treated with ATRA (1 μM in 0.5% DMSO) or solvent alone (0.5% DMSO) for 24 h. ATRA produced subtle, but reproducible, changes in mitochondrial morphology. The radial distribution of mitochondria in the perinuclear region tends to be less symmetrical and more compact in ATRA treated cells. Compare the patterns in cells marked with arrowheads. Top row: Pseudo color composite image displaying the nucleus and mitochondria fluorescent channels only. Bottom row: Transformed image of mitochondria fluorescent labeling using background intensity subtraction. (D) Cell-level results of cells treated with ATRA (1 μM) or solvent alone (0.5% DMSO) for 24 h. The feature ‘Mito_Cells_Morph_STAR_Threshold_Compactness_40%_SP-Filter’ corresponds to a measure of compactness measured in the transformed image using the sliding parabola filter. Abbreviations: AGP: actin, golgi, plasma membrane; ER: endoplasmic reticulum; Mito: mitochondria; Pos: position (features not associated with a particular channel).
Figure 4:
Figure 4:. Combined effects of retinoic acid pathway modulators on phenotypic profiles.
U-2 OS cells were pre-treated with a single concentration of the RAR antagonists CD 2665 (10 μM), ER 50891 (1 μM), the RXR antagonist UVI 3003 (10 μM) or the RA synthesis inhibitor citral (100 μM) for 1 h, prior to treatment with the test chemicals listed in Table 2 (e.g. RAR/RXR agonists, RA metabolism inhibitor, reference chemicals, negative control) in concentration-response for an additional 24 h. Results are displayed as the average of four biological replicates, with the exception of treatments with ER 50891, which was interfering with cell segmentation in one biological replicate. (A) Phenotypic profiles for reference chemicals, and ATRA. The columns represent the 1300 features, arranged within the fluorescent channel, as indicated by the color key on top. Profiles are arranged in rows for individual treatments, with increasing chemical concentration from top to bottom within each horizontal section of the heatmap. The black arrows highlight two groups of features that are affected by ATRA treatment, but not affected when cells were pretreated with RAR antagonists. (B) Concentration-response curves for test chemicals pre-treated with the different modulators. Global Mahalanobis distance of each well was calculated relative to the mean of wells (n=24 per biological replicate) of the corresponding pre-treatment (in absence of the test chemical). In this graph, the Mahalanobis distances of the pre-treatment wells is subtracted, so that all curves start at 0. The stars indicate the phenotype altering concentration (PAC, i.e. the concentration at which the signal exceeded 1 * nMAD of the noise). (C) Overview of the PACs for the curves displayed in (B). The gray boxes indicate the tested concentration range. The error bar indicates the lower and upper bound (95% confidence interval) of the potency estimates. The pre-treatments were spread across two plates per biological replicate, hence there are two values for pre-treatment with DMSO. Sequential treatments that did not result in a PAC are displayed as open circles ½ an order of magnitude above the highest tested concentration. Abbreviations: AGP: actin, golgi, plasma membrane; ER: endoplasmic reticulum; Mito: mitochondria; PAC: phenotype altering concentration; Pos: position (features not associated with a particular channel).
Figure 5:
Figure 5:. Gene expression changes upon treatment with retinoic acid pathway modulators
U-2 OS cells were treated with the RA pathway modulators as explained in Figure 4. Experiments for HTPP and gene expression were conducted in parallel in 384-well and 96-well plates, respectively. Data were collected across four independent experiments, with six technical replicates for HTPP. (A) Concentration-response of cells treated with ATRA for 24 h. The left panel (in purple) represents HTPP results displayed as global Mahalanobis distance relative to vehicle control wells. The shaded area indicates the noise band (1 * nMAD of n=144 vehicle control wells). The dashed vertical line indicates the PAC. The two right panels (in blue) represent qPCR results for two genes, RARB and CYP26B1, expressed as difference in cycles (ΔΔCt) relative to the housekeeping gene ACTB and DMSO treatment. Positive numbers indicate upregulation relative to DMSO treatment. The shaded area indicates the noise band (1 * nMAD, derived from n=8 vehicle control wells that were not used for normalization). The dashed vertical lines indicate the BMC. The dashed horizontal line is at 0.5, indicating the threshold for a marked biological effect. (B) Combined effects of RA pathway modulators on phenotypic profiles (HTPP) and gene expression (RARB, CYP26B1). U-2 OS cells were pre-treated with the RAR antagonists CD 2665 (10 μM), ER 50891 (1 μM), or the RXR antagonist UVI 3003 (10 μM) for 1 h prior to treatment with the RAR agonist ATRA (100 nM) or RXR agonist bexarotene (100 nM) for 24 h. HTPP results are expressed as global Mahalanobis distances relative to the corresponding pre-treatment. The qPCR results are expressed as ΔΔCt values, as in (A). The filling of the bars corresponds to the test chemicals, while the multicolored outlines correspond to the pre-treatment. The bars represent mean +/− standard deviation of the four biological replicates. In these graphs, technical replicates within a biological replicate (e.g., plate) are averaged and represented as a single point. Statistical significance was calculated using paired, two-tailed t-tests. p-values for addition of the pre-treatment (vs. pre-treatment with DMSO alone) is indicated above the bars. p-values for addition of the test chemical (vs. DMSO alone) are indicated below the bars. *: p<0.05; **: p<0.01; ***: p<0.001.

Similar articles

Cited by

References

    1. Akaike H. (1974). New Look at Statistical-Model Identification. Ieee Transactions on Automatic Control, Ac19(6), 716–723. doi:Doi 10.1109/Tac.1974.1100705 - DOI
    1. Aktipis S, & Panayotatos N. (1981). A kinetic study on the mechanism of inhibition of RNA synthesis catalyzed by DNA-dependent RNA polymerase. Differences in inhibition by ethidium bromide, 3,8-diamino-6-ethylphenanthridinium bromide and actinomycin d. Biochim Biophys Acta, 655(3), 278–290. doi:10.1016/0005-2787(81)90038-1 - DOI - PubMed
    1. Barbie DA, Tamayo P, Boehm JS, Kim SY, Moody SE, Dunn IF, . . . Hahn WC (2009). Systematic RNA interference reveals that oncogenic KRAS-driven cancers require TBK1. Nature, 462(7269), 108–112. doi:10.1038/nature08460 - DOI - PMC - PubMed
    1. Becker T, Yang K, Caicedo JC, Wagner BK, Dancik V, Clemons P, . . . Carpenter AE (2020). Predicting compound activity from phenotypic profiles and chemical structures. bioRxiv, 2020.2012.2015.422887. doi:10.1101/2020.12.15.422887 - DOI - PMC - PubMed
    1. Blaskovich MA, Sun J, Cantor A, Turkson J, Jove R, & Sebti SM (2003). Discovery of JSI-124 (cucurbitacin I), a selective Janus kinase/signal transducer and activator of transcription 3 signaling pathway inhibitor with potent antitumor activity against human and murine cancer cells in mice. Cancer Res, 63(6), 1270–1279. - PubMed

Publication types