. 2022 Apr;10(4):e004412.
doi: 10.1136/jitc-2021-004412.

Immune cell infiltration pattern in non-small cell lung cancer PDX models is a model immanent feature and correlates with a distinct molecular and phenotypic make-up

Affiliations

Immune cell infiltration pattern in non-small cell lung cancer PDX models is a model immanent feature and correlates with a distinct molecular and phenotypic make-up

Eva Oswald et al. J Immunother Cancer. 2022 Apr.

Abstract

Background: The field of cancer immunology is rapidly moving towards innovative therapeutic strategies, resulting in the need for robust and predictive preclinical platforms reflecting the immunological response to cancer. Well characterized preclinical models are essential for the development of predictive biomarkers in the oncology as well as the immune-oncology space. In the current study, gold standard preclinical models are being refined and combined with novel image analysis tools to meet those requirements.

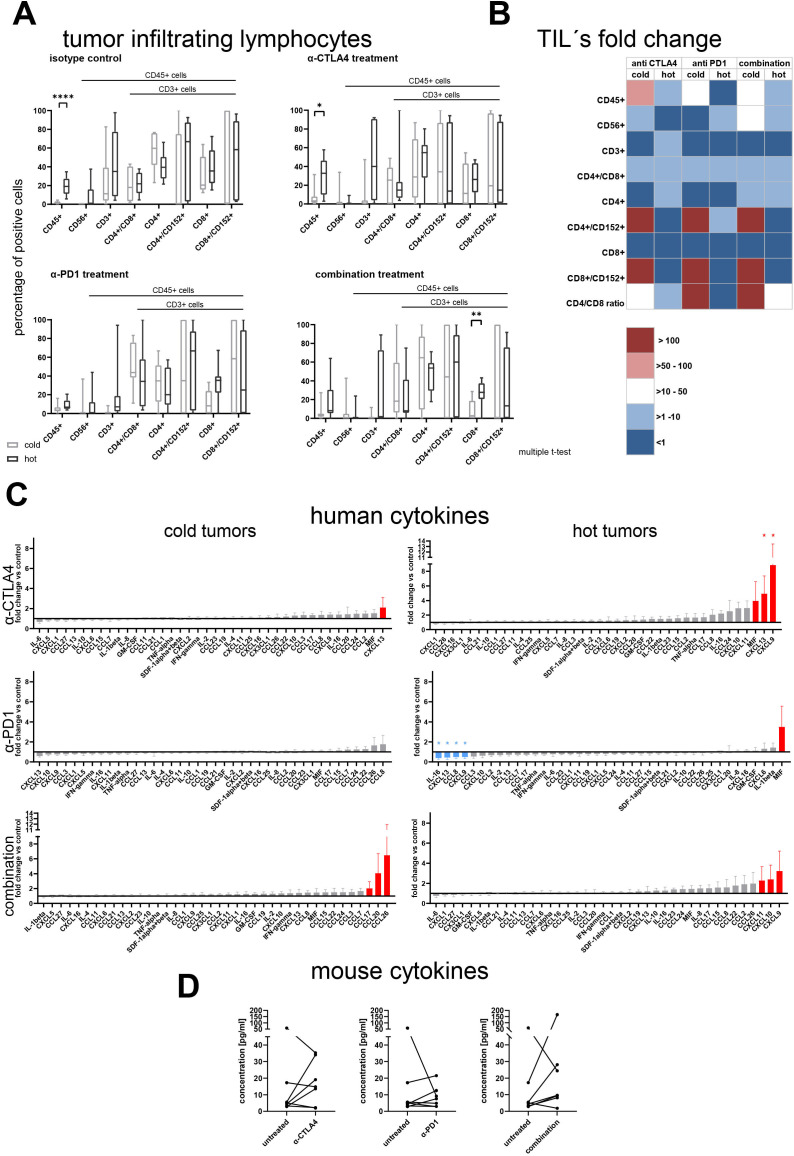
Methods: A panel of 14 non-small cell lung cancer patient-derived xenograft models (NSCLC PDX) was propagated in humanized NOD/Shi-scid/IL-2Rnull mice. The models were comprehensively characterized for relevant phenotypic and molecular features, including flow cytometry, immunohistochemistry, histology, whole exome sequencing and cytokine secretion.

Results: Models reflecting hot (>5% tumor-infiltrating lymphocytes/TILs) as opposed to cold tumors (<5% TILs) significantly differed regarding their cytokine profiles, molecular genetic aberrations, stroma content, and programmed cell death ligand-1 status. Treatment experiments including anti cytotoxic T-lymphocyte-associated protein 4, anti-programmed cell death 1 or the combination thereof across all 14 models in the single mouse trial format showed distinctive tumor growth response and spatial immune cell patterns as monitored by computerized analysis of digitized whole-slide images. Image analysis provided for the first time qualitative evaluation of the extent to which PDX models retain the histological features from their original human donors.

Conclusions: Deep phenotyping of PDX models in a humanized setting by combinations of computational pathology, immunohistochemistry, flow cytometry and proteomics enables the exhaustive analysis of innovative preclinical models and paves the way towards the development of translational biomarkers for immuno-oncology drugs.

Keywords: biomarkers, tumor; immunohistochemistry; lung neoplasms; tumor microenvironment.


Conflict of interest statement

Competing interests: None declared.

Figures

Figure 1
Figure 1
(A) Histological features of the selected non-small cell lung cancer PDX and corresponding patient tissue. H&E stains were prepared from formalin-fixed paraffine embedded samples of donor patient tissue as well as the fourth passage in NOD.Cg-PrkdcscidIl2rgtm1Wjl/SzJ mice of PDX derived thereof. Whole slides were scanned and 10 × magnification jpegs extracted of the scans (scale bar included). (B) A tissue classification algorithm was used to estimate the percentage of tissue classes within one scanned H&E stained slide. For each donor patient (pt) and for each PDX one H&E stained whole slide image was analyzed. The results are plotted as percentage of analyzed area. CA carcinoma; LXFA, lung cancer xenograft Freiburg, adenocarcinoma; LXFE, lung cancer xenograft Freiburg, epithelial; LXFL, lung cancer xenograft Freiburg, large cell; PDX, patient-derived xenograft.
Figure 2
Figure 2
(A) Flow cytometry analysis of human immune cells in tumor of humanized NOD.Cg-PrkdcscidIl2rgtm1Wjl/SzJ mice when tumor volume has reached 400–500 mm³. A total of 14 animals bearing 14 different models was analyzed. The individual data points are plotted as box plots with minimum and maximum as whiskers and median depicted as the line in the box. The percentage of CD45 +cells in the tumor tissue was used as classification criterion into cold (<5%) and hot (>5%) tumors, respectively. Following this criterion seven models were assigned to the group of cold tumors and the remaining seven to the group of hot tumors. (B) The levels of 38 human and 23 mouse cytokines in the tumor tissue of hot and cold tumors was determined for all 14 models. The absolute value of pg protein/mg tissue is plotted per cytokine and tumor model. The cytokines with a greater than twofold higher mean expression in hot tumors compared with cold tumors are highlighted in bold letters, the cytokines with a greater than twofold higher mean expression in cold tumors compared with hot tumors are underlined. The stars indicate statistical difference between the cold and the hot tumor group for a specific cytokine (Mann-Whitney test). (C) The influence of the presence of human immune cells in the murine host was determined by calculating the fold change of 38 human and 23 mouse cytokines in the humanized versus the non-humanized setting per model and plotted as heatmap. The stars indicate statistical difference between the non-humanized and the humanized tumor group for a specific cytokine (Mann-Whitney test). G-CSF, granulocyte colony stimulating factor; GM-CSF, granulocyte-macrophage colony-stimulating factor; IFN, interferon; IL, interleukin; LXFA, lung cancer xenograft Freiburg, adenocarcinoma; LXFE, lung cancer xenograft Freiburg, epithelial; LXFL, lung cancer xenograft Freiburg, large cell; TNF, tumor necrosis factor.
Figure 3
Figure 3
The PD-L1 expression was determined by IHC in 14 different NSCLC PDX in the presence or absence of human immune cells. (A) Whole slide scans were prepared, and representative 10× magnification jpegs were extracted of the scans (scale bar included). Quantification of the PD-L1 expression determined by IHC in a panel of 14 NSCLC PDX models, seven cold and seven hot tumor models. The DAB +area was determined using the OSANO software by analyzing one whole slide per tumor model in the presence and absence of human immune cells (total of 28 slides) (B) The influence of the presence of human immune cells in the murine host was determined by calculating the fold change of the DAB +area in the humanized versus the non-humanized setting per model and plotted as heatmap. (C) The comparison of the PD-L1 expression depicted as relative DAB +area (=percentage of analyzed area) on cold versus hot tumors. The individual data points are plotted as box plots with minimum and maximum as whiskers and median depicted as the line in the box. (D) Using whole slide images of H&E stained slides, the percentage of the tissue classes tumor, stroma and necrosis were measured by a tissue classification algorithm in 14 NSCLC PDX models propagated in humanized NOD.Cg-PrkdcscidIl2rgtm1Wjl/SzJ, seven cold and seven hot tumor models. The results are plotted as percentage of analyzed area. For each model one whole slide scan was analyzed (n=7 for cold and hot tumors, respectively). The individual data points are plotted as box plots with minimum and maximum as whiskers and median depicted as the line in the box. (E) Using whole slide images of H&E stained slides, the percentage of the tissue classes tumor, stroma and necrosis were measured by a tissue classification algorithm in 52 patient with NSCLC samples, 34 cold and 18 hot tumor models. The results are plotted as percentage of analyzed area. For each model one whole slide scan was analyzed (n=34 for cold and n=18 for hot tumors, respectively). The individual data points are plotted as box plots with minimum and maximum as whiskers and median depicted as the line in the box. DAB, 3,3′-Diaminobenzidin; IHC, immunohistochemistry; LXFA, lung cancer xenograft Freiburg, adenocarcinoma; LXFE, lung cancer xenograft Freiburg, epithelial; LXFL, lung cancer xenograft Freiburg, large cell; NSCLC, non-small cell lung cancer; PD-L1, programmed cell death ligand 1; PDX, patient-derived xenograft.
Figure 4
Figure 4
The sensitivity towards checkpoint inhibitor treatment of NSCLC PDX in monotherapy and combined therapy was tested in 14 NSCLC PDX models in the single mouse trial format. (A) The relative tumor volume at the last experiment day, with the tumor volume measured on the first day of treatment set as 100%, was plotted for the different treatment arms. Each dot represents one animal bearing a different NSCLC PDX model. The line is indicating the median of the respective group. The statistics in dark gray represent the analysis of all tumors per treatment arm (hot and cold). (B) The test/control value on the last experiment day was plotted for each treatment arm separately for the cold and the hot tumors. Each dot represents one tumor. The line is indicating the median of the respective group. The dotted line marks a test/control value of 50% indicating the threshold for responder versus non-responder. CTLA-4, cytotoxic T-lymphocyte-associated protein 4; NSCLC, non-small cell lung cancer; PD-1, programmed cell death 1; PDX, patient-derived xenograft.
Figure 5
Figure 5
(A) Flow cytometry analysis of human immune cells in tumor of tumor bearing humanized NOD.Cg-PrkdcscidIl2rgtm1Wjl/SzJ mice at the last experiment day. A total of 42 animals bearing 14 different patient-derived xenograft models was assigned to different treatment arms and analyzed for infiltration of human immune cells. The individual data points are plotted as box plots with minimum and maximum as whiskers and median depicted as the line in the box. The difference between cold and hot tumors was significant for CD45 +in the group receiving isotype control or anti CTLA-4 treatment and for CD8 +cells in the combination treatment arm (p<0.00013, p<0.041 and p<0.029, multiple t-tests). (B) The fold change of the different immune cell populations in comparison to the respective untreated control arm was calculated per individual experiment and model. The mean values of the fold changes for the cold and the hot tumors were plotted as a heatmap. (C) Human cytokine and chemokine secretion of hot and cold tumors under treatment with different CPi’s. The fold changes for the cold and the hot tumors were plotted as a column bar graph with mean and SE of the mean. The fold changes >2 are highlighted in red, the fold changes <0.5 are highlighted in blue. Per analyte a ratio paired t-test was performed to determine statistical significance between the absolute values of the untreated control and the respective treatment arm. (D) Murine G-CSF levels in hot tumors under treatment with different CPi’s. The absolute values of murine G-CSF was plotted as before–after graph for the three different treatment arms. A ratio paired t-test was performed to determine statistical significance between the absolute values of the untreated control and the respective treatment arm. CPi, checkpoint inhibitor; CTLA-4, cytotoxic T-lymphocyte-associated protein 4; G-CSF, granulocyte colony stimulation factor; IL, interleukin; IFN, interferon; PD-1, programmed cell death 1; TIL, tumor-infiltrating lymphocytes; TNF, tumor necrosis factor.
Figure 6
Figure 6
The PD-L1 expression was determined by IHC in 14 different NSCLC PDX in the presence of human immune cells and under treatment with two different checkpoint inhibitors in monotherapy and combined therapy. The DAB +area was determined using the OSANO software by analyzing one whole slide per tumor model and setting: humanized untreated, humanized anti CTLA-4 treatment, humanized anti PD-1 treatment and humanized combination treatment, a total of 56 slides. (A) Representative 10× magnification jpegs were extracted of the scans (scale bar included) for one cold and one hot tumor model in the different treatment arms. (B) The fold change of PD-L1 expression versus the respective untreated control was calculated per model and plotted separately for cold and hot tumors. The individual data points are plotted as box plots with minimum and maximum as whiskers and median depicted as the line in the box. The dotted line a y=1 depicts the inflection point of downregulation (<1) towards upregulation (>1) of PD-L1. (C) The absolute values for the PD-L1 expression depicted as relative DAB +area (=percentage of analyzed area) within the different treatment arms was plotted separately for cold and hot tumors. The individual data points are plotted as violin plots with individual data points. (D) Using whole slide images of H&E-stained slides the percentage of the tissue classes tumor, stroma and necrosis were measured by a tissue classification algorithm, in 14 NSCLC PDX models. The tissue classes for cold and hot tumors in the different treatment arms are plotted as percentage of analyzed area. For each model and each treatment arm one whole slide scan was analyzed (n=7 for cold and hot tumors, respectively). The individual data points are plotted as box plots with minimum and maximum as whiskers and median depicted as the line in the box. CTCLA-4, cytotoxic T-lymphocyte-associated protein 4; DAB, 3,3′-Diaminobenzidin; LXFA, lung cancer xenograft Freiburg, adenocarcinoma; PD-1, programmed cell death 1; PD-L1, programmed cell death ligand 1; NSCLC, non-small cell lung cancer; PDX, patient-derived xenograft.
Figure 7
Figure 7
Using whole slide images of DAB stained anti-CD45 immunohistochemistry slides the presence of CD45 +cells in the slide was quantified as percentage of the DAB positive nuclei area of total nuclei area. (A) For five samples from untreated non-small cell lung cancer patient-derived xenograft the full stack as described in M&M was analyzed and the mean percentage and SD of part stacks plotted versus the mean percentage and SD of the full stack. (B) The percentage of DAB-stained CD45 positive area in relation to the full sample area for cold and hot tumors in the different treatment arms are plotted as percentage of analyzed area. For each model and each treatment arm one whole slide scan was analyzed (n=7 for cold and hot tumors, respectively). The individual data points are plotted as box plots with minimum and maximum as whiskers and median depicted as the line in the box. (C) The fold change of the CD45 +cell infiltration determined by percentage of DAB +area in comparison to the respective untreated control arm was calculated per individual experiment and model. The mean values of the fold changes for the cold and the hot tumors was plotted as a heatmap. CTLA-4, cytotoxic T-lymphocyte-associated protein 4; DAB, 3,3′-Diaminobenzidin; LXFA, lung cancer xenograft Freiburg, adenocarcinoma; LXFE, lung cancer xenograft Freiburg, epithelial; LXFE, lung cancer xenograft Freiburg, epithelial.

Similar articles

Cited by

References

    1. Camidge DR, Doebele RC, Kerr KM. Comparing and contrasting predictive biomarkers for immunotherapy and targeted therapy of NSCLC. Nat Rev Clin Oncol 2019;16:341–55. 10.1038/s41571-019-0173-9 - DOI - PubMed
    1. Kim H, Kwon HJ, Kim ES, et al. . Comparison of the predictive power of a combination versus individual biomarker testing in non-small cell lung cancer patients treated with immune checkpoint inhibitors. Cancer Res Treat 2021:583. 10.4143/crt.2021.583 - DOI - PMC - PubMed
    1. Tentler JJ, Tan AC, Weekes CD, et al. . Patient-derived tumour xenografts as models for oncology drug development. Nat Rev Clin Oncol 2012;9:338–50. 10.1038/nrclinonc.2012.61 - DOI - PMC - PubMed
    1. Bertotti A, Migliardi G, Galimi F, et al. . A molecularly annotated platform of patient-derived xenografts ("xenopatients") identifies HER2 as an effective therapeutic target in cetuximab-resistant colorectal cancer. Cancer Discov 2011;1:508–23. 10.1158/2159-8290.CD-11-0109 - DOI - PubMed
    1. Bruna A, Rueda OM, Greenwood W, et al. . A Biobank of breast cancer explants with preserved intra-tumor heterogeneity to screen anticancer compounds. Cell 2016;167:260–74. 10.1016/j.cell.2016.08.041 - DOI - PMC - PubMed

Publication types