. 2022 May;32(5):893-903.
doi: 10.1101/gr.276387.121. Epub 2022 Apr 28.

A complete pedigree-based graph workflow for rare candidate variant analysis

Affiliations

A complete pedigree-based graph workflow for rare candidate variant analysis

Charles Markello et al. Genome Res. 2022 May.

Abstract

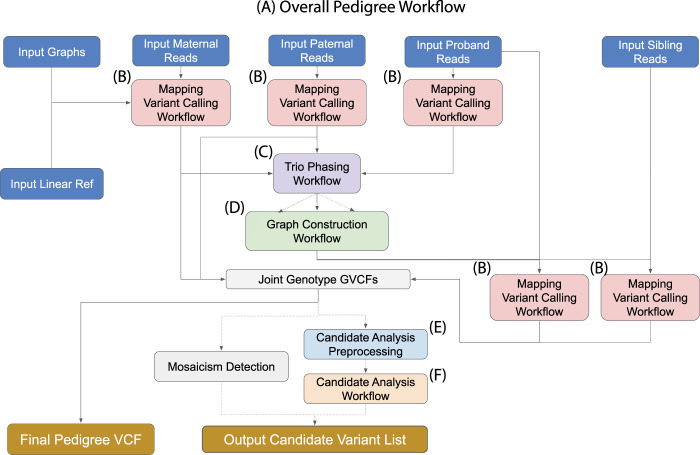
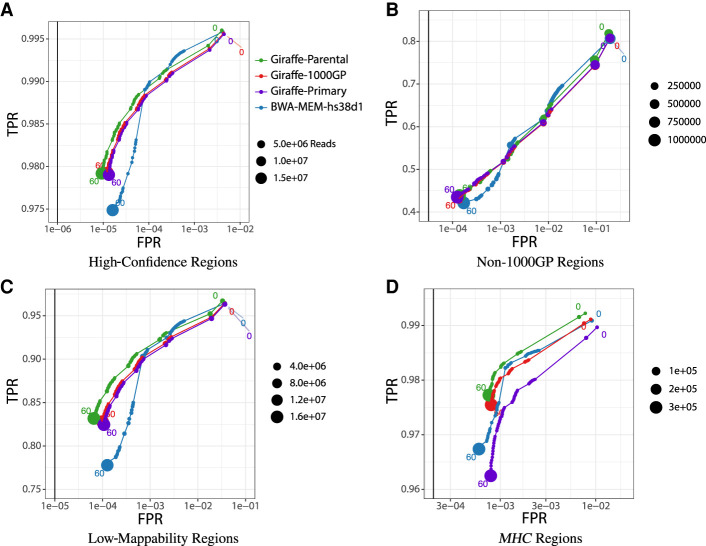
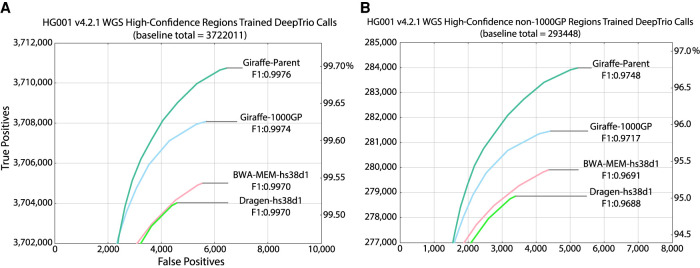
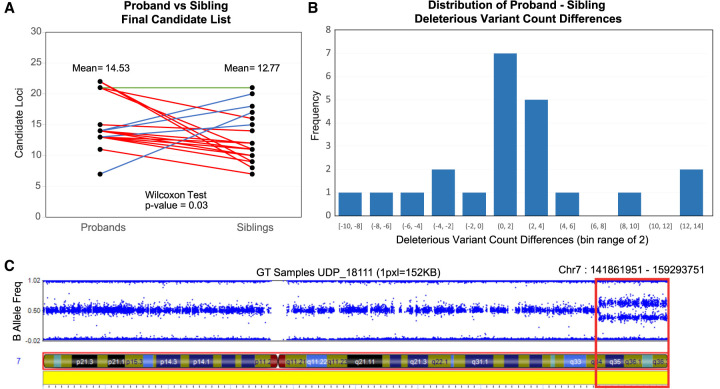
Methods that use a linear genome reference for genome sequencing data analysis are reference-biased. In the field of clinical genetics for rare diseases, a resulting reduction in genotyping accuracy in some regions has likely prevented the resolution of some cases. Pangenome graphs embed population variation into a reference structure. Although pangenome graphs have helped to reduce reference mapping bias, further performance improvements are possible. We introduce VG-Pedigree, a pedigree-aware workflow based on the pangenome-mapping tool of Giraffe and the variant calling tool DeepTrio using a specially trained model for Giraffe-based alignments. We demonstrate mapping and variant calling improvements in both single-nucleotide variants (SNVs) and insertion and deletion (indel) variants over those produced by alignments created using BWA-MEM to a linear-reference and Giraffe mapping to a pangenome graph containing data from the 1000 Genomes Project. We have also adapted and upgraded deleterious-variant (DV) detecting methods and programs into a streamlined workflow. We used these workflows in combination to detect small lists of candidate DVs among 15 family quartets and quintets of the Undiagnosed Diseases Program (UDP). All candidate DVs that were previously diagnosed using the Mendelian models covered by the previously published methods were recapitulated by these workflows. The results of these experiments indicate that a slightly greater absolute count of DVs are detected in the proband population than in their matched unaffected siblings.


Figures

Figure 1.
Figure 1.
Toil-VG-Pedigree workflow. Dotted lines indicate optional pathways in the workflow. (A) Overall workflow diagram. (B) Single sample alignment and variant calling workflow. (C) Trio joint-genotyping and phasing workflow. (D) Parental graph construction workflow. (E) Workflow for preprocessing and annotation of pedigree variants required for candidate analysis. (F) The candidate analysis workflow.
Figure 2.
Figure 2.
Mapping performance of 100 million read pairs simulated from HG002 high-confidence data sets. Four different alignments are compared across four different regions and ROC curves are plotted with a log-scaled false positive rate on the x-axis and a linear-scaled true positive rate on the y-axis with the mapping quality as the discriminating factor. Green curves represent graph alignments against the parental graph reference constructed from HG003 and HG004 Illumina read graph alignments. Red curves represent alignments against the 1000GP graph reference. Purple curves represent alignments to the primary GRCh38 linear graph reference. Blue curves represent linear alignments against the hs38d1 reference using BWA-MEM. (A) Alignments in GIAB v4.2.1 confident regions (from 10 million simulated read set). (B) Alignments in non-1000GP confident regions (from 10 million simulated Illumina read set). (C) Alignments in GIAB v4.2.1 low-mappability regions (from 100 million simulated Illumina read set). (D) Alignments in GIAB v4.2.1 MHC regions (from 100 million simulated Illumina read set).
Figure 3.
Figure 3.
ROC curves of DeepTrio variant calling performance of the graph-based and linear-based pipelines with respect to HG001 GIAB v4.2.1 truth variant call sets stratified by (A) HG001 high-confidence whole genome regions using trained DeepTrio models, and (B) HG001 high-confidence whole genome regions excluding 1000GP variants using trained DeepTrio models.
Figure 4.
Figure 4.
Proband-sibling pairwise candidate analysis results on 15 nuclear families of at least quartet in size, comprising a population of 15 probands and 22 siblings. Plot A shows the average number of candidate variants between the probands and sibling populations. Seventeen red lines (four overlapping) represent proband-sibling pairs where the proband has more DVs than their matched sibling, five blue lines (one overlapping) represent probands that have less DVs than their matched sibling, and one green line, where probands have the same number of DVs as their matched sibling. The proband population holds an average of 14.53 DVs whereas the sibling population has an average of 12.77 DVs. A one-tailed Wilcoxon signed-rank test of the hypothesis that the probands have greater numbers of DVs than their matched siblings produced a P-value of 0.0333. (B) The distribution of proband-sibling DV list size differences. (C) A mosaic region identified by the workflow (red box) overlaid with the SNP-chip B allele frequency plot for a UDP sample.

References

    1. The 1000 Genomes Project Consortium. 2015. A global reference for human genetic variation. Nature 526: 68–74. 10.1038/nature15393 - DOI - PMC - PubMed
    1. Abel HJ, Larson DE, Regier AA, Chiang C, Das I, Kanchi KL, Layer RM, Neale BM, Salerno WJ, Reeves C, et al. 2020. Mapping and characterization of structural variation in 17,795 human genomes. Nature 583: 83–89. 10.1038/s41586-020-2371-0 - DOI - PMC - PubMed
    1. Baldridge D, Heeley J, Vineyard M, Manwaring L, Toler TL, Fassi E, Fiala E, Brown S, Goss CW, Willing M, et al. 2017. The Exome Clinic and the role of medical genetics expertise in the interpretation of exome sequencing results. Genet Med 19: 1040–1048. 10.1038/gim.2016.224 - DOI - PMC - PubMed
    1. Cingolani P, Platts A, Wang LL, Coon M, Nguyen T, Wang L, Land SJ, Lu X, Ruden DM. 2012. A program for annotating and predicting the effects of single nucleotide polymorphisms, SnpEff. Fly (Austin) 6: 80–92. 10.4161/fly.19695 - DOI - PMC - PubMed
    1. Clark MM, Stark Z, Farnaes L, Tan TY, White SM, Dimmock D, Kingsmore SF. 2018. Meta-analysis of the diagnostic and clinical utility of genome and exome sequencing and chromosomal microarray in children with suspected genetic diseases. NPJ Genom Med 3: 16. 10.1038/s41525-018-0053-8 - DOI - PMC - PubMed

Publication types