. 2022 Apr 28;13(1):2300.
doi: 10.1038/s41467-022-29767-7.

Somatic whole genome dynamics of precancer in Barrett's esophagus reveals features associated with disease progression

Affiliations

Somatic whole genome dynamics of precancer in Barrett's esophagus reveals features associated with disease progression

Thomas G Paulson et al. Nat Commun. .

Abstract

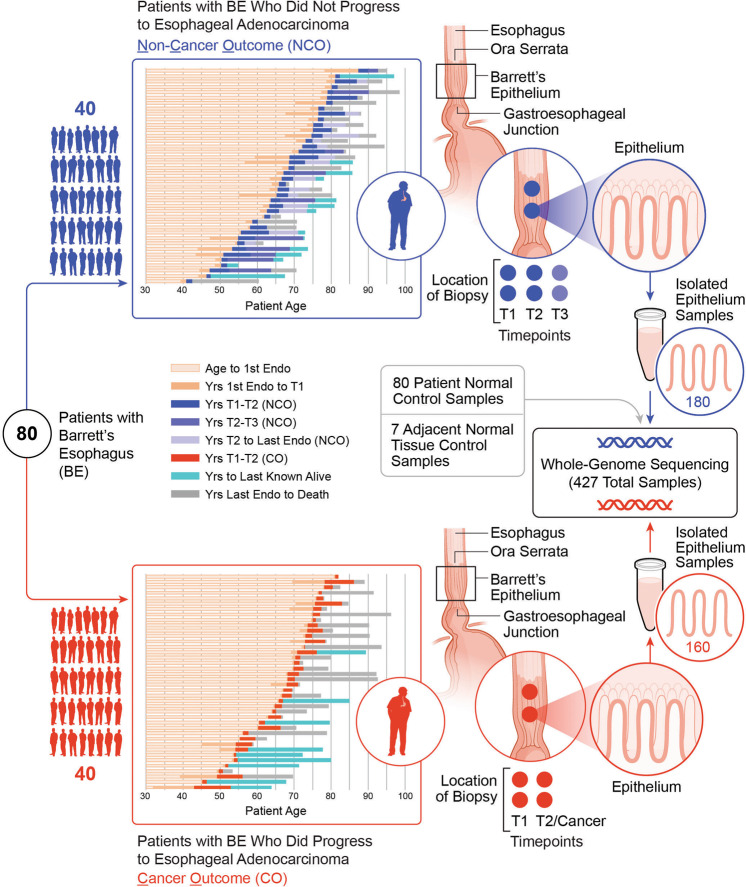
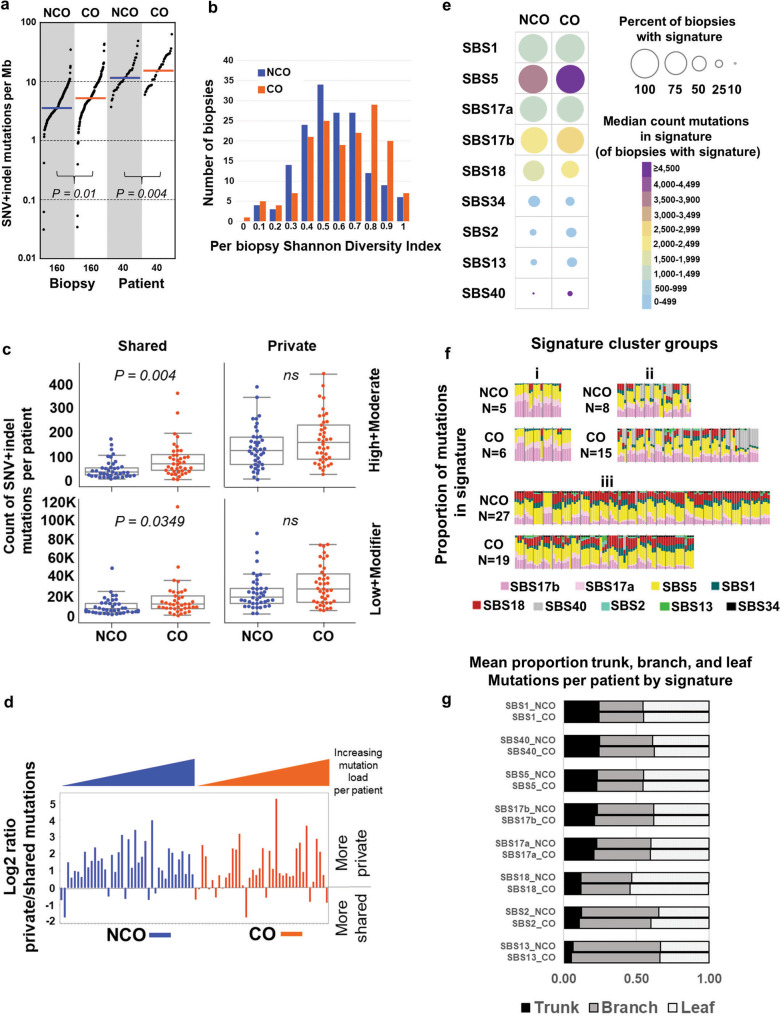
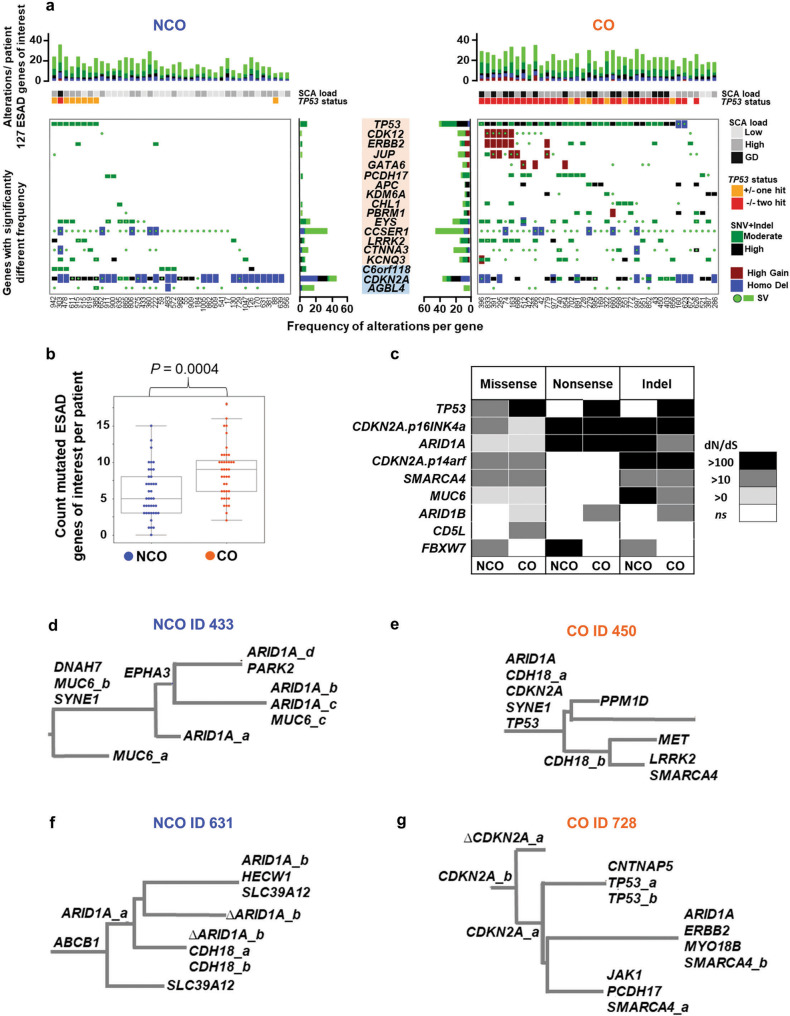
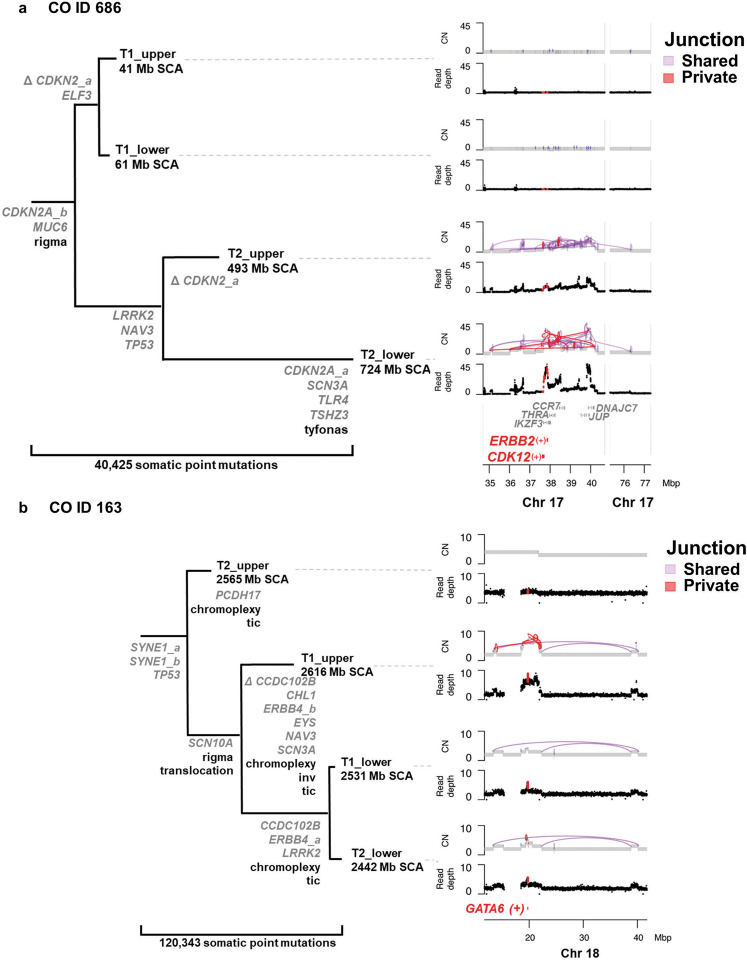
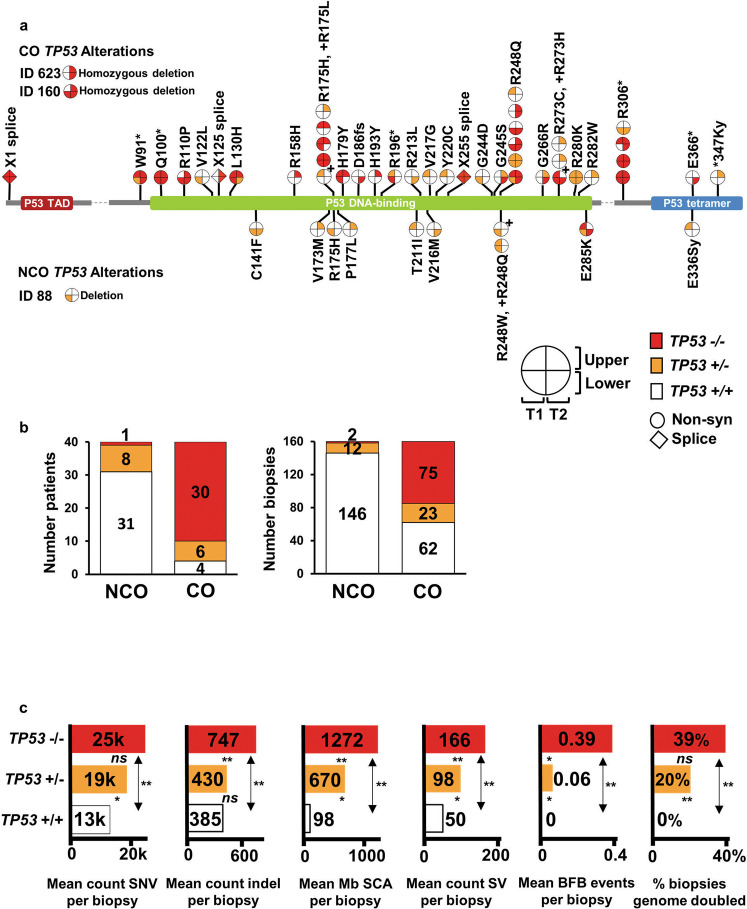
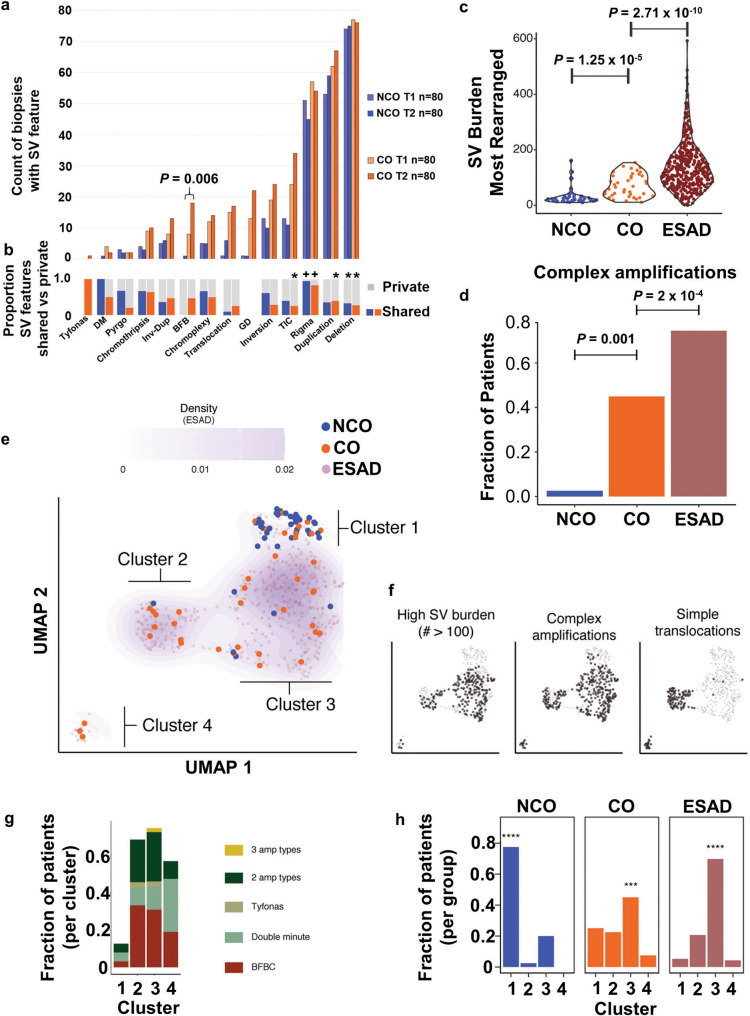
While the genomes of normal tissues undergo dynamic changes over time, little is understood about the temporal-spatial dynamics of genomes in premalignant tissues that progress to cancer compared to those that remain cancer-free. Here we use whole genome sequencing to contrast genomic alterations in 427 longitudinal samples from 40 patients with stable Barrett's esophagus compared to 40 Barrett's patients who progressed to esophageal adenocarcinoma (ESAD). We show the same somatic mutational processes are active in Barrett's tissue regardless of outcome, with high levels of mutation, ESAD gene and focal chromosomal alterations, and similar mutational signatures. The critical distinction between stable Barrett's versus those who progress to cancer is acquisition and expansion of TP53-/- cell populations having complex structural variants and high-level amplifications, which are detectable up to six years prior to a cancer diagnosis. These findings reveal the timing of common somatic genome dynamics in stable Barrett's esophagus and define key genomic features specific to progression to esophageal adenocarcinoma, both of which are critical for cancer prevention and early detection strategies.


Conflict of interest statement

The authors declare no competing interests.

Figures

Fig. 1
Fig. 1. Longitudinal multi-sample study in cases with BE who progressed to an ESAD outcome compared to controls with BE who did not progress.
Schematic of our study including 340 spatially mapped BE biopsies and 87 normal control samples across 80 patients with diagnosed BE, including 40 controls with BE who did not progress to ESAD and 40 cases who progressed to an endoscopically detected, incident ESAD. Unless otherwise noted, results combine T1 and T2 time points and do not include NCO T3 or the seven additional adjacent normal gastric control samples. Source data are indicated in Figure Source Data File.
Fig. 2
Fig. 2. Highly mutated clones arise and expand prior to clinical detection of BE.
a y-axis (log scale) shows unique SNV + indel mutations per megabase (2,800 Mb of sequence) per biopsy and per patient in NCO and CO. Per patient mutation burden was derived from the sum of unique SNV and indel mutations across four biopsies. Horizontal bar is median (3.56 vs. 5.21 by biopsy, and 11.62 vs. 15.35 by patient, in NCO and CO, respectively). Nine biopsies with exceptionally low mutation load were also included (Supplementary Data File 5, See “Anomalous biopsies” in Supplementary Methods). b Mutational diversity per biopsy using Shannon Diversity Index based on SNV + indel load and VAF in NCO patients (blue) and CO patients (orange). c Count of unique SNV and indel mutations per patient classified as shared between biopsies (left) or private to a single biopsy (right), with “functional” (high or moderate) impact on protein function based on snpEFF (top) vs. low or modifier (bottom) (comparison by t-test), (Supplementary Data File 6). Box centerline indicates median, box edges 1st and 3rd quartiles and whiskers 1.5x interquartile range (IQR), all data points outside of IQR were plotted. A total of 40 CO (160 biopsies) and 40 NCO (160 biopsies) patients were examined. Mann–Whitney U test was used for comparison of the two groups. d Log2 ratio of private/shared SNV and indel mutations by patient. Patients with more mutations private to single biopsies than shared between two or more biopsies have values above zero; those with more shared mutations than private have values below zero. e Percent of biopsies with mutation signatures (circle size) and median number of mutations per biopsy in each signature, including only biopsies in which that signature was detected (color scale). SBS3 not shown(only detected in a single CO biopsy). f, Signature cluster groups where each column is a single biopsy. Biopsies are grouped by patient and ordered by patient ID. N = count of NCO or CO patients in each signature cluster. Comparison by Fisher’s exact test. g Signature probabilities were assigned to each mutation, mutations were binned as trunk (shared by all four biopsies per patient), branch (shared by 2 or 3), or leaf (private to a single biopsy), and the mean proportion of mutations in trunk, branch, or leaf for each signature per patient was calculated. SBS3 and SBS34 not shown (very low mutation counts), see Supplementary Data File 10. Source data are indicated in Figure Source Data File.
Fig. 3
Fig. 3. Somatic alterations in ESAD genes and mutation selection before cancer.
a Top panels show cumulative functional alterations in 127 ESAD genes of interest per patient, with patient ID indicated below maximum SCA load and TP53 status per patient. Bottom panels show alteration types and frequency per gene in CO (orange) and NCO (blue) for genes with significantly different frequencies of alterations between CO and NCO (FDR < = 0.1) (Supplementary Data File 8). b Count of mutated ESAD genes per patient. Box centerline indicates median, box edges 1st and 3rd quartiles and whiskers 1.5x interquartile range (IQR), all data points outside of IQR were plotted. A total of 40 CO (160 biopsies) and 40 NCO (160 biopsies) patients were examined. Mann–Whitney U test was used for comparison of the two groups. c, Nine genes had a significant dN/dS ratio >0 in NCO and/or CO patients. dN/dS reflects the fraction of mutations observed in a gene that are likely to be under positive selection. A dN/dS of 10 indicates that there are 10 times more non-synonymous mutations in the gene than neutrally expected, suggesting that at least around 90% of mutations in that gene are selected. dg Parsimony tree phylogenies from typical BE patients having an average number of altered ESAD genes per patient, showing examples of heterogeneity of mutations in ESAD genes of interest mutations and convergent evolution in both NCO and CO. Only ESAD genes of interest are annotated, and Δ indicates the haplotype with the mutated allele identified in another sample was lost due to a copy loss event in this branch. Branch lengths are proportional to inferred mutation count for all SNVs. Mutations suffixed _a, _b, etc., indicate mutations at different sites in the same gene. Annotated phylogenies for all patients can be found in Supplementary Data File 36. d NCO patient with three MUC6 mutations (i.e. MUC6_a, b, c) and four ARID1A mutations. e CO patient with two CHD18 mutations. f, NCO patient with two different ARID1A mutations and two CHD18 mutations. g CO patient with two CDKN2A mutations, two TP53 mutations, and two SMARCA4 mutations. Source data are indicated in Figure Source Data File.
Fig. 4
Fig. 4. Gene alterations within complex SV events selected in CO patients.
a CO ID 686 with complex SV in both T2 samples, which cluster together in the SNV-based parsimony tree. The phylogeny is annotated with ESAD genes of interest with functional 2+ caller mutations (multiple mutations in the same gene are appended with _a, _b), and Δ indicates chromosome copy loss of mutated allele. The complex structural rearrangement pattern of rigma was detected in all four samples, whereas tyfonas (“typhoons” of high junction copy number junctions and fold back inversions) was only detected in the T2 sample, shown in the right panel. Within this region, CDK12 was disrupted by structural alterations and ERBB2 was within one of the highly amplified regions within this complex SV. b CO ID 163 with expanded TP53 −/− and genome doubling in all four samples. The three samples on the lower clade in the SNV-based phylogeny share a common amplified region which includes increased copies of GATA6 and surrounding genes. Total Mb SCA are indicated for each sample. CN = copy number. Source data are indicated in Figure Source Data File.
Fig. 5
Fig. 5. Expansion of TP53 −/− is a primary characteristic for progression to ESAD.
a TP53 mutations in four biopsies per patient collected over time (T1 and T2) and space (upper and lower esophagus) in CO and NCO. Each “lollipop” pie on the TP53 gene structure indicates a specific TP53 mutation with quadrants of the lollipop indicating the number of mutant copies in each of the patient’s four biopsies. The TP53 biopsy quadrants for two CO with homozygous deletions of TP53 (IDs 623 and 160) and one NCO (ID 88) with single copy deletion (ID 88) spanning TP53 are also plotted for completeness. (+) next to a pie corresponds to the amino acid change marked by (+). b, Proportions of patients and biopsies with wild-type TP53 + / + (white), one-hit TP53 + /− (orange), and two-hit TP53 −/− (red) status. Of the six one-hit CO, five of the mutations were private and one was shared, and of the eight one-hit NCO, six were private and two shared. c, Somatic alterations stratified by TP53 zero-hit (n = 208 biopsies), one-hit (n = 35 biopsies), and two-hit (n = 77 biopsies). Two-sided Mann–Whitney U test was used for each comparison with correction for multiple comparisons. P-values between bars test for significant difference between TP53 categories, ns = P ≥ 0.05, *=P < 0.05, **=P < 0.0001. SCA = somatic chromosomal alterations (gains, losses, cnLOH); SV = structural variants; BFB = bridge-fusion-break events. P-values and source data are indicated in Figure Source Data File.
Fig. 6
Fig. 6. Complex structural alterations in progression to ESAD.
a Plot shows count of biopsies with SV features in T1 and T2 biopsies in NCO and CO (n = 80 biopsies in each category of T1 NCO, T1 CO, T2 NCO, T2 CO). Comparison between T1 and T2 by Wilcoxon rank-sum test. b Proportion of SV events that are private to a single biopsy (grey) or shared between two or more biopsies (blue=NCO, orange=CO). (+) indicates significantly higher load of this SV feature is shared; (*) asterisk indicates a significantly higher load of SV feature is private, FDR 0.01 (Supplementary Data Fig. 9) c Total SV burden of NCO (n = 40), CO (n = 40) and ESAD (n = 408) patients, represented by the most rearranged sample per case. Statistical enrichment determined by Gamma-Poisson regression of SV burden as a function of group status, correcting for TP53 mutational status. d Fraction of cases that harbor a complex amplification (BFB, double minute, and/or tyfonas), in NCO (n = 40), CO (n = 40) and ESAD (n = 408) (represented by presence of complex amplification type in any patient sample). Mann–Whitney U test was used for each comparison. e Left, UMAP clustering of NCO, CO, and ESAD patients using junction burden of most rearranged samples attributed to SV event types as input. Density contours determined on the basis of ESAD data only, with faded purple dots representing ESAD data points. Clusters determined by Gaussian mixture model regression. f Each sample harboring the SV feature of interest is represented by black dots in the scatterplot, while others are colored transparent grey. g Fraction of patients within each cluster containing complex amplification types. h, Fraction of NCO (n = 40), CO (n = 40), and ESAD (n = 408) cases within each cluster. Asterisks indicate the highest fraction is significantly higher than the other three (chi-square test, **** P = 2.2 × 10−16; *** P = 0.0017). Source data are indicated in Figure Source Data File.

References

    1. Kennedy SR, Zhang Y, Risques RA. Cancer-Associated Mutations but No Cancer: Insights into the Early Steps of Carcinogenesis and Implications for Early Cancer Detection. Trends Cancer Res. 2019;5:531–540. doi: 10.1016/j.trecan.2019.07.007. - DOI - PMC - PubMed
    1. Salk JJ, et al. Ultra-Sensitive TP53 Sequencing for Cancer Detection Reveals Progressive Clonal Selection in Normal Tissue over a Century of Human Lifespan. Cell Rep. 2019;28:132–144.e3. doi: 10.1016/j.celrep.2019.05.109. - DOI - PMC - PubMed
    1. Teixeira VH, et al. Deciphering the genomic, epigenomic, and transcriptomic landscapes of pre-invasive lung cancer lesions. Nat. Med. 2019;25:517–525. doi: 10.1038/s41591-018-0323-0. - DOI - PMC - PubMed
    1. Lee-Six H, et al. The landscape of somatic mutation in normal colorectal epithelial cells. Nature. 2019;574:532–537. doi: 10.1038/s41586-019-1672-7. - DOI - PubMed
    1. Martincorena I, et al. Somatic mutant clones colonize the human esophagus with age. Science. 2018;362:911–917. doi: 10.1126/science.aau3879. - DOI - PMC - PubMed

Publication types

Supplementary concepts