. 2022 Apr 28;13(1):2323.
doi: 10.1038/s41467-022-29898-x.

Hypoxia-activated neuropeptide Y/Y5 receptor/RhoA pathway triggers chromosomal instability and bone metastasis in Ewing sarcoma

Affiliations

Hypoxia-activated neuropeptide Y/Y5 receptor/RhoA pathway triggers chromosomal instability and bone metastasis in Ewing sarcoma

Congyi Lu et al. Nat Commun. .

Erratum in

Abstract

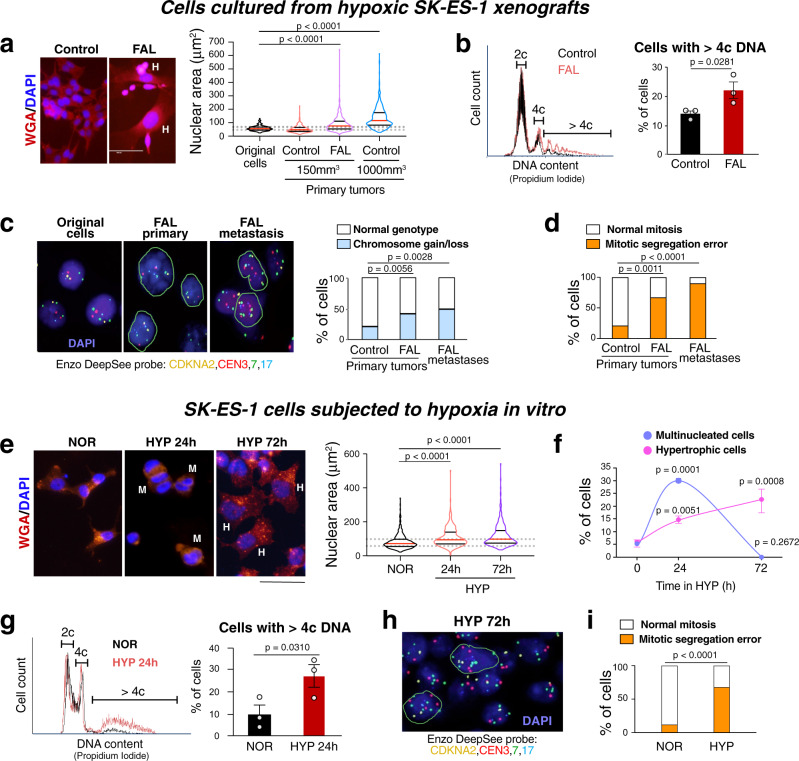
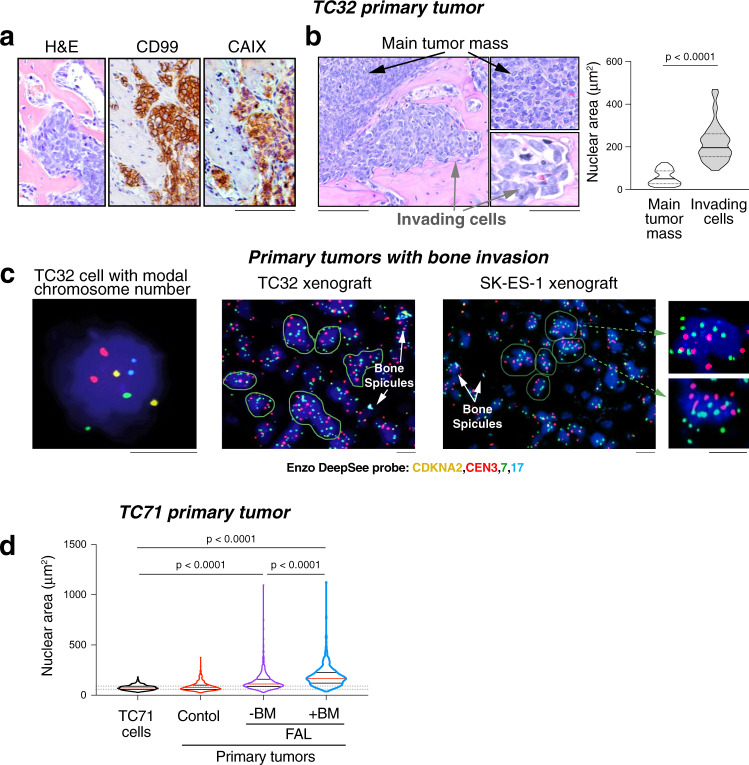
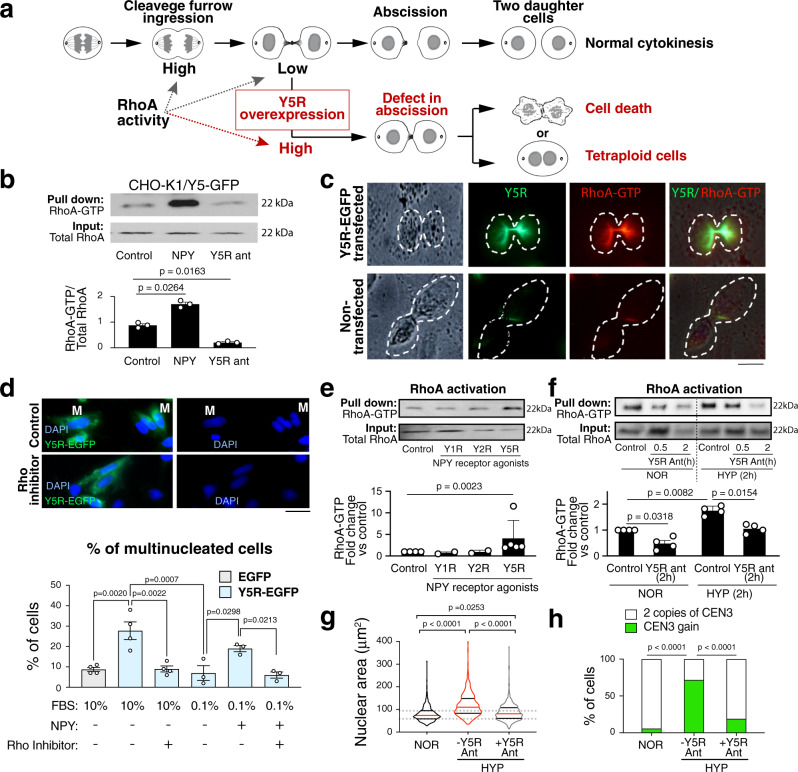
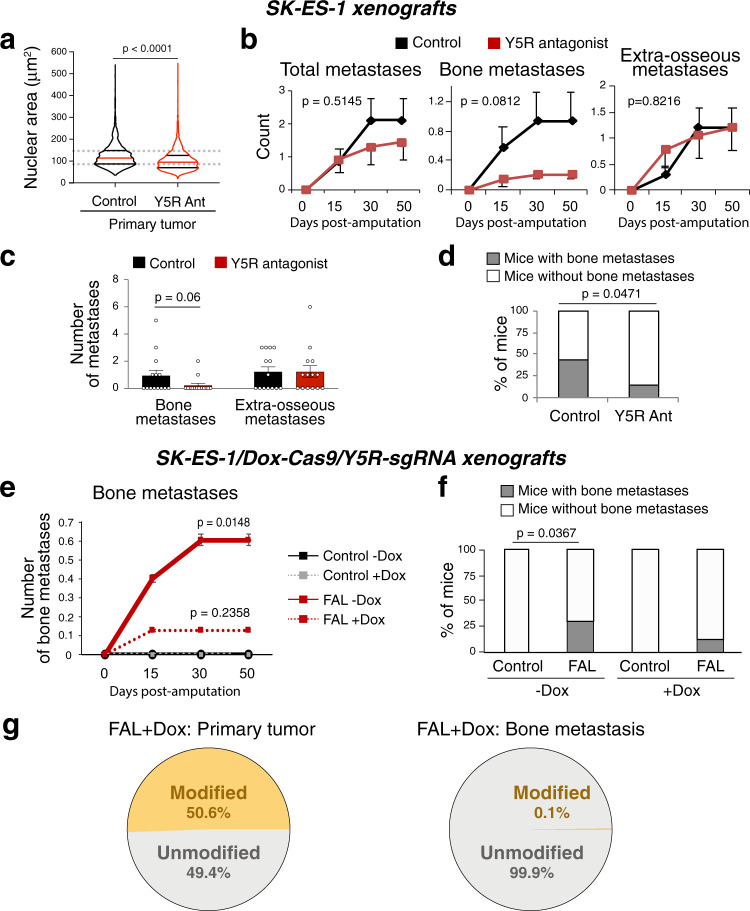
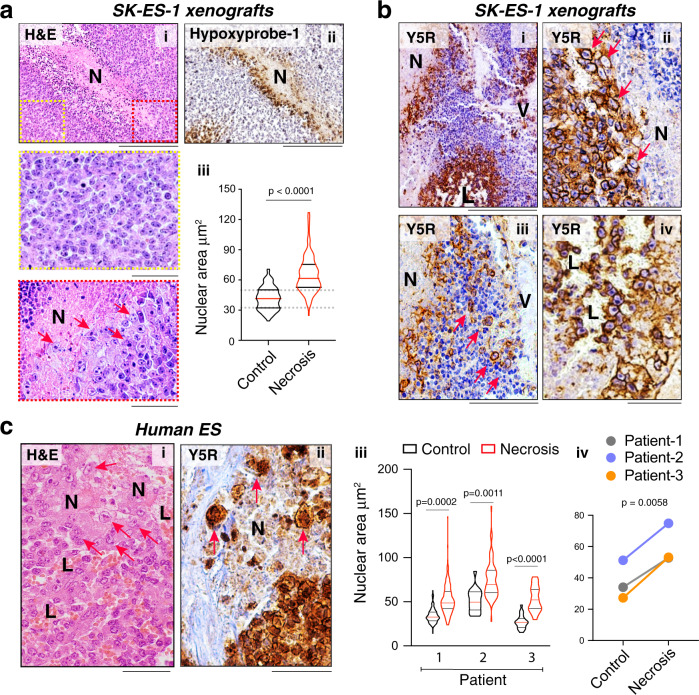
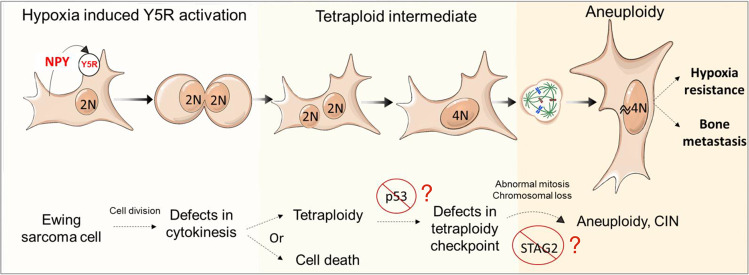
Adverse prognosis in Ewing sarcoma (ES) is associated with the presence of metastases, particularly in bone, tumor hypoxia and chromosomal instability (CIN). Yet, a mechanistic link between these factors remains unknown. We demonstrate that in ES, tumor hypoxia selectively exacerbates bone metastasis. This process is triggered by hypoxia-induced stimulation of the neuropeptide Y (NPY)/Y5 receptor (Y5R) pathway, which leads to RhoA over-activation and cytokinesis failure. These mitotic defects result in the formation of polyploid ES cells, the progeny of which exhibit high CIN, an ability to invade and colonize bone, and a resistance to chemotherapy. Blocking Y5R in hypoxic ES tumors prevents polyploidization and bone metastasis. Our findings provide evidence for the role of the hypoxia-inducible NPY/Y5R/RhoA axis in promoting genomic changes and subsequent osseous dissemination in ES, and suggest that targeting this pathway may prevent CIN and disease progression in ES and other cancers rich in NPY and Y5R.


Conflict of interest statement

The authors declare no competing interests.

Figures

Fig. 1
Fig. 1. Hypoxia exacerbates osseous metastases in ES animal model.
a Design of the experiments testing the effect of tumor hypoxia triggered by femoral artery ligation (FAL) on ES metastasis. be SK-ES-1 xenografts: b Representative images of bone metastases detected by MRI and confirmed by histopathology (H&E) (n = 20). Scale bar: 400 μm. c Time line of metastasis from control or hypoxic xenografts. Hypoxia effects assessed by the generalized estimating equation (GEE) test. d The comparison of bone and extra-osseous metastases in control and FAL-treated animals detected at the end point of the experiment. One-tailed Mann–Whitney test. e Percentage of mice with bone metastases in control and hypoxic groups. One-sided χ2 test. For panels ce, n = 16 and 21 for control and FAL groups, respectively. fh TC71 xenografts: f Representative image of bone metastasis detected by histological analysis (n = 7). Scale bar: 1000 μm. g The analysis of bone and extra-osseous metastases in control or FAL-treated mice. Two-tailed Mann–Whitney test. h Percentage of mice with bone metastases in control and hypoxic groups. Two-sided Fisher’s exact test. For panels g, h, n = 15 and 19 for control and FAL groups, respectively. Error bars indicate standard error of the mean.
Fig. 2
Fig. 2. Hypoxia leads to the accumulation of cells with increased DNA content.
a Representative images of cells cultured from control or FAL-treated SK-ES-1 xenografts stained with DAPI and wheat germ agglutinin (WGA), followed by the analysis of nuclear area of the original SK-ES-1 cells (n = 200) and cells isolated from small (150 mm3) control (n = 417) or FAL-treated tumors (n = 431), or large (1000 mm3) untreated primary tumors (n = 405). Cells cultured from xenografts were derived from 10 tumors per group. Scale bar: 100μm. One-way ANOVA followed by Dunnett’s test. b Flow cytometry analysis of DNA content in cells cultured from control or FAL-treated SK-ES-1 xenografts, followed by the analysis of cells exceeding 4c DNA (n = 3 tumors/group). One-side t-test; c Representative images of FISH with CDKNA2/CEN3/7/17 probes in the original SK-ES-1 cells and cells cultured from SK-ES-1 primary tumors or metastases of FAL-treated mice, followed by the analysis of numerical chromosome alterations (Control primary tumors n = 90 cells from 7 tumors, FAL primary tumors n = 160 cells from 6 tumors, FAL metastases n = 45 cells from 2 tumors). Two-sided Fisher’s exact test. d Mitotic segregation errors assessed in the above cells (Control primary tumors n = 24, FAL primary tumors n = 33, FAL metastases n = 21 cells). Two-sided Fisher’s exact test. Scale bar: 10 μm. e Representative images of SK-ES-1 cells cultured in normoxia (NOR) or 0.1% oxygen (Hypoxia, HYP) for 24 h or 72 h stained with DAPI and WGA, followed by the analysis of nuclear area (NOR n = 351, HYP 24 h n = 292, HYP 72 h n = 385). Scale bar: 100 μm. One-way ANOVA followed by Dunnett’s test. f Frequency of multinucleated and hypertrophic SK-ES-1 cells upon exposure to HYP (n = 3 independent experiments). One-way ANOVA followed by Dunnett’s test. g Representative flow cytometry quantification of DNA content in NOR or HYP SK-ES-1 cells, followed by the analysis of cells with >4c DNA (n = 3 independent experiments). One-sided paired t-test. h Representative image of FISH with CDKNA2/CEN3/7/17 probes in SK-ES-1 cells cultured in HYP for 72 h (n = 189 cells). Scale bar: 10 μm. i Analysis of mitotic segregation errors in SK-ES-1 cells - control or subjected to HYP for 72 h followed by 24 h culture in NOR (n = 24 and 38 cells per group, respectively). Two-sided Fisher’s exact test. a, e: H – hypertrophic cells; M – multinucleated cells; c, h: green borderlines – chromosome gains. Error bars indicate standard error of the mean. For violin plots in a and e, the red lines represent the median; the black lines represent the quartiles.
Fig. 3
Fig. 3. The presence of hypertrophic cells accompanies bone colonization.
a Representative images of TC32 primary tumor showing tumor cells growing in bone invasion areas, stained with H&E or immunostained for the ES marker, CD99, and a hypoxia marker, carbonic anhydrase IX (CAIX) (n = 5). Scale bar: 100 μm. b Representative images of TC32 cells growing in main tumor mass and in areas of local bone invasion, followed by the analysis of nuclear area (n = 54 from three independent tumors per group). The solid lines represent the median; the dashed lines represent the quartiles. Scale bars: 100 μm or 40 μm (insets). Two-tailed t-test. Error bars indicate standard error of the mean. c FISH with CDKNA2/CEN3/7/17 probes performed in bone invasion areas of TC32 and SK-ES-1 xenografts (n = 16 for TC32 xenografts, n = 6 for SK-ES-1 xenografts). Scale bar: 10 μm. Green borderlines – cells with chromosome gains. d Violin plot shows the analysis of nuclear area of cell cultured from TC71 control or FAL-treated xenografts, which did (+BM) or did not (-BM) metastasize to bone (original TC71 cells n = 285, control n = 401 cells from 8 tumors, FAL –BM n = 366 cells from 7 tumors, and FAL + BM n = 360 cells from 4 tumors). The red lines represent the median; the black lines represent the quartiles. One-way ANOVA followed by Tukey’s test.
Fig. 4
Fig. 4. The progeny of hypoxia-induced polyploid cells preferentially metastasize to bone.
a Design of the experiments for investigating the metastatic properties of the progeny of diploid (2n) and teraploid (4n) cell fractions isolated from normoxic (NOR) or hypoxic (HYP) SK-ES-1 cells using the FUCCI Cell Cycle Sensor followed by DNA staining and FACS. b Violin plot shows the analysis of nuclear area of the isolated diploid and tetraploid populations from NOR or HYP cells at passages 1 or 6–10 after sorting (Control SK-ES-1 n = 137; passage 1: NOR-2n n = 384, NOR~4n n = 282, HYP-2n n = 334, HYP~4n n = 143; passage 6–10: NOR-2n n = 161, NOR~4n n = 132, HYP-2n n = 173, HYP~4n n = 162). The red lines represent the median; the black lines represent the quartiles. P < 0.0001 vs. SK-ES-1 cells; one-way ANOVA followed by Dunnett’s test. c Analysis of mitotic segregation errors in NOR-2n (n = 24) or HYP~4n SK-ES-1 cells (n = 38). Two-sided Fisher’s exact test. d Flow cytometry analysis of DNA content in the original cell line and the cells cultured from parental and HYP~4n SK-ES-1 xenografts. e Representative images of FISH with CEN4/Y5R probes in the original SK-ES-1 cells (n = 53) or cells cultured from HYP~4n bone metastasis (n = 168), followed by the analysis of CEN4 numerical aberrations. Two-sided Fisher’s exact test. Scale bar: 10 μm. f Analysis of metastasis development in mice with control (n = 10) or HYP~4n (n = 7) SK-ES-1 xenografts; Generalized estimating equation (GEE) test. g, h Analysis of number of metastases (g) and the percentage of animals with bone metastases (h) in mice with SK-ES-1 xenografts developed from control (n = 10) or sorted cell fractions (NOR-2n n = 4, NOR~4n n = 3, HYP~4n n = 7). Error bars indicate standard error of the mean. Two-tailed Mann–Whitney test (g); One-sided χ2 test (h). i Representative image of multiple HYP~4n osseous metastases in the hind limb of mice bearing HYP~4n SK-ES-1 xenografts (n = 5). Scale bar: 2000 μm. T - tumor.
Fig. 5
Fig. 5. Over-expression of NPY Y5R leads to aneuploidy caused by cytokinesis defects.
a Representative fluorescence images of CHO-K1 cells transfected with EGFP alone or fused to the NPY receptors. M – multinucleated cell (n = 3–10 clones per group). Scale bar: 100 μm. b Flow cytometry analysis of DNA content in CHO-K1 cells transfected with Y5R-EGFP compared to non-transfected control. c Representative images of metaphase chromosomes from CHO-K1 cells (control) and CHO-K1 cells transfected with EGFP alone, rat Y5R-EGFP (rY5R-EGFP), or human Y5R-EGFP (hY5R-EGFP), followed by the analysis of chromosome counts (n = 11 for Control, EGFP and rY5R-EGFP, and n = 18 for hY5R EGFP). Scale bar: 50 μm. P < 0.001 vs control cells; Two-sided t-test. d-e Representative images from time lapse microscopy showing cytokinesis defects in CHO-K1/Y5R-EGFP transient transfectants, leading either to cell death (d) or polyploidy (e) (n = 9 per group). Scale bars: 20 μm (d) or 40 μm (e). f Time course of p44/42 MAPK activation upon stimulation with 10−7M NPY in CHO-K1/Y5R-EGFP stable transfectants detected by western blot (n = 3). g 3H-thymidine incorporation and MTS assay in CHO-K1/Y5R-EGFP stable transfectants following treatment with increasing NPY concentrations for 24 h (n = 6). One-way ANOVA followed by Dunnett’s test. Error bars indicate standard error of the mean.
Fig. 6
Fig. 6. Y5R-induced cytokinesis defects are caused by aberrant RhoA activation.
a Sustained high RhoA activity during cytokinesis can lead to cytokinesis failure. b RhoA activity measured by a RhoA pull-down assay in CHO-K1 cells stably transfected with Y5R-EGFP. The cells were treated with 10−7M NPY for 20 min or 10−6M Y5R antagonist (ant), CGP 71683, for 30 min. Band intensities quantified by densitometry (n = 3). Two-tailed paired t-test. c Representative fluorescence images of CHO-K1 cells in late cytokinesis, control or transiently transfected with Y5R-EGFP, immunostained for Y5R and active RhoA-GTP (n = 3 per group). Scale bar: 10 μm. d Representative images of CHO-K1 cells 24 h after transfection with Y5R-EGFP, with (+) or without (−) Rho inhibitor I (0.01 μg/ml). The treatment was performed in the media supplemented with 10% or 0.1% FBS, with or without exogenous NPY (10−7M). The cells were stained with DAPI, and used to quantify the prevalence of multinucleated cells (M) (n = 4 and 3 independent experiments for 10% and 0.1% FBS, respectively). Scale bar: 10 μm. One-way ANOVA followed by Tukey’s test. e RhoA activity in SK-ES-1 cells treated with selective NPY receptor agonists (10−7M for 20 min) measured by RhoA pull-down assay (n = 5). Two-tailed paired t-test. f RhoA activity measured by pull-down assay in SK-ES-1 cells cultured in normoxia (NOR) or subjected to hypoxia (HYP; 0.1% oxygen) for 2 h with or without Y5R antagonist (10−6M) (n = 4). e, f Two-tailed paired t-test. g Violin plot shows the analysis of nuclear area of SK-ES-1 cells in NOR (n = 419) or HYP for 72 h, with Y5R antagonist (10−6M) (n = 420) or without it (n = 373). Data from three independent experiments. The red lines represent the median; the black lines represent the quartiles. One-way ANOVA followed by Tukey’s test. h Analysis of frequency of Chr.3 gains detected by FISH with CDKNA2/CEN3/7/17 probes in SK-ES-1 cells in NOR (n = 137) or HYP for 72 h, with Y5R antagonist (10−6M) (n = 115) or without it (n = 110). Data from three independent experiments. Two-sided Fisher’s exact test. Error bars indicate standard error of the mean.
Fig. 7
Fig. 7. Y5R inhibition prevents bone metastasis in ES xenografts.
a Violin plot shows the analysis of nuclear area of cells cultured from control and Y5R antagonist-treated SK-ES-1 xenografts (CGP 71683, 20 mg/kg, 5 days) (n = 2161 cells from 10 tumors and n = 2184 cells from 12 tumors, respectively). The red lines represent the median; the black lines represent the quartiles. Two-tailed umpaired t-test. b Time course of SK-ES-1 metastasis development in control and Y5R-antagonist-treated mice. Generalized estimating equation (GEE) test. c Analysis of number of metastases in control and Y5R antagonist-treated mice. One-sided Mann–Whitney test. d Analysis of percentage of mice with osseous dissemination in control and Y5R antagonist-treated groups. One-sided χ2 test. (For panels bd, n = 14 mice per group). e Time course of bone metastasis development in mice with SK-ES-1 xenografts transduced with doxycycline (Dox)-inducible Cas9 and Y5R sgRNA, on control (-Dox) or Dox-supplemented diet (+Dox), with or without FAL-induced tumor hypoxia. P values as indicated compared to Control –Dox; GEE test. f The analysis of the percentage of mice with bone metastases in the experimental groups from e. One-sided χ2 test. (For panels e-f: Control –Dox n = 9, FAL -Dox n = 10, Control +Dox n = 9 and FAL + Dox n = 8 mice per group). g Frequency of NPY5R gene modifications in a primary tumor from a FAL-treated mouse on +Dox diet and in its corresponding bone metastasis. Error bars indicate standard error of the mean.
Fig. 8
Fig. 8. Hypertrophic tumor cells accumulate in hypoxic areas of ES tumors.
a Representative images of tumor cells distal to an area of necrosis (Control, yellow inset) and at the border of this region (Necrosis, red inset) in SK-ES-1 xenograft tissue stained with H&E (i) or anti-hypoxyprobe-1 (ii) antibody. Scale bars: 100 μm (i, ii) or 50 μm (insets). Nuclear sizes were compared between tissues in both areas (iii) (Control n = 101 and Necrosis n = 150; analysis from four independent necrotic areas). Two-sided unpaired t-test. b Y5R staining in the necrotic area of SK-ES-1 xenografts reveals enlarged, Y5R-positive cells at the edge of this region (i, ii), disseminated throughout it (iii) and accumulated around vessels (i) and blood lakes (i, iv) (n = 20 xenografts). Scale bars: 100 μm (i, iii) or 50 μm (ii, iv). c Representative image of the edge of necrotic tissue in human ES stained with H&E (i) and immunostained for Y5R (ii). Scale bars: 50 μm. Nuclear sizes in tumor cells distal to a necrotic area (Control) and at the edges of this region (Necrosis) were compared in three human ES tumors not exposed to therapy (Patient 1: Control n = 23 and Necrosis n = 22; Patient 2: Control n = 19 and Necrosis n = 20; Patient 3: Control n = 22 and Necrosis n = 18 cells). The analysis was performed independently within each tissue (iii) and as a group (iv). Two-tailed unpaired t-test. (iii) and two-tailed paired t-test (iv). ac N - necrosis, V - blood vessel, L - blood lake; red arrows or borders – hypertrophic cells; yellow borders – tumor cells with normal morphology. For violin plots in a, c, the red lines represent the median; the black lines represent the quartiles.
Fig. 9
Fig. 9. Hypoxia promotes the formation of hypertrophic neuroblastoma cells.
a Enlarged cells in neuroblastoma tissue from the TH-MYCN mouse model stained with H&E or anti-NPY antibody (n = 16 tumors). b Bone metastasis tissue from SK-N-BE(2) neuroblastoma xenograft stained with H&E, followed by the analysis of nuclear area of neuroblastoma cells in the main tumor mass (Control) and bone cavity (Bone niche) (n = 45 and 50, respectively). Scale bar: 100 μm. Two-tailed unpaired t-test. c Analysis of nuclear area in SK-N-BE(2) neuroblastoma cells cultured in normoxia (NOR) or hypoxia (0.1% oxygen, HYP) for 72 h (n = 100 and 104, respectively). Two-tailed unpaired t-test. a, b N - necrosis, V - blood vessel, B - bone, red arrows - hypertrophic cells, yellow arrows - tumor cells with normal morphology. For violin plots in b, c, the red lines represent the median; the black lines represent the quartiles.
Fig. 10
Fig. 10. Proposed mechanisms leading to hypoxia-induced bone metastasis in ES.
Hypoxic exposure up regulates the expression of NPY and Y5R in ES cells, leading to over-activation of the NPY/Y5R/RhoA axis and cytokinesis failure. The resulting tetraploid cells undergo abnormal cell divisions, which lead to chromosomal instability. This process may be facilitated by defects in the p53 pathway and STAG2 mutation, which enables tetraploid cell survival and subsequent chromosome loss, respectively. The progeny of hypoxia-induced polyploid cells have an increased ability to survive in low oxygen, invade bone tissue and form distant osseous metastases.

References

    1. Grunewald TGP, et al. Ewing sarcoma. Nat. Rev. Dis. Prim. 2018;4:5. - PubMed
    1. Cash T, et al. Comparison of clinical features and outcomes in patients with extraskeletal versus skeletal localized Ewing sarcoma: A report from the Children’s Oncology Group. Pediatr. Blood Cancer. 2016;63:1771–1779. - PMC - PubMed
    1. Gaspar N, et al. Ewing sarcoma: current management and future approaches through collaboration. J. Clin. Oncol. 2015;33:3036–3046. - PubMed
    1. Brohl AS, et al. The genomic landscape of the Ewing Sarcoma family of tumors reveals recurrent STAG2 mutation. PLoS Genet. 2014;10:e1004475. - PMC - PubMed
    1. Tirode F, et al. Genomic landscape of Ewing sarcoma defines an aggressive subtype with co-association of STAG2 and TP53 mutations. Cancer Discov. 2014;4:1342–1353. - PMC - PubMed

Publication types

MeSH terms