. 2022 Apr 28;13(1):2325.
doi: 10.1038/s41467-022-29967-1.

Periodic formation of epithelial somites from human pluripotent stem cells

Affiliations

Periodic formation of epithelial somites from human pluripotent stem cells

Marina Sanaki-Matsumiya et al. Nat Commun. .

Abstract

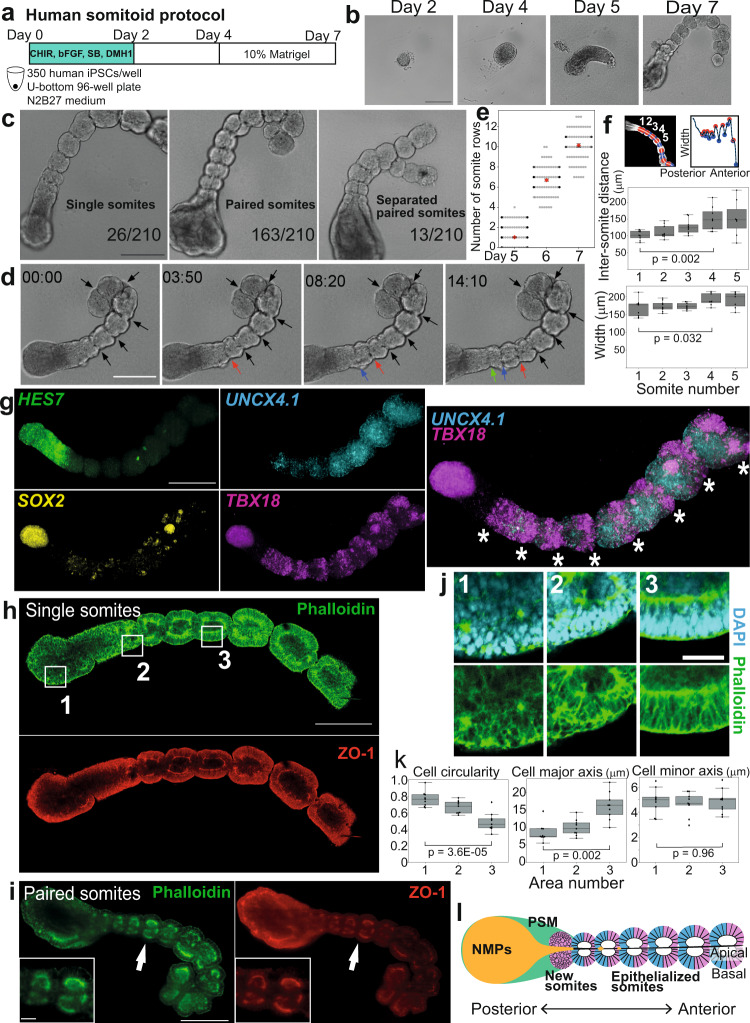
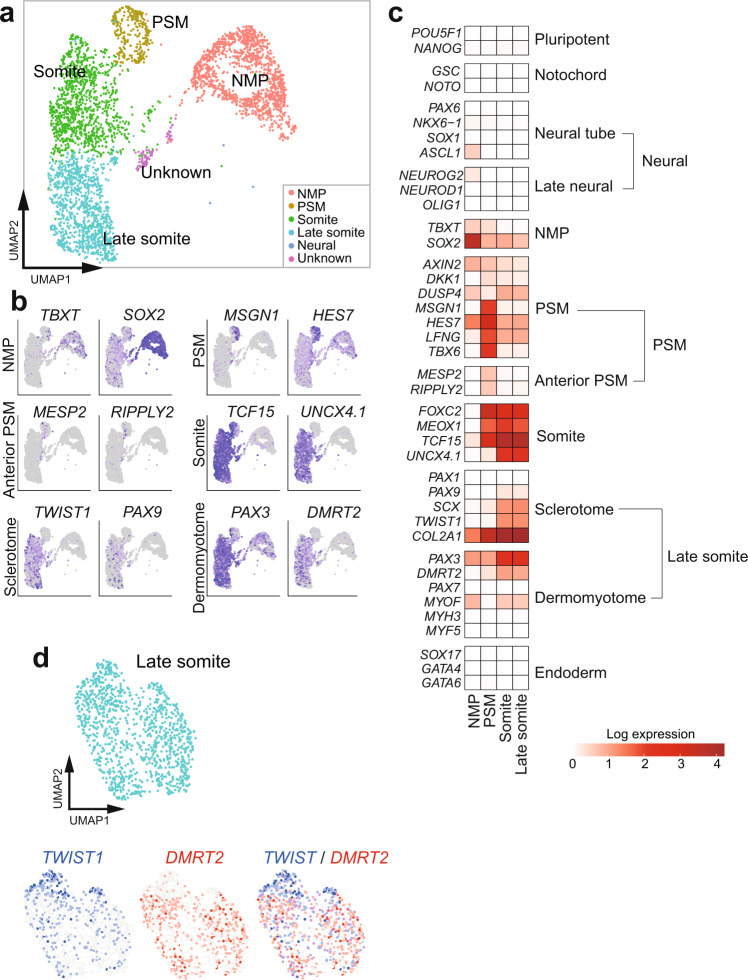
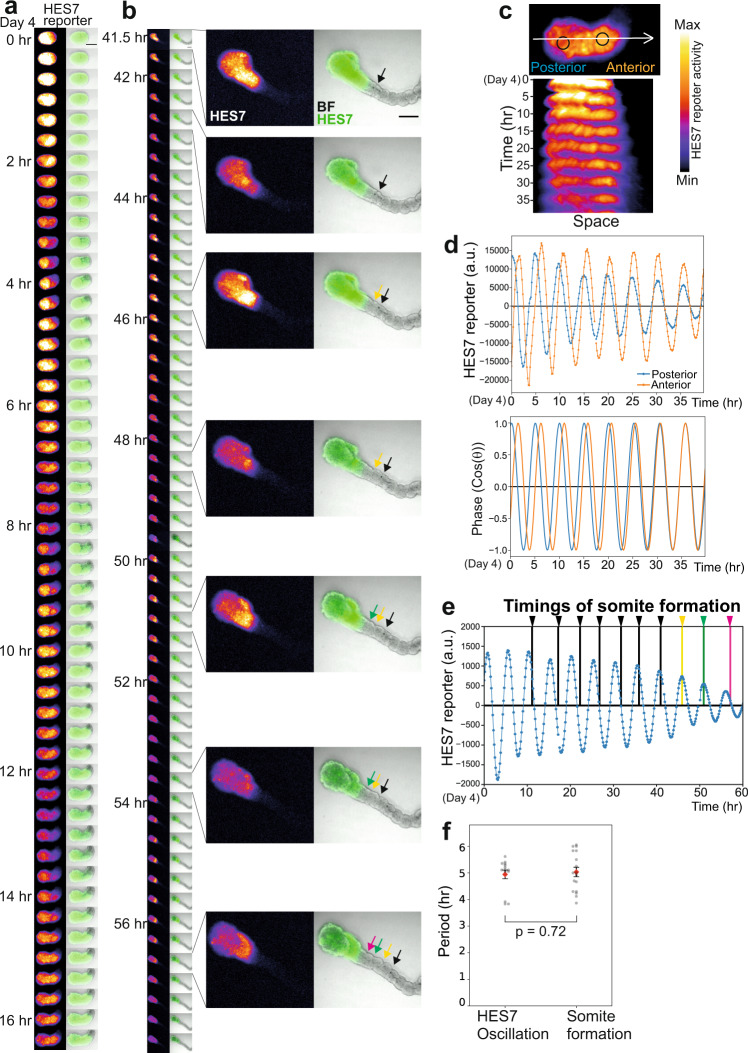
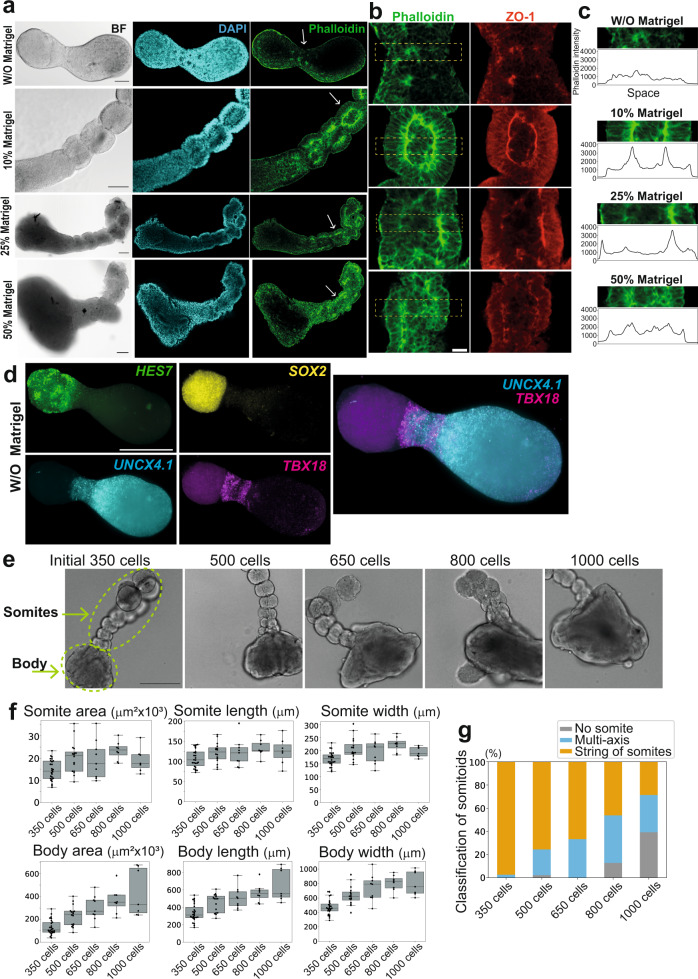
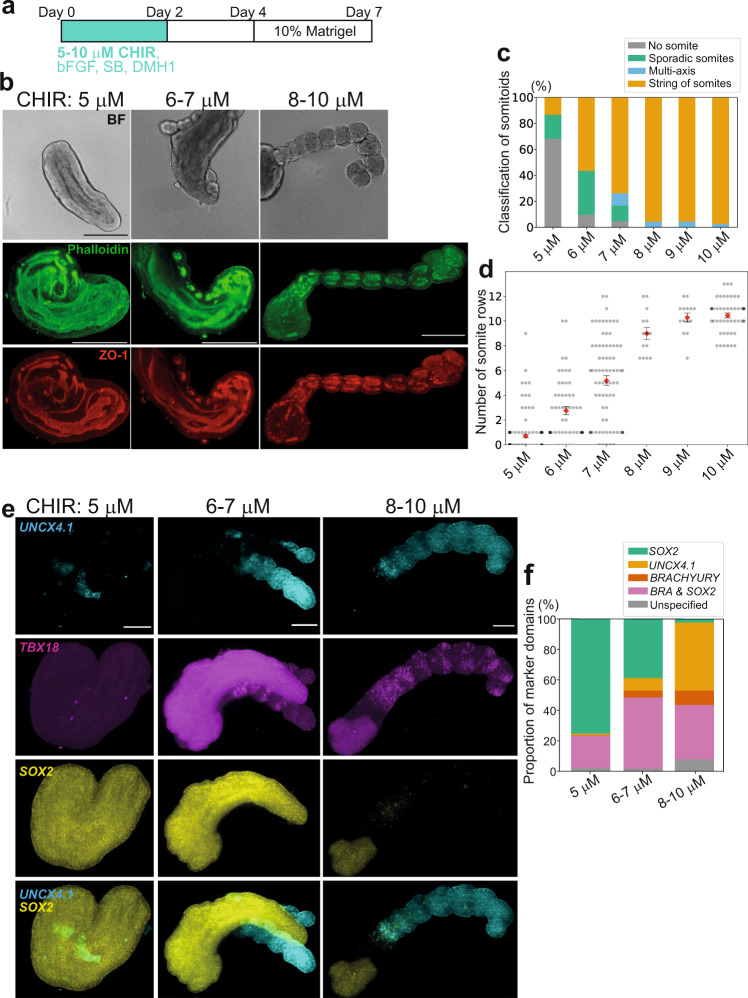
During embryonic development, epithelial cell blocks called somites are periodically formed according to the segmentation clock, becoming the foundation for the segmental pattern of the vertebral column. The process of somitogenesis has recently been recapitulated with murine and human pluripotent stem cells. However, an in vitro model for human somitogenesis coupled with the segmentation clock and epithelialization is still missing. Here, we report the generation of human somitoids, organoids that periodically form pairs of epithelial somite-like structures. Somitoids display clear oscillations of the segmentation clock that coincide with the segmentation of the presomitic mesoderm. The resulting somites show anterior-posterior and apical-basal polarities. Matrigel is essential for epithelialization but dispensable for the differentiation into somite cells. The size of somites is rather constant, irrespective of the initial cell number. The amount of WNT signaling instructs the proportion of mesodermal lineages in somitoids. Somitoids provide a novel platform to study human somitogenesis.


Conflict of interest statement

The authors declare no competing interests.

Figures

Fig. 1
Fig. 1. Generation and characterization of human somitoids.
a Somitoid protocol. 350 human iPSCs were aggregated in a U-bottom plate and treated with CHIR99021, bFGF, SB431542, and DMH1. The cocktail was washed out on day 2, and Matrigel was added on day 4. b Time-course images of somitoid development. c Classification of morphologies of day 7 somitoids. N = 210 from 12 independent experiments. Only the images with entire somitoid structures were used. d Somite formation on day 6. Arrows indicate the somite boundaries. e Quantification of the number of somite rows. Mean ± SEM. N = 284 (day 5), 113 (day 6), and 77 (day 7). 3–15 independent experiments. f The images of day 7 somitoids were segmented, and the width perpendicular to the detected posterior-anterior axis was plotted (top). The somite-to-somite distance and the somite width (middle and bottom). Only somitoids with single somites were measured. Boxplots show median, 75th and 25th percentiles, and max and min. N = 9 (somite number 1–3), 8 (somite number 4), and 7 (somite number 5). P-values are from two-sided paired t-test. g HCR images of day 6 somitoids. Asterisks indicate the stripes of TBX18 expression. N = 8 samples showed similar expression patterns. h IHC images of day 6 somitoid that displayed mostly single somites. N = 10 samples showed similar expression patterns. i IHC images of day 7 somitoids that displayed typical paired somites. N = 5 samples showed similar expression patterns. Insets: Enlarged images of the regions indicated by the arrows. j Enlarged images of the boxed regions in h. k Cell morphometry of Phalloidin images in j. Boxplots show median, 75th and 25th percentiles, and max and min except for outliers. N of measured cells = 9 (Area 1), 9 (Area 2), and 9 (Area 3). P-values are from two-sided student’s t-test. l Schematic diagram of a human somitoid. NMPs: Neuromesodermal progenitors, PSM: Presomitic mesoderm. Scale bars: 300 µm (b, c, d, g, h, i) and 50 µm (inset of i, j). Microscopes: Opera (b, c, d) FV3000 confocal (h, j), and Light-sheet (g, i). Source data are provided as a Source Data file.
Fig. 2
Fig. 2. scRNA-seq analyses of somitoids.
a Uniform manifold approximation and projection (UMAP) plot of day 7 somitoids with 10% Matrigel (N = 27 pooled samples, 3781 cells) colored by the 6 clusters identified in Supplementary Fig. 8a. NMP: Neuromesodermal progenitor, PSM: presomitic mesoderm. The cluster label for Neural is not shown as the cells in this cluster represent less than 0.1% of the total. b UMAP plots colored by the expression of selected marker genes. c Heatmap of the natural log expression of selected marker genes associated with early embryonic development. d Subset analysis of Late somite cells colored by the expression of sclerotome (TWIST1) and dermomyotome (DMRT2) markers (bottom).
Fig. 3
Fig. 3. Somites are formed according to the segmentation clock.
a, b Time-lapse images of the HES7 promoter-luciferase reporter activity in a representative somitoid. The starting point on day 4 was defined as time 0. See also Supplementary Movie 4. Scale bars: 500 µm. Images were taken by an LV200 luminescent microscope. b Enlarged images of several time points are also shown. Arrows indicate the somite boundaries. BF: Bright field. c Kymograph of the HES7 reporter activity measured along the posterior-anterior axis (the white arrow) of the same sample shown in a, b. d Detrended intensity (top) and the oscillation phase (bottom) of the HES7 reporter activity in the same sample shown in a, b. Blue and orange lines indicate the signals measured in the posterior and anterior regions of somitoids, respectively, marked in c. The gaps in the graph correspond to short halts of imaging to adjust the sample position. N = 14 samples showed similar oscillatory patterns. e Relationship between HES7 oscillations and segmentation timings. Detrended HES7 reporter activity of the entire image of the same sample shown in a and b. Arrows indicate the timings of somite formation, and the colors correspond to the arrows in b. f Periods calculated from the HES7 oscillations and somite formation. Mean ± SEM. Each point in the graph indicates an average period of several oscillation peaks or somite formation timings in one sample from day 5 to day 6. N = 14 (HES7 oscillation) and 17 (Somite formation). 5 independent experiments. P-value is from two-sided student’s t-test. Source data are provided as a Source Data file.
Fig. 4
Fig. 4. Effects of Matrigel and the initial cell number on somitoid morphologies.
a Bright field (BF), DAPI staining, and Phalloidin staining images of the somitoids created without (W/O) or with different concentrations of Matrigel. Matrigel was added on day 4, and the images were taken on day 6. Scale bars: 100 µm. All samples stained (N = 6 (W/O Matrigel), 10 (10% Matrigel), 8 (25% Matrigel), and 5 (50% Matrigel)) showed similar expression patterns. b Enlarged images of the regions indicated by the white arrows in a. Different Z-planes were used between a and b to show the images clearly. ZO-1 staining images are also shown. Scale bars: 30 µm. c Enlarged images of the boxed regions in b and their intensity profiles. d HCR images of the day 7 somitoids without Matrigel. Scale bar: 300 µm. N = 4 samples showed similar expression patterns. e Representative images of the day 7 somitoids created from 350, 500, 650, 800, and 1000 cells. The light green dashed lines indicate a string of somites and a body that includes the PSM and NMPs. Scale bar: 350 µm. f Size measurements of the somite and body parts of the somitoids created with different initial cell numbers. The length and width mean the distances along the anterior-posterior axis and its perpendicular axis, respectively. Only the newest somites were measured. Boxplots show median, 75th and 25th percentiles, and max and min except for outliers. N = 26 (350 cells), 16 (500 cells), 9 (650 cells), 8 (800 cells), and 7 (1000 cells). g Classification of the somitoids created with different initial cell numbers. N = 150 (350 cells), 45 (500 cells), 24 (650 cells), 39 (800 cells), and 28 (1000 cells). 5–12 independent experiments. Part of samples of 350 cells is common to Fig. 1c. Microscopes: FV3000 confocal (a), Light-sheet (d), and Opera (e). Source data are provided as a Source Data file.
Fig. 5
Fig. 5. WNT signaling instructs the mesodermal lineage specification.
a Somitoid protocol with altered CHIR concentrations during the initial 2 days. The original protocol uses 8–10 μM CHIR. b Bright field (BF), Phalloidin staining, and ZO-1 staining images of the day 7 somitoids created with different CHIR concentrations. BF samples are different from Phalloidin- and ZO-1-stained samples. Scale bars: 350 µm. All samples stained (N = 3 (5 µM), 7 (6-7 µM), and 5 (8–10 µM)) showed similar expression patterns. c Classification of the day 7 somitoids created with different CHIR concentrations. Sporadic somites mean only 1–2 isolated somites, whereas strings of somites mean more than 3 rows of somites. N = 113 (5 µM), 62 (6 µM), 126 (7 µM), 46 (8 µM), 45 (9 µM), and 150 (10 µM). 4–12 independent experiments. d Quantification of the number of somite rows in the day 7 somitoids created with different CHIR concentrations. Mean ± SEM. N = 112 (5 µM), 56 (6 µM), 77 (7 µM), 14 (8 µM), 14 (9 µM), and 49 (10 µM). 4–12 independent experiments. Only the images with the entire somitoid structures were measured. c, d Part of samples of 8–10 µM is common to Fig. 1c, e. e HCR images of day 6 somitoids. Scale bars: 150 µm. f Volume quantification of lineage marker expression domains using HCR images of day 6 somitoids. SOX2 + & BRACHYURY-: Neural; UNCX4.1 + : Somite; BRACHYURY + & SOX2-: PSM; BRACHYURY + & SOX2 + : NMP. All samples stained (N = 3 (5 µM), 4 (6-7 µM), and 6 (8-10 µM)) showed similar patterns as long as somites were present. Microscopes: Opera (BF of panel b) and Light-sheet (Phalloidin and ZO-1 of b, e). Source data are provided as a Source Data file.

References

    1. Chal, J. & Pourquié, O. Patterning and differentiation of the vertebrate spine. Skelet. Syst. 41–116 (2009).
    1. Hubaud A, Pourquié O. Signalling dynamics in vertebrate segmentation. Nat. Rev. Mol. Cell Biol. 2014;15:709–721. doi: 10.1038/nrm3891. - DOI - PubMed
    1. Saga Y, Takeda H. The making of the somite: molecular events in vertebrate segmentation. Nat. Rev. Genet. 2001;2:835–845. doi: 10.1038/35098552. - DOI - PubMed
    1. O’Rahilly R, Müller F. Somites, spinal ganglia, and centra. Cells Tissues Organs. 2003;173:75–92. doi: 10.1159/000068948. - DOI - PubMed
    1. Turnpenny PD, et al. Abnormal vertebral segmentation and the notch signaling pathway in man. Dev. Dyn. 2007;236:1456–1474. doi: 10.1002/dvdy.21182. - DOI - PubMed

Publication types

Substances