. 2022 Apr 28;13(1):2324.
doi: 10.1038/s41467-022-30056-6.

Enhancement of anaerobic glycolysis - a role of PGC-1α4 in resistance exercise

Affiliations

Enhancement of anaerobic glycolysis - a role of PGC-1α4 in resistance exercise

Jin-Ho Koh et al. Nat Commun. .

Abstract

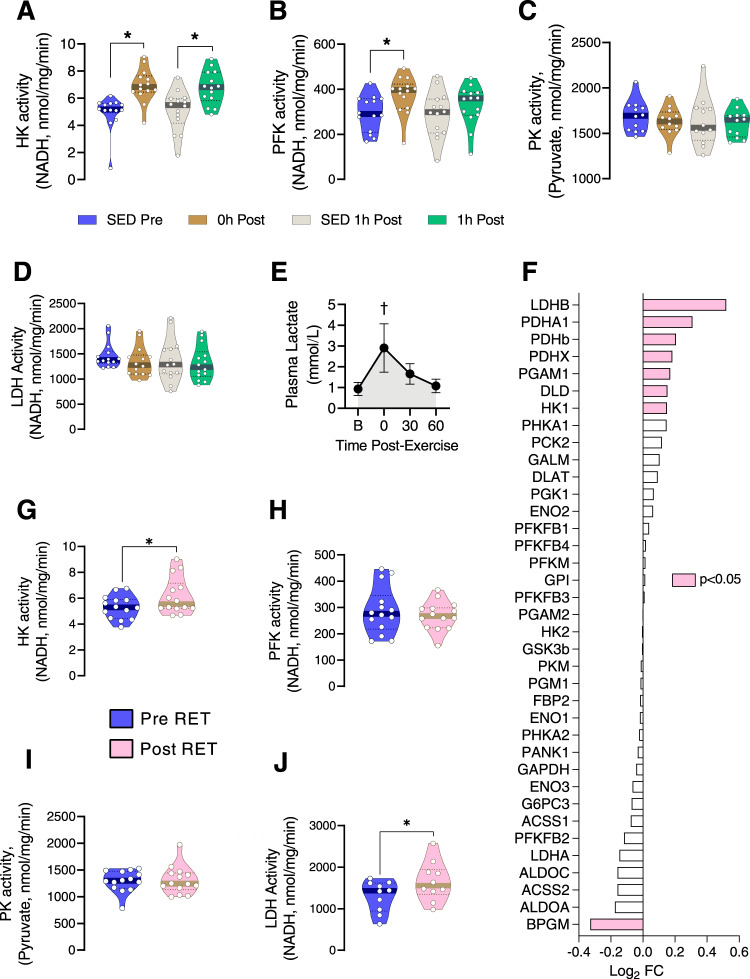
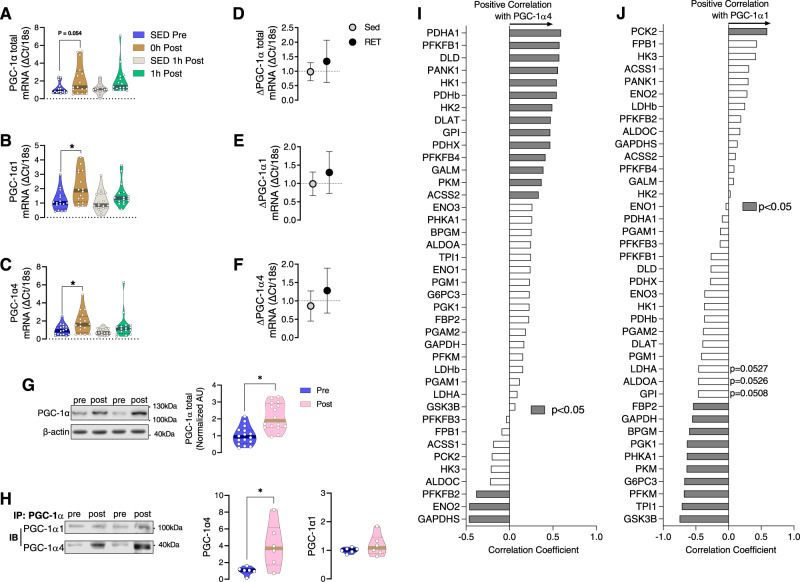
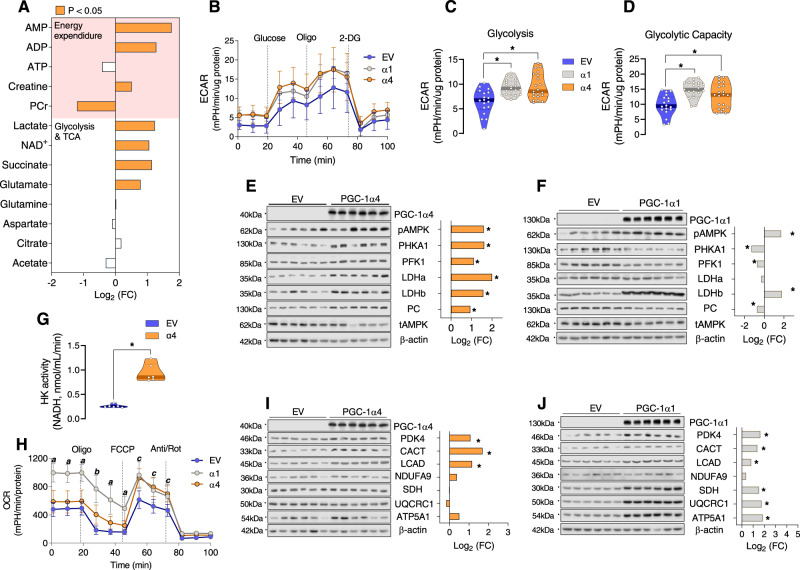
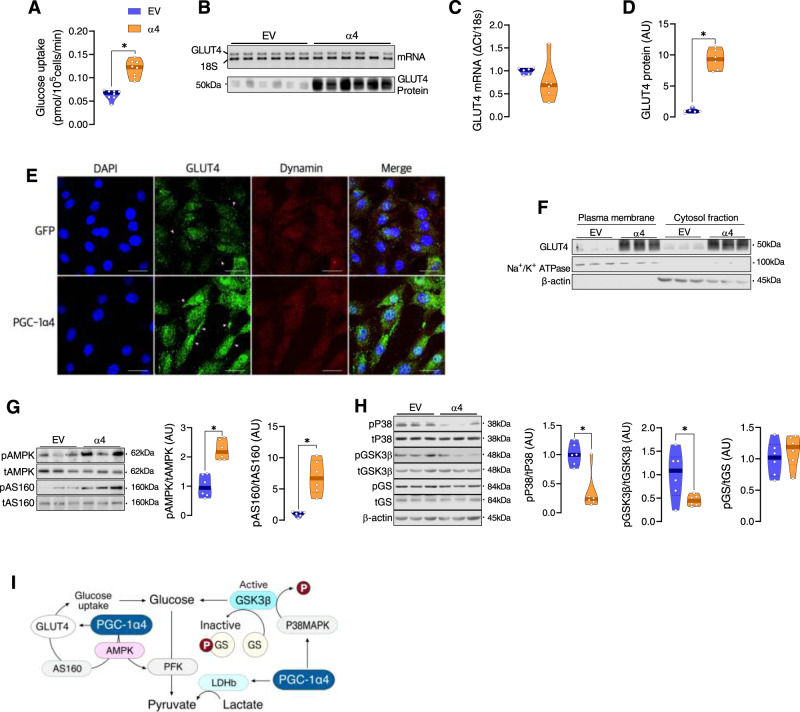
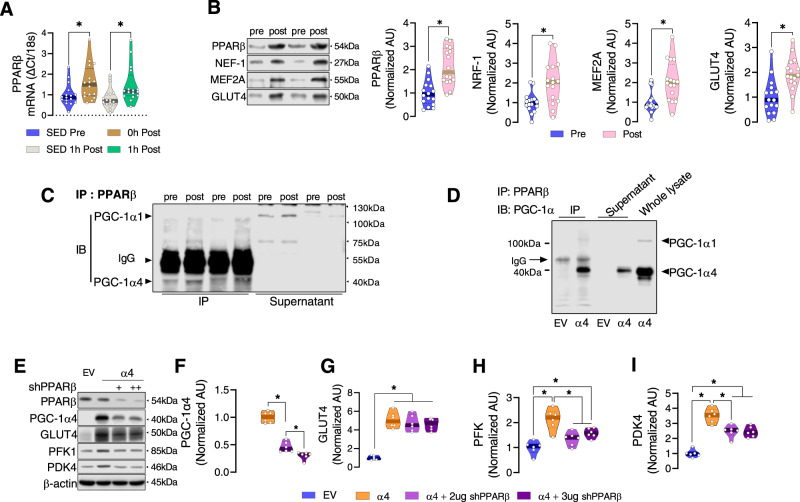
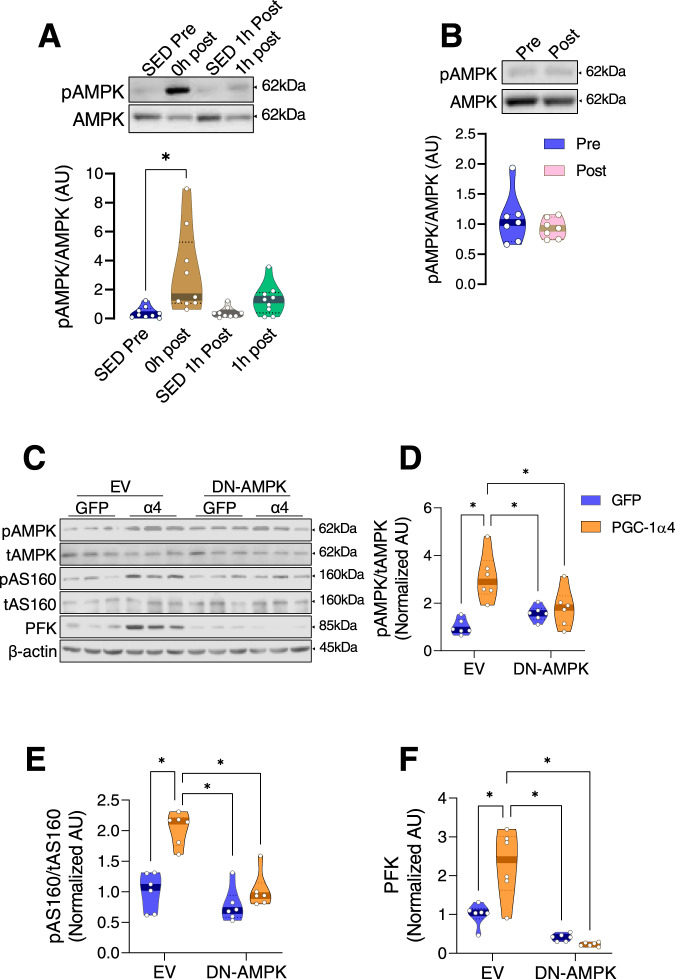
Resistance exercise training (RET) is an effective countermeasure to sarcopenia, related frailty and metabolic disorders. Here, we show that an RET-induced increase in PGC-1α4 (an isoform of the transcriptional co-activator PGC-1α) expression not only promotes muscle hypertrophy but also enhances glycolysis, providing a rapid supply of ATP for muscle contractions. In human skeletal muscle, PGC-1α4 binds to the nuclear receptor PPARβ following RET, resulting in downstream effects on the expressions of key glycolytic genes. In myotubes, we show that PGC-1α4 overexpression increases anaerobic glycolysis in a PPARβ-dependent manner and promotes muscle glucose uptake and fat oxidation. In contrast, we found that an acute resistance exercise bout activates glycolysis in an AMPK-dependent manner. These results provide a mechanistic link between RET and improved glucose metabolism, offering an important therapeutic target to counteract aging and inactivity-induced metabolic diseases benefitting those who cannot exercise due to many reasons.


Conflict of interest statement

The authors declare no competing interests.

Figures

Fig. 1
Fig. 1. Resistance exercise upregulates glycolysis in human skeletal muscle.
AD The enzyme activity of hexokinase (HK), phosphofructokinase (PFK), pyruvate kinase (PK), and lactate dehydrogenase (LDH) were analyzed from muscle biopsies of healthy participants before (SED Pre), within 10 min after (0 h Post), and 1 h after (1 h Post) a one-legged resistance exercise (RE) bout (n = 14 for HK, PFK and LDH; n = 12 for PK). Time-matched control muscle samples were obtained from the non-exercised leg at 1 h post-RE (SED Post). *P < 0.05 vs. SED in each group. One-way ANOVA was used with multiple comparisons. E Plasma lactate was measured at baseline (B), immediately post-exercise (0), 30 min post-exercise (30), and 60 min post-exercise (60) to represent the “spill over” of lactate from muscle to blood (n = 17). † indicates a significant difference between the immediate post-exercise and baseline lactate samples (P < 0.05). F RNA-Seq data for glycolysis-related genes in muscle after resistance exercise training (RET) (n = 18). Data were analyzed from RNA-Seq results presented in our previous publication. GJ Muscles were obtained before (pre-RET) and after (post-RET) 12 weeks of RET and subsequently analyzed for HK, PFK, PK, and LDH activity (n = 14 for HK, PFK, and PK; n = 10 for LDH). *P < 0.05 vs. pre-RET. Paired two-tailed t-test was used. Values are expressed as individual data points, Log2 FC, or mean ± SD. Significant labeled P-values in each panel from left to right are as follows: panel A = 0.001 and 0.007; panel B = 0.004; panel E = < 0.001; panel G = 0.009; panel J = 0.004.
Fig. 2
Fig. 2. Resistance exercise increases PGC-1α4 expression which is correlated with glycolytic gene expression in human skeletal muscle.
AC Quantification of PGC-1α-total, PGC-1α1, and PGC-1α4 mRNA was done by qPCR using muscle biopsy samples of healthy participants before (SED Pre), within 10 min after (0 h Post), and 1 h after (1 h Post) a one-legged resistance exercise (RE) bout (n = 16). Time-matched control muscle samples were obtained from the non-exercised leg at 1 h post-RE (SED 1 h Post) (n = 16 per group). One-way ANOVA was used with multiple comparisons. DF Participants performed resistance training (RET) for 12 weeks or remained sedentary (Sed) and muscle biopsies were obtained 72 h after the last bout of exercise. ΔPGC-1α total mRNA, ΔPGC-1α1 mRNA, and ΔPGC-1α4 mRNA were measured by qPCR before (Pre) and after (Post) 12 weeks of RET or Sed (n = 13 for PGC-1α total, PGC-1α1, and PGC-1α4 RET; n = 12 muscles for PGC-1α4 Sed). Unpaired two-tailed t-tests were used. G Protein abundance of total PGC-1α is displayed before and after RET (n = 16 per group). Paired two-tailed t-test was used. H Total PGC-1α was immunoprecipitated followed by immunoblotting for PGC-1α1 and PGC-1α4. Owing to the large amount of protein required to immunoprecipitate enough PGC-1α for immunoblot detection of PGC-1α1 and PGC-1α4, samples of multiple participants before and after training were pooled together, resulting in a smaller n for PGC-1α isoform quantification (n = 6). Unpaired two-tailed t-test was used. I Correlation between PGC-1α4 gene expression (measured by qPCR) and multiple glycolysis-related genes (measured by RNAseq) in skeletal muscle from sedentary participants (n = 35 from Robinson 2017 et al.; filled bars indicate significant correlation at P < 0.05). J Correlation between PGC-1α1 gene expression (measured by qPCR) and multiple glycolysis-related genes (measured by RNAseq) in skeletal muscle from sedentary participants (n = 35 from Robinson 2017 et al.; filled bars indicate significant correlation at P < 0.05). *P < 0.05. Values are expressed as individual data points, Log2 FC, or mean ± SD. Significant labeled P-values in each panel are as follows: panel A = 0.054; panel B = 0.04; panel C = 0.047; panel G = < 0.001; panel H = 0.023.
Fig. 3
Fig. 3. Overexpressing PGC-1α4 in mouse myotubes enhances glycolysis.
A Bioenergetic metabolites were analyzed by NMR in myotubes transfected with an empty vector or an adenovirus overexpressing PGC-1α4 (n = 6 per group). Data are presented as log2 fold-change (FC) induced by PGC-1α4 overexpression. The orange colored bars represent a significantly changed value (P < 0.05). BD Glycolysis was measured in myotubes following PGC-1α1 (α1) or PGC-1α4 (α4) overexpression using a Seahorse instrument. Values from α1 and α4 myotubes were compared to myotubes transfected with and empty vector (EV). Glucose, oligomycin (an inhibitor of oxidative phosphorylation which blocks ATP synthase), and 2-Deoxy-d-glucose (2-DG) were sequentially added to identify the change in extracellular acidification rate (ECAR). Glycolysis (measured in cells during exposure to glucose) and Glycolytic capacity (measured after exposure to oligomycin) were assessed by computing area under the curve using software of the Seahorse analyzer. One-way ANOVA was used with multiple comparisons. E, F The abundances of glycolysis-related proteins were analyzed following α4 and α1 overexpression in myotubes by immunoblotting. Unpaired two-tailed t-tests were used. G Hexokinase activity was measured in myotubes transfected with EV or α4. Unpaired two-tailed t-tests were used. H Oxygen consumption rate (OCR) was determined in myotubes overexpressing α4 or α1, and myotubes transfected with an EV by Seahorse analyzer. Oligomycin, FCCP (uncoupler), and antimycin/rotenone were sequentially added, and OCR was measured. At P < 0.05, “a” indicates that α1 > EV and α4; “b” indicates that α1 > EV and α4, but also α4 > EV; and “c” indicates that both α1 and α4 > EV. One-way ANOVA was used with multiple comparisons. I, J The abundance of fatty acid metabolism-related proteins and mitochondrial enzymes were analyzed following overexpression of α4 or α1 in myotubes by immunoblotting. Data are presented as log2 fold-change (FC) by PGC-1α isoform overexpression versus EV controls (n = 6 per group). Unpaired two-tailed t-tests were used. *P < 0.05 versus EV. Values are expressed as individual data points, Log2 FC, or mean ± SD. Significant labeled P-values in each panel from left to right are as follows: panel C = < 0.001 and <0.001; panel D = < 0.001 and 0.017; panel G = < 0.001.
Fig. 4
Fig. 4. PGC-1α4 overexpression enhances cellular glucose uptake.
A Glucose uptake was assessed using a bioluminescent kit assay in myotubes transfected with an empty vector (EV) or an adenovirus overexpressing PGC-1α4 (α4) (n = 8 per group). Unpaired two-tailed t-test was used. BD GLUT4 mRNA was measured by semiquantitative RT-PCR, and GLUT4 protein content was measured by immunoblotting in myotubes expressing EV or overexpressing α4 (n = 6). Unpaired two-tailed t-tests were used. E GLUT4 antibody detection (green) and DAPI staining (blue) in cells transfected with EV or α4 show clustering of greater GLUT4 near the dynamin-labeled (red) cell membrane in α4 myoblasts. Experiments in panel E were repeated three times with similar results. White scale bars in each image are 30 µm in length. F GLUT4 was measured in the plasma membrane (indicated by the presence of Na+/K+ ATPase) and cytosolic (indicated by the presence of β-actin) fractions from myotubes transfected with EV or α4 (n = 3). G, H Representative immunoblots and quantification of phosphorylated AMPK, AS160, P38, GSK3β, and GS in cells transfected with EV or α4 are shown. Data are expressed as the phosphorylation of each signaling protein normalized to the abundance of its total protein content (n = 6 per group). Unpaired two-tailed t-tests were used. I Diagram of the hypothetical role of PGC-1α4 in glucose metabolism in muscle cells. PGC-1α4 enhances signaling and transport machinery to bring glucose into the cell, as well as the glycolytic enzymes necessary for metabolizing glucose. Further, inhibition of key signaling events involved in glycogen synthesis by PGC-1α4 suggest a favorable role of PGC-1α4 in glycolysis. *P < 0.05 versus EV. Values are expressed as individual data points. Significant labeled P-values in each panel from left to right are as follows: panel A = < 0.001; panel D = < 0.001; panel G = < 0.001 and <0.001; panel H = 0.002 and 0.027.
Fig. 5
Fig. 5. Resistance exercise training-induced PGC-1ɑ4 cooperates with PPARβ to regulate glycolysis.
A PPARβ mRNA was determined by qPCR in muscle biopsy samples of healthy participants before (SED Pre), within 10 min after (0 h Post), and 1 h after (1 h Post) a one-legged resistance exercise (RE) bout (n = 16). Time-matched control muscle samples were obtained from the non-exercised leg at 1 h post-RE (SED 1 h Post) (n = 16 per group). One-way ANOVA was used with multiple comparisons. B Protein abundance of PPARβ and its downstream related proteins was determined in muscle before (Pre) and after (Post) RET. Representative immunoblots for each protein and quantification of the relative change after training for PPARβ, NRF-1, MEF2A, and GLUT4 are displayed (n = 16). Paired two-tailed t-tests were used. C PPARβ was immunoprecipitated from pooled muscle samples before (pre) and after (post) RET, then the immunoprecipitate was immunoblotted for PGC-1α1 and PGC-1α4 to determine binding between PPARβ with PGC-1α1 and PGC-1α4. Owing to the large amount of protein required to immunoprecipitate enough PPARβ for immunoblot detection of PGC-1α1 and PGC-1α4, samples of multiple participants before and after training were pooled together, resulting in a smaller n for PGC-1α isoform quantification (n = 2). D The binding between PPARβ and PGC-1α isoforms was confirmed using cells overexpressing PGC-1α4. Experiment shown in panel D was performed once. EI PPARβ was silenced by shPPARβ overexpression in myotubes, then PGC-1α4 was overexpressed (n = 6). The abundance of some of the important glycolytic proteins (GLUT4, PFK1, and PDK4) was determined by immunoblotting. One-way ANOVAs were used with multiple comparisons. *P < 0.05. Values are expressed as individual data points. Significant labeled P-values in each panel from left to right are as follows: panel A = 0.024 and 0.020; panel B = < 0.001, 0.002, <0.001, <0.001; panel F = < 0.001 and 0.010; panel G = < 0.001; panel H = < 0.001, <0.001, and <0.018; panel I = < 0.001, <0.001, and 0.002.
Fig. 6
Fig. 6. The influence of PGC-1ɑ4 on muscle glycolysis is AMPK dependent.
A, B Representative immunoblots and quantification of phosphorylated AMPK in human muscle obtained after an acute resistance exercise bout (A) or after RET (B). One-way ANOVA was used with multiple comparisons for panel A, and paired two-tailed t-test was used for panel B. Data are expressed as the phosphorylation of each signaling protein normalized to the abundance of its total protein content (n = 9 for acute RE, n = 7 for RET). CF Representative immunoblots and quantification of AMPK, AS160, and PFK in cells transfected with GFP or PGC-1α4 after EV or DN-AMPK transduction are shown. Data are expressed as the phosphorylation of each signaling protein normalized to the abundance of its total protein content and PFK was normalized with β-actin (n = 6 per group). One-way ANOVAs were used with multiple comparisons *P < 0.05 versus empty vector (EV). Values are expressed as individual data points. Significant labeled P-values in each panel from left to right are as follows: panel A = 0.013; panel D = < 0.001, 0.005, and 0.033; panel E = < 0.001, <0.001, and <0.001; panel F = 0.006, <0.001, and <0.001.

References

    1. Short KR, Nair KS. Mechanisms of sarcopenia of aging. J. Endocrinol. Invest. 1999;22:95–105. - PubMed
    1. Goodpaster BH, et al. The loss of skeletal muscle strength, mass, and quality in older adults: the health, aging and body composition study. J. Gerontol. A Biol. Sci. Med. Sci. 2006;61:1059–1064. doi: 10.1093/gerona/61.10.1059. - DOI - PubMed
    1. Park SW, et al. Accelerated loss of skeletal muscle strength in older adults with type 2 diabetes: the health, aging, and body composition study. Diabetes Care. 2007;30:1507–1512. doi: 10.2337/dc06-2537. - DOI - PubMed
    1. Park SW, et al. Excessive loss of skeletal muscle mass in older adults with type 2 diabetes. Diabetes Care. 2009;32:1993–1997. doi: 10.2337/dc09-0264. - DOI - PMC - PubMed
    1. Nair KS. Aging muscle. Am. J. Clin. Nutr. 2005;81:953–963. doi: 10.1093/ajcn/81.5.953. - DOI - PubMed

Publication types