. 2022 Apr 28;13(1):2331.
doi: 10.1038/s41467-022-30010-6.

Molecular and functional heterogeneity in dorsal and ventral oligodendrocyte progenitor cells of the mouse forebrain in response to DNA damage

Affiliations

Molecular and functional heterogeneity in dorsal and ventral oligodendrocyte progenitor cells of the mouse forebrain in response to DNA damage

Enrica Boda et al. Nat Commun. .

Abstract

In the developing mouse forebrain, temporally distinct waves of oligodendrocyte progenitor cells (OPCs) arise from different germinal zones and eventually populate either dorsal or ventral regions, where they present as transcriptionally and functionally equivalent cells. Despite that, developmental heterogeneity influences adult OPC responses upon demyelination. Here we show that accumulation of DNA damage due to ablation of citron-kinase or cisplatin treatment cell-autonomously disrupts OPC fate, resulting in cell death and senescence in the dorsal and ventral subsets, respectively. Such alternative fates are associated with distinct developmental origins of OPCs, and with a different activation of NRF2-mediated anti-oxidant responses. These data indicate that, upon injury, dorsal and ventral OPC subsets show functional and molecular diversity that can make them differentially vulnerable to pathological conditions associated with DNA damage.


Conflict of interest statement

The authors declare no competing interests.

Figures

Fig. 1
Fig. 1. DNA damage and defective oligodendroglia differentiation in Cit-k KO mouse and CIT-K fs/fs human forebrain.
ad γH2AX+ cell nuclei (red in a, b; brown in c, d) in P14 Cit-k KO mouse (b) and human newborn (P1) CIT-K fs/fs (d) forebrain parenchyma. ef GPR17 (green) protein expression in P14 WT (e) and Cit-k KO (f) mouse brain. gj Myelination (Luxol Fast Blue staining) in the CC and cerebellar white matter of human Ctrl (g, h) and CIT-K fs/fs subjects (i, j). kp MBP (red) protein expression in P14 WT (k, m, n) and Cit-k KO (l, o, p) mouse brain. qv Absence of myelin in Cit-k KO mouse brain, as revealed by Gallyas staining (brown) in P14 WT (q, s, t) and Cit-k KO (r, u, v) forebrain and spinal cord. w, x Smi32 (red) and Smi31 (green) neurofilament expression pattern reveals the presence of axons in both P14 WT (w) and Cit-k KO (x) mouse brain. yz Representative cross-sectional images of P14 WT (y) and Cit-k KO (z) corpus callosum obtained by EM. Scale bars: 100 µm in ap, 200 µm in w, x, qv, 0.5 µm in y, z. ac anterior commissure, CC corpus callosum, DBB diagonal band of Broca, Dors. Ctx. dorsal cortex, EM electron microscopy, P postnatal day, Str striatum, Sub-Ctx WM subcortical white matter, WT wild-type.
Fig. 2
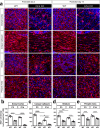
Fig. 2. Cit-k loss differentially affects dorsal and ventral OPCs in the postnatal mouse forebrain.
a NG2+ (red) cells in distinct regions of WT vs. Cit-k KO mouse forebrain. DAPI (blue) counterstains cell nuclei. Scale bar: 20 µm. be NG2+ cell density in the dorsal cortex (b), corpus callosum (c), striatum (d), and preoptica area (e) at P3 and P14 (n = 5 each; Two-way Anova followed by Bonferroni’s Multiple Comparison Test, Dors. Ctx: Genotype effect: P < 0.0001; Time effect: P < 0.0001; Genotype × Time: P = 0.0013. CC: Genotype effect: P < 0.0001; Time effect: P < 0.0001; Genotype × Time: P < 0.0001. Str: Genotype effect: P < 0.0001; Time effect: P = 0.0096; Genotype × Time: n.s. POA: Genotype effect: P < 0.0001; Time effect: n.s.; Genotype × Time: n.s.). Data are mean ± SE. CC corpus callosum, Dors. Ctx. dorsal cortex POA, preoptica area, P postnatal day, WT wild-type. ***P < 0.001; **P < 0.01, *P < 0.05. Source data are provided as a Source Data file.
Fig. 3
Fig. 3. Lineage-tracing approaches show that dorsal oligodendrogenesis is preserved in Cit-k KO mouse forebrain.
a RV-based lineage-tracing approach. b, c) Oligodendroglial cells (NG2+, red) in P7 WT (b right) or Cit-k KO (c right) mouse dorsal cortices derived from VZ/SVZ precursors (GFP+, green) targeted by the RV (b left, c left). White arrowheads in b right and c right indicate NG2+ OPCs. d Absolute numbers/hemisection of RV-targeted (GFP+) cells in the dorsal SVZ (dSVZ; WT n = 4, KO n = 3; two-tailed Mann–Whitney U-test, P = 0.057) and of their OPC (GFP+/NG2+) progeny in the dorsal cortex (dOPCs; WT n = 4, KO n = 3; two-tailed Mann–Whitney U-test, n.s.). e Ratio between the number of GFP+/NG2+ cells in the dorsal cortex (dOPCs) and the number GFP+ dSVZ precursors/hemisection (WT n = 4, KO n = 3; two-tailed Mann–Whitney U-test, n.s.). f TAT-Cre-based lineage-tracing approach. (g left, h left) Recombined (YFP+, green) VZ/SVZ precursors in WT (R26RYFP; g left) and Cit-k KO (Cit-k KO;R26RYFP; h left) mice. (g right, h right) OPC (PDGFRα+, red) progeny (YFP+, green) in the dorsal cortex of WT (g right) and Cit-k KO (h right) mice. White arrowheads in g right and h right indicate PDGFRα+ OPCs. i Absolute numbers/hemisection of recombined (YFP+) cells in the dorsal SVZ (dSVZ; WT n = 6, KO n = 4; two-tailed Mann–Whitney U-test, P = 0.0095) and of their OPC (YFP+/ PDGFRα+) progeny in the dorsal cortex (dOPCs, WT n = 6, KO n = 4; two-tailed Mann–Whitney U-test, n.s.). j Ratio between the number of YFP+/NG2+ cells in the dorsal cortex (dOPCs) and the number YFP+ dSVZ progenitors/hemisection (WT n = 6, KO n = 4; two-tailed Mann–Whitney U-test, P = 0.0143). k Emx1Cre;R26RYFP mouse-based lineage-tracing approach. l, m Progeny (YFP+, green) of Emx1-expressing progenitors in the dorsal cortex and subcortical white matter of WT (Emx1Cre;R26RYFP; l left) and Cit-k KO (Emx1Cre;R26RYFP Cit-k KO; m left) mice. (l right, m right) Oligodendroglial (NG2+, red) progeny (YFP+, green) in the dorsal cortex of WT (l right) and Cit-k KO (m right) mice. n Quantification of NG2+ cells positive or negative for YFP in the dorsal cortex (n = 5 each; two-tailed Unpaired t-test, YFP+: n.s, t(8) = 1.732; YFP-negative: P < 0.0001, t(8) = 9.878). o NG2CreERTM;R26RYFP mouse-based lineage-tracing approach. p, q Progeny (YFP+, green) of NG2-expressing progenitors targeted at E14 in the striatum of P10 WT (NG2CreERTM;R26RYFP; p) and Cit-k KO (NG2-CreERTM;R26RYFP Cit-k KO; q) mice (NG2 in red). White arrowheads in p and q indicate YFP+ cells in the striatum. r Mean absolute number/hemisection of YFP+/NG2+ cells in distinct forebrain regions at P10 in WT and KO (n = 3 each, two-tailed Mann–Whitney U-test, n.s. in all regions). In e, j, n, r) data are mean ± SE. In d, i lines connect paired samples (i.e., dSVZ cell and dOPC values of the same mouse). DAPI (blue) in b, c, g, h, l, m, p, q counterstains cell nuclei. Scale bars: 20 µm in b right, c right, g right, h right, l right, m right; 100 µm in b left, c left, g left, h left, l left, m left, 200 µm in p left, q left; 10 µm in p right, q right. B-L Ctx baso-lateral cortex, CC corpus callosum, Dors. Ctx. dorsal cortex, dSVZ dorsal subventricular zone, GFP green fluorescent protein, LV lateral ventricle, P postnatal day, POA preoptica area, RV retrovirus, sacrif. sacrifice, Str striatum, WT wild-type, wm white matter, YFP yellow fluorescent protein. ***P < 0.001; **P < 0.01, *P < 0.05. Source data are provided as a Source Data file.
Fig. 4
Fig. 4. Dorsal OPCs undergo apoptosis, while ventral OPCs enter cell senescence in Cit-k KO mice.
a Percentage of cCASP3+ OPCs in distinct regions of P3 and P10 WT and Cit-k KO mice (Chi-Square Test: P3, P = 0.0156 χ2(3) = 10.38, WT = 3; KO = 4; P10, P < 0.0001 χ2(3) = 23.20, WT = 3; KO = 4). b, c Apoptotic (cCASP3+, red in b, green in c) oligodendroglial (NG2+, green in b; OLIG2+ red in c) cells in Cit-k KO mouse brain. DAPI (blue) counterstains cell nuclei. df SA-βGAL staining (blue) in the dorsal cortex (d), striatum (e), and preoptica area (f) of P14 Cit-k KO mice. g, g’ SA-βGAL+ (blue)/Sox10+ (brown) oligodendroglial cells in Cit-k KO mouse striatum. Black arrowheads indicate SA-βGAL+ cells. h SA-βGAL staining (blue) in OPCs MACSorted from P10 WT and Cit-k KO mice. dOPCs were isolated from the dorsal cortex. vOPCs were isolated from the ventral forebrain. i Percentage of SA-βGAL+ cells among MACSorted dOPCs and vOPCs of P10 WT and Cit-k KO mice (Chi-Square Test, P < 0.0001, χ2(3) = 456.9, WT dOPCs = 3; WT vOPCs, KO dOPCs and vOPCs = 4 mice). j, k Western blotting (j) and densitometric analysis (k) of p21, p53, phospho-p53 (P-p53), p16, p27 protein expression in P10 Cit-k KO dOPCs vs. vOPCs (n = 4/group; p21: P = 0.0249, t(3) = 4.185; p53: n.s., t(3) = 0.947; phospho-p53/p53: n.s., t(3) = 1.695; p16: P = 0.0041, t(3) = 8.017; p27: P = 0.0449, t(3) = 3.325, Two-tailed Paired t-test). l Expression of mRNAs coding for apoptosis- and senescence-associated proteins in dOPCs and vOPCs MACSorted from P10 WT and Cit-k KO mice (Two-way Anova followed by Bonferroni’s Multiple Comparison Test: n, P and F values in Supplementary Table 1). m Percentage of BrdU+/NG2+ cells 1 days after BrdU administration, in P10 WT and Cit-k KO mouse striatum (n = 4/group. Chi-Square Test, P = 0.0007, χ2(1) = 11.60). In a, m data are mean ± SE. In i, k, l lines connect paired samples (i.e., dOPC and vOPC samples from the same mouse). In i, l orange and blue lines represent mean (solid line) ± SE (dotted lines) of WT dOPCs and WT vOPCs, respectively. Scale bars: 10 µm in b, c, g, g’; 100 µm in df; 5 µm in h. BrdU 5-bromo-2’-deoxyuridine, CC corpus callosum, cCASP3 cleaved-caspase 3, dOPC dorsal oligodendrocyte progenitor cell, Dors. Ctx. dorsal cortex, P postnatal day, POA preoptica area, SA-βGAL senescence-associated β-galactosidase, Str striatum, vOPC ventral oligodendrocyte progenitor cell, WT wild-type; *P < 0.05; **P < 0.01; ***P < 0.001. Source data are provided as a Source Data file.
Fig. 5
Fig. 5. Alternative fates of Cit-k KO dorsal vs. ventral OPCs are due to cell-intrinsic factors and associated with their diverse developmental origin.
a NG2+ (red) cells in distinct regions of Sox10Cre (Ctrl) vs. Sox10Cre;Cit-kfl/fl mouse forebrain at P14. b NG2+ cell density in the dorsal cortex, corpus callosum, striatum and preoptica area at P14 (Sox10Cre n = 4; Sox10Cre;Cit-kfl/fl n = 5. Two-tailed Unpaired t-test, Dors. Ctx: P = 0.0073, t(7) = 3.741; CC: P = 0.0038, t(7) = 4.249; Str: n.s.; POA: n.s.). c Percentage of cCASP3+ OPCs in distinct regions of P14 Sox10Cre (Ctrl; n = 3) vs. Sox10Cre;Cit-kfl/fl (n = 5) mice (Chi-Square Test, Dors.Ctx/CC: P < 0.0001, χ2(1) = 15.98). (inset) Representative PDGFRα+(green)/cCASP3+(red) OPC in Sox10Cre;Cit-kfl/fl mouse cortex. d SA-βGAL+(blue)/Sox10+(brown) oligodendroglial cells in Sox10Cre;Cit-kfl/fl mouse striatum. e Expression of mRNAs coding for apoptosis- and senescence- associated proteins in dOPCs vs. vOPCs MACSorted from P10 Sox10Cre;Cit-kfl/fl mice (Two-tailed Paired t-test, n = 4/group; Bbc3, n.s.; p21, P = 0.049, t(3) = 3.204; Ecrg4: P = 0.011, t(3) = 5.744). f NG2+ (red) cells in the CC and deep layers of the dorsal cortex of Emx1Cre;R26RYFP (Ctrl) vs. Emx1Cre;R26RYFP;Cit-kfl/fl P14 mice. YFP (green)-positivity identifies cells derived from dorsal Emx1+ progenitors. g NG2+ (red) cells in the preoptic area of Nkx2.1Cre;R26RYFP (Ctrl) vs. Nkx2.1Cre;R26RYFP;Cit-kfl/fl P14 mice. YFP (green)-positivity identifies cells derived from ventral Nkx2.1+ progenitors. h NG2+ and NG2+/YFP+cell density in the dorsal cortex and corpus callosum of P14-P16 Emx1Cre;R26RYFP (Ctrl, n = 4) vs. Emx1Cre;R26RYFP;Cit-kfl/fl (n = 4. Two-tailed Mann–Whitney U-test, Dors. Ctx: tot: n.s.; YFP + : 0.028; CC: tot: n.s.; YFP + : 0.028). i Percentage of cCASP3+ OPCs in Dors.Ctx/CC of P14-P16 Emx1Cre;R26RYFP (Ctrl, n = 3) vs. Emx1Cre;R26RYFP;Cit-kfl/fl (n = 4) mice (Chi-Square Test: Dors.Ctx/CC: P = 0.0038, χ2(1) = 8.362). j NG2+ and NG2+/YFP+cell density in the preoptica area of P14-P16 Nkx2.1Cre;R26RYFP (Ctrl, n = 4) vs. Nkx2.1Cre;R26RYFP;Cit-kfl/fl (n = 4. Two-tailed Mann–Whitney U-test, tot: n.s.; YFP + : n.s.). Data in b, c, h, i, j are mean ± SE. In e lines connect paired samples (i.e., dOPC and vOPC samples from the same mouse). DAPI (blue) in a, f, g counterstains cell nuclei. Scale bars: 30 µm in a, f, g; 10 µm in d. CC corpus callosum, Ctrl control, Dors. Ctx. dorsal cortex, POA preoptica area, P postnatal day. ***P < 0.001; **P < 0.01, *P < 0.05. Source data are provided as a Source Data file.
Fig. 6
Fig. 6. Cit-k KO dorsal OPCs are more vulnerable to oxidative stress compared to Cit-k KO ventral OPCs.
a γH2AX expression in acutely MACS-isolated OPCs of P10 Cit-k KO mice. b Number of γH2AX+ foci in dOPCs vs. vOPCs (n = 3 each, two-tailed Mann–Whitney U-test, n.s.). c DHE labeling in acutely MACS-isolated OPCs of P10 Cit-k KO mice. d DHE integrated density in dOPCs vs. vOPCs (n = 5 each, Two-tailed Paired t-test, **P = 0.0013, t(4) = 8.043). e NBT reduction assay in Cit-k KO dOPCs vs. vOPCs (normalized to dOPC mean value. n = 4/group, Two-way Anova: Genotype: P < 0.0001, F(1,21) = 92.83; Region: P = 0.0067, F(1,21) = 9.045; Genotype × Region: P = 0.0204, F(1,21) = 6.288). Orange and blue lines represent mean (solid line) ± SE (dotted lines) of WT dOPCs and WT vOPCs, respectively. f, g Western blotting (f) and densitometric analysis (g) of γH2AX and NRF2 protein expression in P10 Cit-k KO dOPCs vs. vOPCs (n = 4/group; γH2AX: n.s.; NRF2: P = 0.0155, t(3) = 4.984, Two-tailed Paired t-test). h NRF2 (green) expression in MACSorted Cit-k KO AN2+ (red) dOPCs and vOPCs in vitro. DAPI (blue) counterstains cell nuclei. i NRF2 staining integrated density in MACSorted Cit-k KO dOPCs vs. vOPCs (n = 4/group; P = 0.0087, t(3) = 6.129, Two-tailed Paired t-test). j Heatmap of the qRT-PCR analysis of the mRNAs of Nrf2, Keap1, and NRF2-target genes in dOPCs and vOPCs MACSorted from P10 WT and Cit-k KO mice (Two-way Anova followed by Bonferroni’s Multiple Comparison Test; n, P, and F values in Supplementary Table 1). Dot plots are included in Supplementary Fig 7. k Log(inhibitor) vs. response curve (Non-linear regression inhibition curve) representing percentages of viable OPCs after an acute H2O2 treatment (0, 100, 500, 5000 µM). LC50 KO dOPCs = 38.96 µM, R2 = 0.885; LC50 KO vOPCs = 1481 µM, R2 = 0.859; LC50 WT dOPCs = 1015 µM, R2 = 0.895; LC50 WT vOPCs = 2046 µM, R2 = 0.907). l Cit-k KO dOPC density at t0 (i.e., 30 min after plating) and at t = 2 DIV in Ctrl conditions vs. in presence of NAC or DMF (n = 5/group; P < 0.0001, F(3) = 53.86, One-way Anova Repeated Measures). In l data are mean ± SE. In b, d, e, g, i lines connect paired samples (i.e., dOPC and vOPC samples from the same mouse). Scale bars: 5 µm in a, c, h; 10 µm in l. DHE dihydroethidium, DIV days in vitro, DMF dimethyl fumarate, dOPC dorsal oligodendrocyte progenitor cell, H2O2 hydrogen peroxide, LC50 inhibitory concentration 50—concentration that produces 50% decrease in viable cells, NAC N-acetyl-L-cysteine, NBT Nitroblue Tetrazolium, vOPC ventral oligodendrocyte progenitor cell, WT wild-type; P postnatal day, γH2AX phosphorylated histone H2AX. *P < 0.05; **P < 0.01; ***P < 0.001. Source data are provided as a Source Data file.
Fig. 7
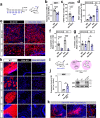
Fig. 7. NAC treatment partially rescues the oligodendroglia phenotype in Cit-k KO mouse forebrain.
a NAC treatment. b NBT reduction assay in dOPCs acutely isolated from P10 Cit-k KO (n = 5) vs. NAC-treated Cit-k KO (n = 6) mice (normalized to Cit-k KO dOPC mean value. Two-tailed Unpaired t-test, P = 0.0007, t(9) = 5.006). c Number of γH2AX+ foci in dOPCs acutely isolated from P10 Cit-k KO vs. NAC-treated Cit-k KO mice (n = 4/group; two-tailed Mann–Whitney U-test, P = 0.0571). d NG2+ cell density in the dorsal cortex and CC of Cit-k KO mice vs. NAC-treated Cit-k KO mice (n = 4 each, two-tailed Mann–Whitney U-test, P = 0.0286 for both dorsal cortex and CC). e NG2+ (red) cells in the dorsal cortex and CC of P10 Cit-k KO mice vs. Cit-k KO mice after NAC treatment. f cCASP3+/NG2+ cells in the dorsal cortex and CC of Cit-k KO mice (n = 4) vs. NAC-treated Cit-k KO mice (n = 3, Chi-square test, dorsal cortex χ2(1) = 19.05, CC χ2(1) = 27.26, P < 0.0001 for both). g Percentage of mitotic (i.e., PH3+) NG2+ cells in the dorsal cortex and CC of Cit-k KO mice (n = 4) vs. NAC-treated Cit-k KO mice (n = 3, Chi square test, dorsal cortex: n.s., χ2(1) = 0.00253; CC: P = 0.0323, χ2(1): 4.581). h Anti-MBP (red) immunolabeling in P10 WT, Cit-k KO and NAC-treated Cit-k KO mouse major white matter tracts. i Experimental approach to obtain forebrain and cerebellar organotypic cultures from NAC-treated P10 Cit-k KO mice. j Western blotting analysis of MBP protein expression in P10 WT (n = 1), Cit-k KO mouse forebrain tissue (n = 3) and Cit-k KO organotypic cultures (n = 3; one-tailed Mann–Whitney U-test; P = 0.05). k Anti-MBP (red) immunolabeling in Cit-k KO cerebellar and forebrain organotypic cultures. DAPI (blue) in e, h, k counterstains cell nuclei. Scale bars: 50 µm. Data are mean ± SE. ac anterior commissure, CC corpus callosum, cCASP3 cleaved-caspase 3, crb cerebellar white matter, DIV days in vitro, Dors. Ctx. dorsal cortex, NAC N-acetyl cisteine, P postnatal day, sacrif. sacrifice, Str striatum, WT wild-type. *P < 0.05; ***P < 0.001. Source data are provided as a Source Data file.
Fig. 8
Fig. 8. WT dorsal OPCs are more vulnerable to DNA damage compared to vOPCs.
a Cisplatin treatment on cultured dOPCs and vOPCs isolated from P8 WT mice. b dOPC vs. vOPC density 48 h after cisplatin treatment (0, 20, 100, 200, 1000 nM; Two-way Anova followed by Bonferroni’s Multiple Comparison Test, Cispl concentration: P < 0.0001, F(3,51) = 124.2; OPC origin: P < 0.0001, F(1,51) = 33.53; Interaction: P = 0.0006, F(3,51) = 6.833. 4 experiments, dOPC Ctrl = 10 coverslips, vOPC Ctrl = 10, dOPC cispl 20 nM = 6, vOPC cispl 20 nM = 6, dOPC cispl 100 nM = 9, vOPC cispl 100 nM = 10, dOPC cispl 200 nM = 4, vOPC cispl 200 nM = 4, dOPC cispl 1 µM = 4, vOPC cispl 1 µM = 4). c Log(inhibitor) vs. response curve (Non-linear regression inhibition curve) representing percentages of viable OPCs 48 h after cisplatin treatment (0, 20, 100, 200, 1000 nM; dOPCs LC50 = 48 nM, R2 = 0.940; dOPCs LC50 = 173.7 nM, R2 = 0.827). d Cisplatin treatment on cultured OPCs isolated from P10 Emx1Cre;R26RYFP mouse forebrain. e, f YFP+ (green) and YFP-negative NG2+ (red) OPCs in Ctrl (e) and Cispl (f) condition. DAPI counterstains cell nuclei. Scale bars: 20 µm. g Mean YFP+ and YFP-negative OPC number/40× field 48 h after 100 nM cisplatin (Two-way Anova followed by Bonferroni’s Multiple Comparison Test, Treatment: P < 0.0001, F(1,6) = 97.68; Genotype: P = 0.0049, F(1,6) = 18.76; Interaction: P = 0.0017, F(1,6) = 29.10. 4 experiments (4 mice) 2 coverslips/mouse per condition). Inset: Mean percentage of YFP+ vs. YFP-negative OPC density decrease (Two-tailed paired t-test, P = 0.0037, t(3) = 8.275). h, i Western blotting analysis of γH2AX, p21, p16, p27, and NRF2 protein expression (relative to total protein lane) in dOPCs vs. vOPCs 24 h after treatment with 100 nM Cispl (n = 4/group; Two-tailed Paired t-test: γH2AX: n.s., t(3) = 2.481; p21: P = 0.017, t(3) = 4.868; p16: P = 0.057, t(3) = 2.975; p27: P = 0.021, t(3) = 4.449; NRF2: P = 0.025, t(3) = 4.175). j Nitroblue Tetrazolium (NBT) reduction assay in dOPCs vs. vOPCs 24 h after Cispl 100 nM., normalized to dOPC mean value (Two-tailed paired t-test, P = 0.036, t(4) = 3.097; n = 5/group). k Cispl + NAC co-treatment experiments on cultured dOPCs isolated from P8 WT mice. l NAC supplementation rescues dOPC density upon cisplatin treatment (One-way Anova followed by Bonferroni’s Multiple Comparison Test, P < 0.0001, F(3,27) = 31.90, 5 experiments, dOPC Ctrl = 9 coverslips, dOPC cispl 100 nM = 10, dOPC cispl 100 nM + NAC 60 µg/ml = 6, dOPC cispl 100 nM + NAC 200 µg/ml = 6). In b, g inset, l data are mean ± SEM. In g, i, j lines connect paired samples (i.e., samples from the same mouse). Cispl cisplatin, DIV days in vitro, dorsal oligodendrocyte progenitor cell, N-acetyl cisteine, P postnatal day, vOPC ventral oligodendrocyte progenitor cell, YFP yellow fluorescent protein. *P < 0.05; **P < 0.01; ***P < 0.001. Source data are provided as a Source Data file.

References

    1. Cerrato V, et al. Multiple origins and modularity in the spatiotemporal emergence of cerebellar astrocyte heterogeneity. PLoS Biol. 2018;16:e2005513. doi: 10.1371/journal.pbio.2005513. - DOI - PMC - PubMed
    1. Batiuk MY, et al. Identification of region-specific astrocyte subtypes at single cell resolution. Nat. Commun. 2020;11:1220. doi: 10.1038/s41467-019-14198-8. - DOI - PMC - PubMed
    1. Bayraktar OA, Fuentealba LC, Alvarez-Buylla A, Rowitch DH. Astrocyte development and heterogeneity. Cold Spring Harb. Perspect. Biol. 2014;7:020362. - PMC - PubMed
    1. Chai H, et al. Neural circuit-specialized astrocytes: transcriptomic, proteomic, morphological, and functional evidence. Neuron. 2017;95:531–549.e9. doi: 10.1016/j.neuron.2017.06.029. - DOI - PMC - PubMed
    1. Marques S, et al. Oligodendrocyte heterogeneity in the mouse juvenile and adult central nervous system. Science. 2016;352:1326–1329. doi: 10.1126/science.aaf6463. - DOI - PMC - PubMed

Publication types