. 2022 Apr 28;13(1):2321.
doi: 10.1038/s41467-022-29946-6.

Deficiency in coatomer complex I causes aberrant activation of STING signalling

Affiliations

Deficiency in coatomer complex I causes aberrant activation of STING signalling

Annemarie Steiner et al. Nat Commun. .

Abstract

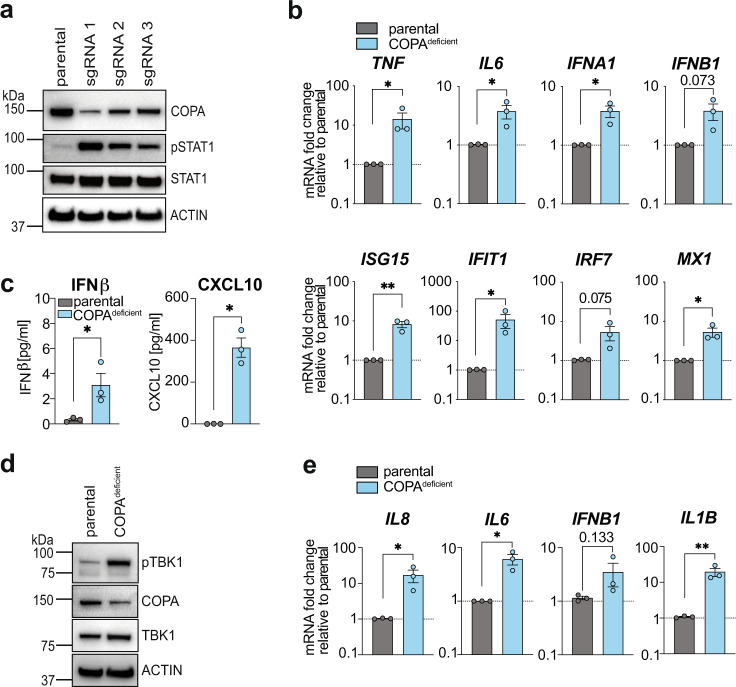
Coatomer complex I (COPI) mediates retrograde vesicular trafficking from Golgi to the endoplasmic reticulum (ER) and within Golgi compartments. Deficiency in subunit alpha causes COPA syndrome and is associated with type I IFN signalling, although the upstream innate immune sensor involved was unknown. Using in vitro models we find aberrant activation of the STING pathway due to deficient retrograde but probably not intra-Golgi transport. Further we find the upstream cytosolic DNA sensor cGAS as essentially required to drive type I IFN signalling. Genetic deletion of COPI subunits COPG1 or COPD similarly induces type I IFN activation in vitro, which suggests that inflammatory diseases associated with mutations in other COPI subunit genes may exist. Finally, we demonstrate that inflammation in COPA syndrome patient peripheral blood mononuclear cells and COPI-deficient cell lines is ameliorated by treatment with the small molecule STING inhibitor H-151, suggesting targeted inhibition of the cGAS/STING pathway as a promising therapeutic approach.


Conflict of interest statement

M.Ga. declares consultancy and speakers fee from Novartis and SOBI. S.L.M. receives funding from IFM therapeutics and M.Ge. consults to IFM Therapeutics. The other authors declare no competing interests.

Figures

Fig. 1
Fig. 1. Cell line models for COPA syndrome.
a CRISPR/Cas9 gene editing technology was employed to generate COPAdeficient THP-1 cell lines. Three different single guide (sg) RNAs targeting exon 5 (sgRNA 1), exon 1 (sgRNA 2) or exon 7 (sgRNA 3) of the COPA gene were used. Baseline protein levels of COPA and phosphorylated STAT1 (pSTAT1) were assessed by immunoblotting, using ACTIN as a loading control. Representative result of n = 3 independent experiments. b qRT-PCR analysis of transcription levels of proinflammatory cytokines, type I IFN and ISGs at baseline was performed for a representative COPAdeficient THP-1 cell line (sgRNA 1). Data are mean ± SEM from 3 independent experiments and presented as fold change to the parental control cell line (THP-1 Cas9). Statistical significance was assessed by two-tailed ratio-paired Student’s t-test. c Analysis of baseline levels of IFNβ and CXCL10 in cell culture supernatants by ELISA. Data are mean ± SEM pooled from 3 independent experiments, statistical analysis using two-tailed ratio-paired Student’s t-test. d Immunoblotting of phosphorylated TBK1 (pTBK1) in COPAdeficient HeLa cells generated by CRISPR/Cas9 targeting of COPA with sgRNA 1. Representative result of n = 3 independent experiments. e Assessment of the baseline gene transcription profile of COPAdeficient HeLa cells by qRT-PCR analysis. Data are presented as described in b. Statistical analysis using two-tailed ratio-paired Student’s t-test. P values are indicated by numbers or as *P < 0.05, **P < 0.01. Source data are provided as a Source Data file for Fig. 1a, d.
Fig. 2
Fig. 2. Inflammation induced by COPA-deficiency is STING dependent.
a Volcano plot representing the log2 protein ratios of potential STING-interacting proteins identified by mass spectrometry-based quantitative proteomics after transient overexpression of mCit-STING and pulldown in HEK293T cells relative to empty vector (EV) control (n = 3 independent IPs). COPA may participate in a protein complex with STING. Differential expression analysis was performed using limma with an adjusted p-value cutoff at 0.05 and log2 fold change cutoff at 1. b Representative western blot of COPAdeficient THP-1 cells or co-deleted for COPA and STING (COPAdeficient/STING−/−) after 72 hrs Dox treatment. Representative result of n = 3 independent experiments. c qRT-PCR analysis of transcription levels in THP-1 cells at baseline (72 hrs Dox). Data are mean ± SEM from 3 independent experiments. Statistical significance was calculated by one-way ANOVA and Dunnett’s multiple comparison test. d Representative western blot of COPAdeficient THP-1 cells after treatment with STING inhibitor H-151 (2.5 µM) or vehicle control (Veh ctrl). Representative result of n = 3. e Analysis of proinflammatory gene and ISG transcription levels in COPAdeficient THP-1 cells following treatment with H-151 (2.5 µM). Data are shown as mean ± SEM from 3 independent experiments. Statistical analysis by two-tailed ratio paired Student’s t-test comparing control and H-151 treatment individually for each cell line. f Super-resolution immunofluorescences microscopy of parental and COPAdeficient HeLa cells stained for COPA (cyan) and endogenous STING (magenta). Parental cells transfected with HT-DNA (2 µg/ml, 2 hrs) show typical puncta formation which represent STING accumulation at Golgi compartments as indication of STING activation. Representative experiment shown of n = 3, scale bar represents 20 µm. P values are indicated by numbers or as *P < 0.05, **P < 0.01, ***P < 0.001. Source data are provided as a Source Data file for Fig. 2b, d.
Fig. 3
Fig. 3. Mutations in COPA trigger STING-dependent inflammation.
a Representative histograms of flow cytometry analysis for phosphorylated TBK1 (pTBK1, used fluorochrome PE) in monocytes (CD14 + /CD3-) isolated from PBMCs of one COPA syndrome patient (blue) and two healthy control individuals (HCs) (black, red) before and after treatment with STING inhibitor H-151 (5 µM) for 4 hrs (green line). Dotted line represents isotype control. n = 1. b Quantification of data shown in (a). Bar graph represents fold change in pTBK1 geometric mean fluorescence intensity (MFI) following H-151 treatment relative to untreated control. Data presented as mean of two independent HCs from n = 1 experiments. c Western blot analysis of HEK293T cells following co-overexpression of mCit-STING and COPA mutants E241K and R233H (0.5 µg DNA per construct) 24 hrs after transfection. Representative result of n = 3. d Immunoblot analysis of stably STING-GFP-expressing HEK293T cells 24 hrs after transient transfection with 0.5 µg plasmid DNA encoding COPA WT or mutants. Untransfected cells stimulated with c-di-AM(PS)2 (20 µM, 2 hrs) are shown as control (last lane). Representative result of n = 3 experiments. e HEK293 cells (express endogenous STING) were transiently transfected with COPA WT or mutants (0.5 µg or 1 µg DNA/well) and harvested for western blot analysis after 24 hrs. As a positive control, cell lysate of THP-1 cells stimulated with HT-DNA (2 µg/ml, 2 hrs) was used. Representative experiment of 3 independent repeats. Source data are provided as a Source Data file for Fig. 3c, d, e.
Fig. 4
Fig. 4. Inflammatory signalling in COPAdeficient THP-1 cells requires cGAS.
a Immunoblot analysis of parental THP-1 cells and monoclonal cGAS−/− THP-1 cells following genetic deletion of COPA and reconstitution with cGAS-GFP via lentiviral transduction. Cells were treated with Dox for 72 hrs. A representative experiment is shown (n = 2). end.; endogenous. b qRT-PCR analysis of baseline ISGs and proinflammatory gene transcription profile in THP-1 cells with indicated genotypes. Data are mean ± SEM from 3 independent experiments. Statistical significance was assessed by one-way ANOVA with Dunnett’s multiple comparison test. c Baseline analysis of 2’3’-cGAMP levels in cell lysates of parental and COPAdeficient THP-1 cells by ELISA. Data are shown as mean ± SEM from 3 independent experiments. Statistical testing by two-tailed unpaired Student’s t-test. d COPAdeficient THP-1 cells were stimulated with cGAS activators HT-DNA (2 µg/ml) and poly (dA:dT) (1 µg/ml) for 24 hrs and 2’3’-cGAMP levels in cell lysates measured by ELISA. Data are presented as mean from n = 2 independent experiments showing individual data points. e 3 different COPA syndrome model THP-1 cell lines (generated and described in Fig. 1a) were stimulated with HT-DNA (2 µg/ml), poly (dA:dT) (1 µg/ml) as well as STING activator c-di-AM(PS)2 (20 µM) for 24 hrs. Supernatants were analysed for released IFNλ by ELISA. Data are mean ± SEM from 3 independent experiments. Statistical significance was assessed by one-way ANOVA using parental cells as comparator group individually for each stimulus. P values are indicated by numbers or as * P < 0.05, ** P < 0.01, *** P < 0.001. Lipofectamine 2000, LF2000. Source data are provided as a Source Data file for Fig. 4a.
Fig. 5
Fig. 5. cGAS/STING pathway activation is caused by general deficiency in COPI-mediated retrograde trafficking.
a Schematic illustration of coatomer complexes COPII (green) and COPI (blue) mediating intracellular trafficking between endoplasmic reticulum (ER) and Golgi compartments. The COPII complex mediates anterograde transport from ER to Golgi, whereas COPI mediates retrograde transport from Golgi to ER as well as within cis-Golgi compartments. COPI vesicle formation occurs at the Golgi membrane through interaction of 7 subunits: α (COPA), β (COPB1), β’ (COPB2), δ (COPD), ε (COPE), γ (COPG), ζ (COPZ). After vesicle budding, the coatomer coats are shed off and released into the cytoplasm to allow vesicle fusion at the target membrane. b Representative IF images of parental, COPAdeficient, COPG1deficient and COPDdeficient HeLa cells co-stained for KDEL (green), GM130 (magenta), indicated COPI subunit (cyan) and DAPI (blue). Images are presented as maximum intensity projection. Scale bar 10 µm. c Quantification of IF co-localization of KDEL and GM130 signal in COPI subunit-deficient HeLa cells shown in (b). Results are quantified as percentage area of KDEL localization (ER-specific retention signal) inside cis-Golgi (GM130). Each dot represents one single cell. Parental cells stained for different subunits were combined for quantification analysis. Statistical significance was assessed by one-way ANOVA with Dunnett’s multiple comparison test using n = 35 (parental), n = 8 (COPAdeficient), n = 15 (COPG1deficient) and n = 18 (COPDdeficient) biologically independent cells examined in 2 independent experiments. Line at median. d Immunoblot analysis of THP-1 cells after CRISPR/Cas9-mediated genetic deletion of COPI-subunit proteins COPA, COPG1, COPD and COPE following treatment with STING inhibitor H-151 (2.5 µM). Results are shown as a representative of n = 3 independent repeats e qRT-PCR analysis of proinflammatory genes and ISGs in COPI-subunit deficient THP-1 cells following H-151 treatment (2.5 µM). Data are shown as mean ± SEM from n = 3 independent experiments and statistical significance was assessed by two-tailed ratio paired Student’s t-test comparing Veh ctrl and H-151 treatment individually for each cell line. P values are indicated by numbers or as * P < 0.05, ** P < 0.01, *** P < 0.001, **** P < 0.0001. Source data are provided as a Source Data file for Fig. 5c, d.
Fig. 6
Fig. 6. Targeted inhibition of anterograde intra-Golgi transport does not activate spontaneous STING signalling.
a Representative immunoblot analysis of baseline signalling in THP-1 cells after targeted CRISPR/Cas9-mediated deletion of COPG1 or COPG2 paralogues. n = 2. b COPG2 transcription levels of THP-1 cells used in (a) analysed by qRT-PCR. Data are presented as mean from n = 2 independent experiments showing individual data points. c qRT-PCR analysis of baseline inflammatory cytokine transcripts in COPG1- and COPG2-depleted THP-1 cells. Data are presented as mean from n = 2 independent experiments showing individual data points. d Representative western blot analysis of iBMDM cells after treatment with cPLA2α inhibitor AACOCF3. Spontaneous activation of STING signalling was evaluated by immunoblotting for pTBK1, using ACTIN as a loading control. Inhibitor activity was analysed by its effect on iNOS expression levels following IFNγ priming (50 ng/ml, overnight) and LPS stimulation (25 ng/ml, 6 hrs) in absence or presence of AACOCF3 (10 and 20 µM, 30 min preincubation). A representative experiment of n = 3 is shown. Source data are provided as a Source Data file for Fig. 6a, d.

References

    1. Watkin LB, et al. COPA mutations impair ER-Golgi transport and cause hereditary autoimmune-mediated lung disease and arthritis. Nat. Genet. 2015;47:654–660. doi: 10.1038/ng.3279. - DOI - PMC - PubMed
    1. Beck R, Rawet M, Wieland FT, Cassel D. The COPI system: molecular mechanisms and function. FEBS Lett. 2009;583:2701–2709. doi: 10.1016/j.febslet.2009.07.032. - DOI - PubMed
    1. Guan Y, et al. Effective sirolimus treatment of 2 COPA syndrome patients. J. Allergy Clin. Immunology: Pract. 2021;9:999–1001.e1001. doi: 10.1016/j.jaip.2020.10.019. - DOI - PubMed
    1. Frémond M-L, Nathan N. COPA syndrome, 5 years after: Where are we? Jt. Bone Spine. 2021;88:105070. doi: 10.1016/j.jbspin.2020.09.002. - DOI - PubMed
    1. Todd DJ, Lee AH, Glimcher LH. The endoplasmic reticulum stress response in immunity and autoimmunity. Nat. Rev. Immunol. 2008;8:663–674. doi: 10.1038/nri2359. - DOI - PubMed

Publication types

MeSH terms

Substances