

Large size in aquatic tetrapods compensates for high drag caused by extreme body proportions
- PMID: 35484197
- PMCID: PMC9051157
- DOI: 10.1038/s42003-022-03322-y
Large size in aquatic tetrapods compensates for high drag caused by extreme body proportions
Erratum in
-
Author Correction: Large size in aquatic tetrapods compensates for high drag caused by extreme body proportions.Commun Biol. 2022 May 19;5(1):499. doi: 10.1038/s42003-022-03458-x. Commun Biol. 2022. PMID: 35589968 Free PMC article. No abstract available.
Abstract
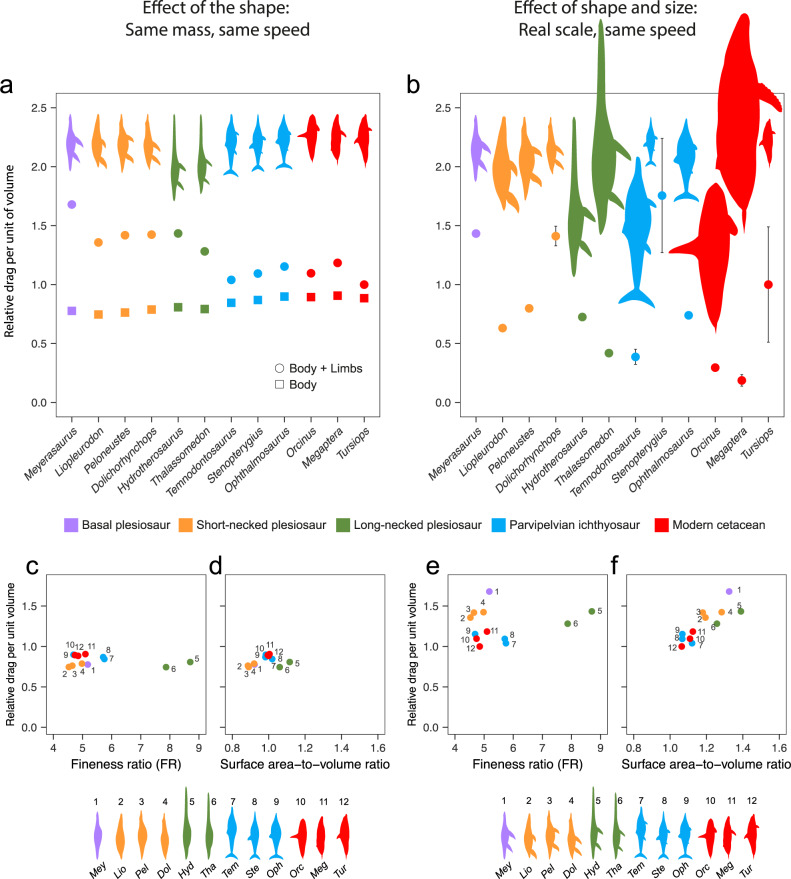
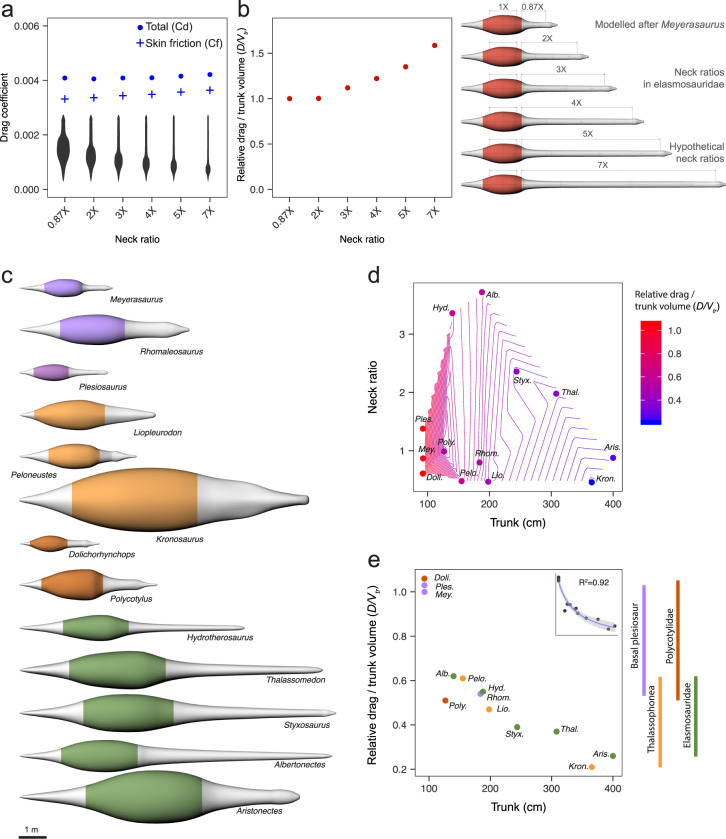
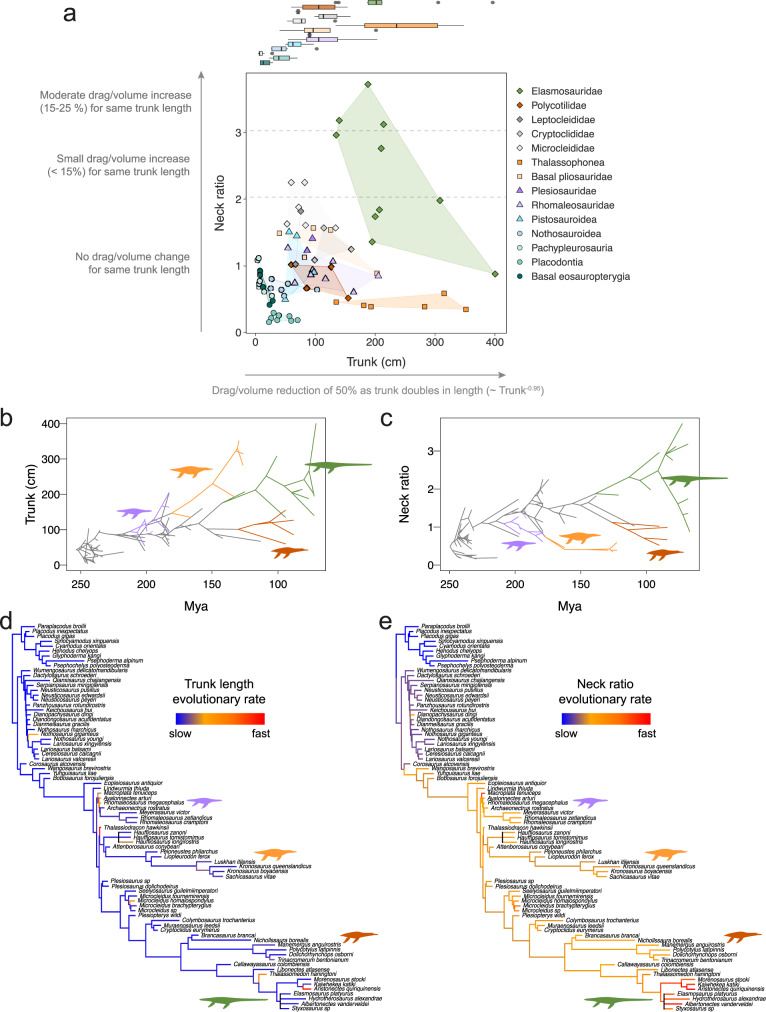
Various Mesozoic marine reptile lineages evolved streamlined bodies and efficient lift-based swimming, as seen in modern aquatic mammals. Ichthyosaurs had low-drag bodies, akin to modern dolphins, but plesiosaurs were strikingly different, with long hydrofoil-like limbs and greatly variable neck and trunk proportions. Using computational fluid dynamics, we explore the effect of this extreme morphological variation. We find that, independently of their body fineness ratio, plesiosaurs produced more drag than ichthyosaurs and modern cetaceans of equal mass due to their large limbs, but these differences were not significant when body size was accounted for. Additionally, necks longer than twice the trunk length can substantially increase the cost of forward swimming, but this effect was cancelled out by the evolution of big trunks. Moreover, fast rates in the evolution of neck proportions in the long-necked elasmosaurs suggest that large trunks might have released the hydrodynamic constraints on necks thus allowing their extreme enlargement.
© 2022. The Author(s).
Conflict of interest statement
The authors declare no competing interests.
Figures


Similar articles
-
Effects of body plan evolution on the hydrodynamic drag and energy requirements of swimming in ichthyosaurs.Proc Biol Sci. 2019 Mar 13;286(1898):20182786. doi: 10.1098/rspb.2018.2786. Proc Biol Sci. 2019. PMID: 30836867 Free PMC article.
-
Evolution of the Sauropterygian Labyrinth with Increasingly Pelagic Lifestyles.Curr Biol. 2017 Dec 18;27(24):3852-3858.e3. doi: 10.1016/j.cub.2017.10.069. Epub 2017 Dec 7. Curr Biol. 2017. PMID: 29225027
-
A giant chelonioid turtle from the late Cretaceous of Morocco with a suction feeding apparatus unique among tetrapods.PLoS One. 2013 Jul 11;8(7):e63586. doi: 10.1371/journal.pone.0063586. Print 2013. PLoS One. 2013. PMID: 23874378 Free PMC article.
-
High diversity, low disparity and small body size in plesiosaurs (Reptilia, Sauropterygia) from the Triassic-Jurassic boundary.PLoS One. 2012;7(3):e31838. doi: 10.1371/journal.pone.0031838. Epub 2012 Mar 16. PLoS One. 2012. PMID: 22438869 Free PMC article. Review.
-
The locomotion of extinct secondarily aquatic tetrapods.Biol Rev Camb Philos Soc. 2022 Feb;97(1):67-98. doi: 10.1111/brv.12790. Epub 2021 Sep 6. Biol Rev Camb Philos Soc. 2022. PMID: 34486794 Review.
Cited by
-
First filter feeding in the Early Triassic: cranial morphological convergence between Hupehsuchus and baleen whales.BMC Ecol Evol. 2023 Aug 8;23(1):36. doi: 10.1186/s12862-023-02143-9. BMC Ecol Evol. 2023. PMID: 37550649 Free PMC article.
-
Estimating body volumes and surface areas of animals from cross-sections.PeerJ. 2024 May 28;12:e17479. doi: 10.7717/peerj.17479. eCollection 2024. PeerJ. 2024. PMID: 38827295 Free PMC article.
-
Rapid neck elongation in Sauropterygia (Reptilia: Diapsida) revealed by a new basal pachypleurosaur from the Lower Triassic of China.BMC Ecol Evol. 2023 Aug 31;23(1):44. doi: 10.1186/s12862-023-02150-w. BMC Ecol Evol. 2023. PMID: 37648992 Free PMC article.
-
Turtle body size evolution is determined by lineage-specific specializations rather than global trends.Ecol Evol. 2023 Jun 26;13(6):e10201. doi: 10.1002/ece3.10201. eCollection 2023 Jun. Ecol Evol. 2023. PMID: 37384241 Free PMC article.
References
-
- Kelley NP, Pyenson ND. Evolutionary innovation and ecology in marine tetrapods from the Triassic to the Anthropocene. Science. 2015;348:aaa3716. - PubMed
-
- Vermeij GJ, Motani R. Land to sea transitions in vertebrates: the dynamics of colonization. Paleobiology. 2018;44:237–250.
-
- Pyenson ND, Kelley NP, Parham JF. Marine tetrapod macroevolution: physical and biological drivers on 250 Ma of invasions and evolution in ocean ecosystems. Palaeogeogr. Palaeoclimatol. Palaeoecol. 2014;400:1–8.
-
- Motani R, Vermeij GJ. Ecophysiological steps of marine adaptation in extant and extinct non‐avian tetrapods. Biol. Rev. 2021;96:1769–1798. - PubMed
-
- Motani R. The evolution of marine reptiles. Evolution: Educ. Outreach. 2009;2:224–235.
Publication types
MeSH terms
LinkOut - more resources
Full Text Sources
