. 2022 Jun;6(6):709-719.
doi: 10.1038/s41559-022-01737-8. Epub 2022 Apr 28.

Forest degradation drives widespread avian habitat and population declines

Affiliations

Forest degradation drives widespread avian habitat and population declines

Matthew G Betts et al. Nat Ecol Evol. 2022 Jun.

Abstract

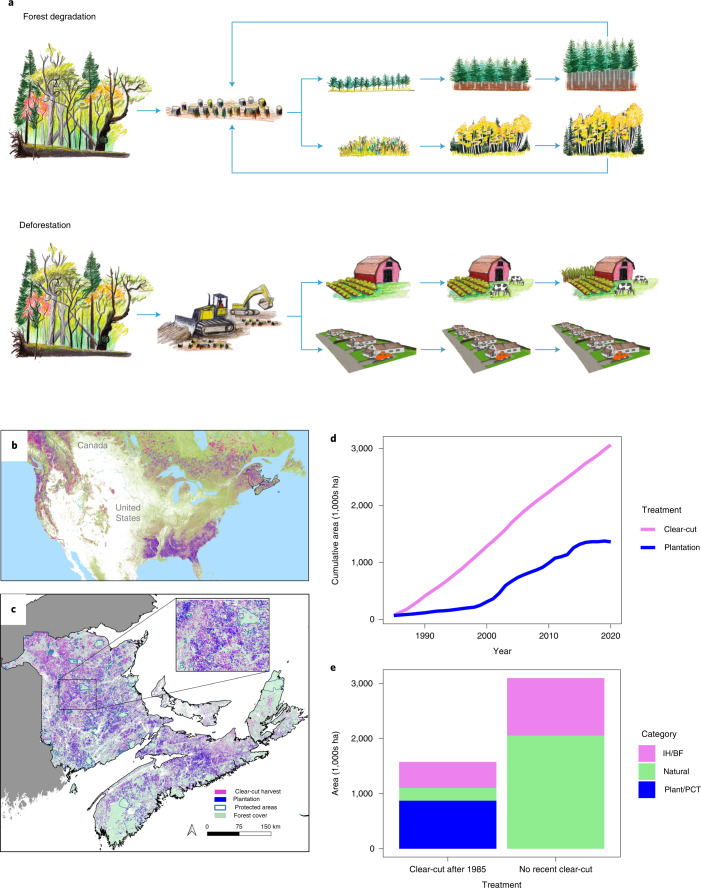
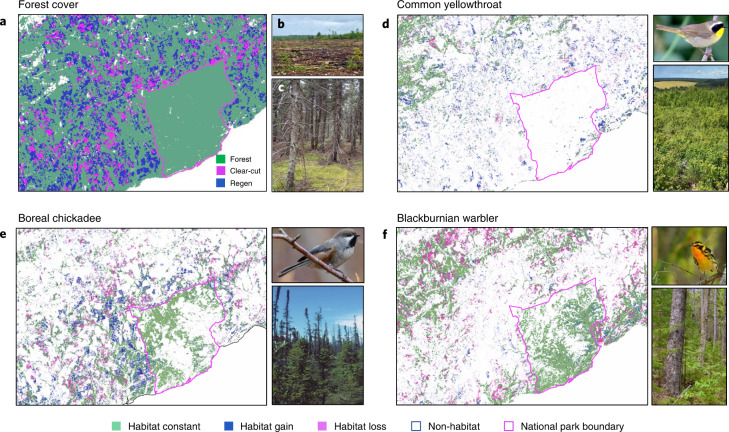
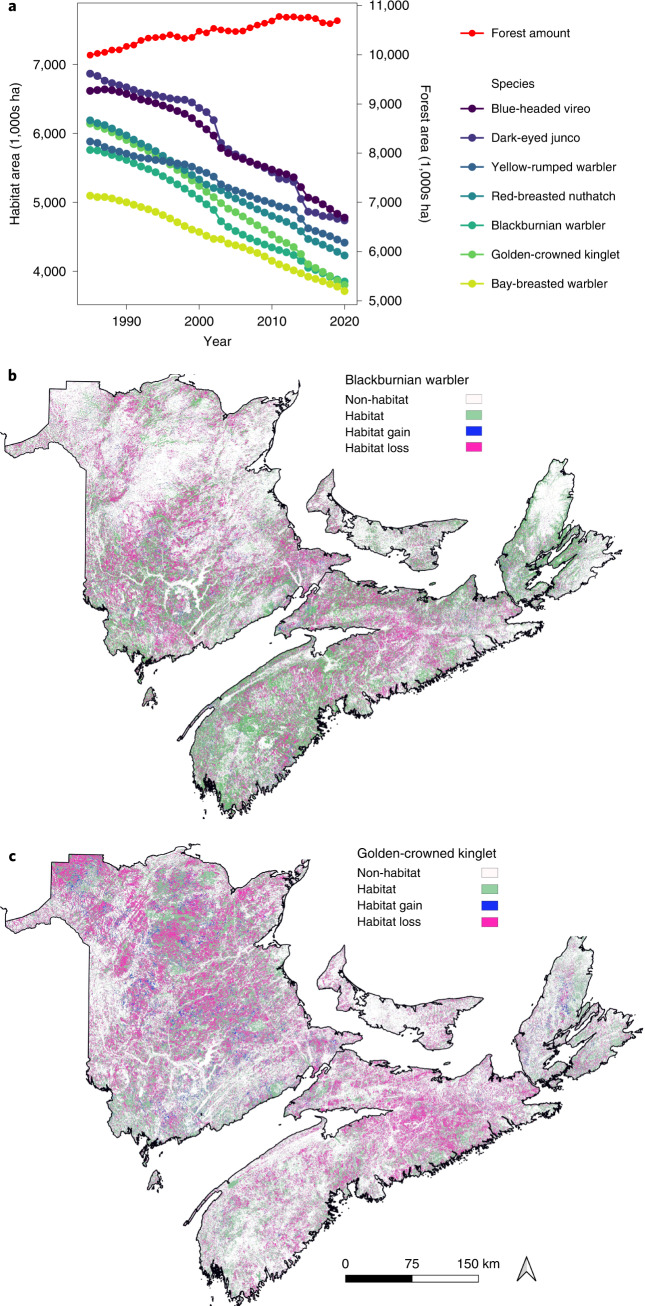
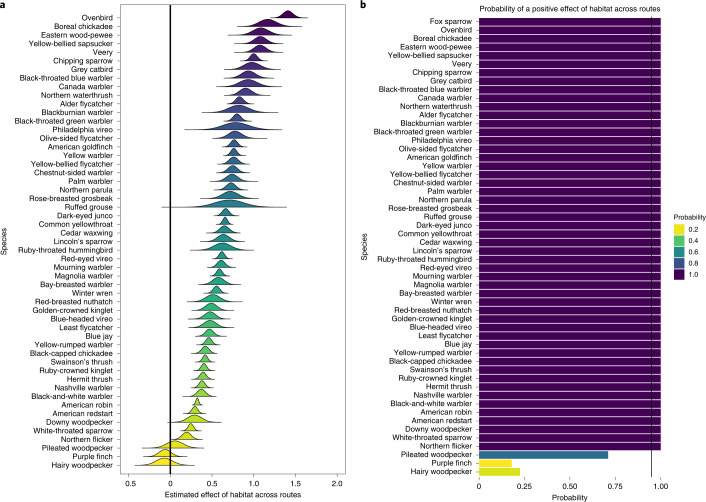
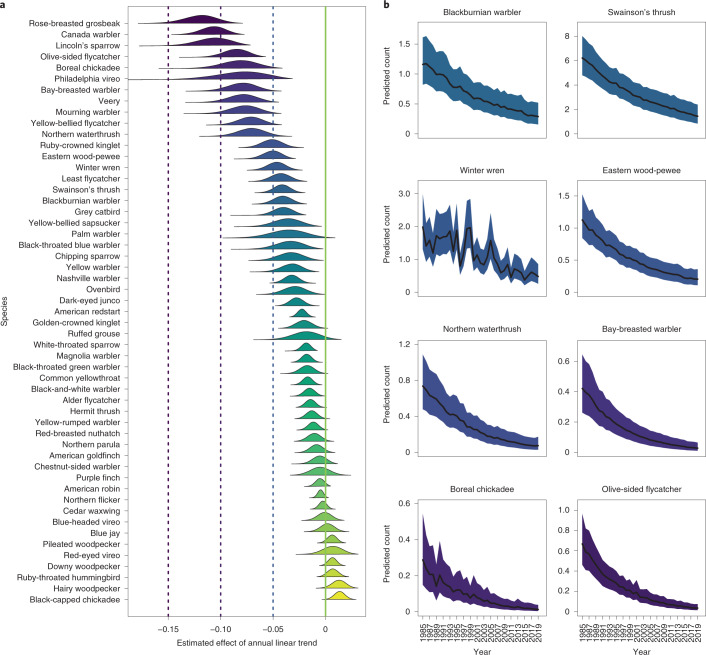
In many regions of the world, forest management has reduced old forest and simplified forest structure and composition. We hypothesized that such forest degradation has resulted in long-term habitat loss for forest-associated bird species of eastern Canada (130,017 km2) which, in turn, has caused bird-population declines. Despite little change in overall forest cover, we found substantial reductions in old forest as a result of frequent clear-cutting and a broad-scale transformation to intensified forestry. Back-cast species distribution models revealed that breeding habitat loss occurred for 66% of the 54 most common species from 1985 to 2020 and was strongly associated with reduction in old age classes. Using a long-term, independent dataset, we found that habitat amount predicted population size for 94% of species, and habitat loss was associated with population declines for old-forest species. Forest degradation may therefore be a primary cause of biodiversity decline in managed forest landscapes.


Conflict of interest statement

The authors declare no competing interests.

Figures

Fig. 1
Fig. 1. Forest management as a potential cause of forest degradation.
a, Conceptual diagram showing the contrast between forest degradation and deforestation; in eastern Canada, degradation generally results from clear-cutting of original forest followed by either tree plantations or natural regeneration of pioneer tree species. Age–class truncation takes place when regenerated forests are clear-cut before developing the composition and structure of the original forest (reverse arrows). Alternatively, deforestation occurs when forest is replaced by another land-cover type (for example, urban or agricultural areas). Drawing credit: Deirdre Hyde. b, The study area in context of other regions of North America that have similar rapid rates of forest loss (pink) then gain (purple), which is probably a signal of commercial forest harvest followed by rapid regeneration (data from: www.globalforestwatch.org). c, Cumulative clear-cut disturbance across the Maritime provinces of eastern Canada from 1985 to 2020 (pink) along with the area that has been converted to plantations (blue). d, Cumulative area clear-cut and planted across the study area over the same time period. Methods for mapping plantations and disturbance are given in the Supplementary Methods. e, The area of forest that has been clear-cut since 1985 (left bar) for public land and private wood lots for a subset of the study area (New Brunswick; 72,908 km2) and forests that have not been clear-cut since that date (right bar). Most forest cut since 1985 has been planted or pre-commercially thinned (PCT) to favour conifer species (blue bar) or has regenerated as shade-intolerant hardwood (IH) or balsam fir (Abies balsamea, BF; pink bar). In contrast, forest that has not been recently clear-cut is comprised of shade-tolerant tree species (green bar). Intolerant hardwood/balsam fir stands in areas not recently harvested probably originated from disturbances before 1985. Data in e were derived from the New Brunswick Forest Inventory (2010) and do not include changes over the past decade.
Fig. 2
Fig. 2. The importance of a species-centred approach to detecting effects of forest degradation.
af, Maps showing forest cover (green in a), recent clear-cuts (pink in a; b) and >two-year-old clear-cuts planted, thinned or regenerating (Regen) naturally (blue in a; c) in relation to SDM-predicted habitat and habitat changes (1985–2020) for: common yellowthroat (d), which is associated with young deciduous forest (net regional habitat gain = +8.3%), boreal chickadee (e), associated with old conifer forest (net regional habitat loss = −19.0%) and Blackburnian warbler (f), associated with old mixed coniferous/deciduous forest (net regional habitat loss = −33%); see adjacent photos of species-associated forest types. Due to habitat specialization (adaptation to particular forest types and age classes), each species is distributed uniquely across forest landscapes and therefore is differentially affected by clear-cuts and regeneration (a). Using coarse definitions of forest change (for example, forest loss or cover) will not effectively quantify species-specific habitat changes over time. SDMs based on Landsat variables enable quantification of annual habitat amounts and the direct effects of spatially congruent forest degradation (for example, changes in structure and composition initiated by clear-cut disturbance) on habitat for each species. Thresholds for quantification of habitat versus non-habitat are provided in Supplementary Table 1. The legend for habitat maps is provided below the figure. Photo credits: boreal chickadee, Iris Kilpatrick; all other photos, M.G.B.
Fig. 3
Fig. 3. Forest degradation rather than loss drives habitat declines in old forest-associated bird species.
a, Habitat trends (1985–2020) for the seven bird species exhibiting the greatest population declines according to SDMs; all of these species are old forest associated. During the same time interval, total forest cover did not decline (red line, right axis), indicating that habitat loss is a function of forest degradation rather than loss. b,c, Predicted habitat loss (pink) and gain (blue) between 1985 and 2020 for two example species: Blackburnian warbler (33% habitat loss; b) and golden-crowned kinglet (38% habitat loss; c). Habitat loss was quantified using SDMs with Landsat data as independent variables strongly predicted population trends for forest bird species.
Fig. 4
Fig. 4. Evidence for the effect of forest degradation on mature-forest bird species.
a, The relationship between habitat change, estimated from SDMs and independently derived population change estimates from the BBS for the Acadian forest. Bird species of mature (old) forests (M; dark green dots) exhibit the greatest habitat loss; this is generally reflected in strongly negative population trends. Bird species associated with regenerating forest (R; red dots) tend to have stable or increasing habitat but still show BBS population declines. b, The relationship between quantitatively derived estimates of mature-forest association and habitat change from 1985 to 2020. Mature forest-associated species tend to be losing the most habitat in relation to immature- (I; light-green dots) and regeneration-associated species. Successional stage categorizations (R, I, M) are from Birds of the World (BOW). The regression line was fit using a hierarchical Bayesian model (Supplementary Methods) and grey shading in b shows 95% credible intervals. Only a subset of species is shown in b (those with quantitative data for mature-forest associations; Supplementary Methods). c, The relationship between area clear-cut occurring from 1985 to 2020 in each species’ habitat within a 200 m-diameter buffer surrounding BBS routes (N = 90) and habitat loss (1985–2020) at the same scale for six mature forest-associated species. Black lines are regression lines and grey bands are 95% confidence intervals (regression estimates in Supplementary Table 3). As expected, clear-cutting is strongly associated with habitat loss, which indicates that ingrowth of new habitat is rarely compensated for by habitat loss (a signature of forest degradation via old age–class truncation).
Fig. 5
Fig. 5. Positive effects of habitat amount on bird-population abundance.
a, Posterior distributions for the effects of SDM-derived habitat amount across routes (x axis) on bird abundance, using BBS data. The vertical black line at zero reflects no positive or negative population trend. Abundance of most species was positively influenced by habitat, which supports the hypothesis that bird populations are strongly linked to breeding habitat amount. b, The posterior probability that habitat had an effect on population size for 54 forest bird species. The vertical black line indicates 95% posterior probability of an effect.
Fig. 6
Fig. 6. Population trends for forest-associated birds in eastern Canada.
a, Population trend parameter estimates and posterior distributions for 54 species of forest birds derived from Bayesian models. Seventy-two percent of species that are sufficiently common to model experienced population declines from 1985 to 2019. Colour key is provided in Fig. 5. The vertical green line indicates a population trend of zero. Dashed vertical lines coincide with trends of −15% (−0.15), −10% (−0.10) and −5% (−0.05) annual population trends. b, Predicted linear population trends for 1985–2019 (regression lines are mean trends derived from Bayesian Poisson models, Supplementary Methods) including annual variation estimated from BBS data. Shaded purple areas reflect 95% credible intervals and reflect the magnitude of species population declines shown in a. Populations of these eight old forest-associated species have declined 60–90% over the period observed.
Extended Data Fig. 1
Extended Data Fig. 1. Map showing change in mature forest across the Maritime provinces of eastern Canada.
National parks and other protected areas (for New Brunswick only) are outlined in blue. Panel b: Overall, mature forest exhibited a net decline of 39% from 1985–2020. This decline is primarily due to clearcut harvesting (see Fig. 1a) and insufficient recruitment of forest into older age-class categories as a result of short harvest rotations. See Supplementary Methods (‘Old Forest Types’) for details on how old forest loss was quantified. Training data were only available for New Brunswick (the western part of the study area) so extrapolation was necessary for estimates of mature forest in Nova Scotia and Prince Edward Island (the eastern part of the study area).
Extended Data Fig. 2
Extended Data Fig. 2. Area Under the Receiver Operating Characteristic Curve (AUC) – a measure of model prediction success ranging from 0-1 (perfect predictions) – for presence-only species distribution models with 54 forest bird species of the Maritime Provinces.
AUCs were calculated using 50% (N = 66,136) of avian point count locations held-out from test data in 15 km2 blocks to ensure spatial independence.
Extended Data Fig. 3
Extended Data Fig. 3. Habitat change (1985–2020) for 54 species of forest birds according to back-cast species distribution models.
Transitions from green, through yellow, to red across cells indicate annual habitat loss. Sixty-six percent of species show net habitat loss over the full time period, and 93% lost habitat over the past 10 years.
Extended Data Fig. 4
Extended Data Fig. 4. Relationship between area clearcut occurring from 1985–2020 in each species’ habitat in a 200 m buffer surrounding Breeding Bird Survey Routes (N = 90) and habitat loss (1985–2020) at the same scale for each of 23 mature-forest associated species (species codes provided in Supplementary Table 5).
Black lines are regression lines and gray bands are 95% confidence intervals. This relationship would have been obscured if the rate of habitat gain (regrowth) compensated for habitat loss (due to clearcutting mature forest). However, in this system, clearcutting is removing habitat without compensatory replacement.
Extended Data Fig. 5
Extended Data Fig. 5. Spatial association between clearcutting and habitat change for three mature forest species.
The first column of panels shows species-specific habitat that has remained stable since 1985 in green with loss of habitat in pink and habitat gains in blue. The second column of panels shows the footprint of clearcut harvesting (black) within the same landscape. Remaining areas in pink in the right-hand column are locations where habitat has been lost due to a different cause than clearcutting (for example, land-use change). There is high congruence between clearcutting and areas where habitat was lost. Clearcutting data shown are from the New Brunswick provincial inventory.
Extended Data Fig. 6
Extended Data Fig. 6. Habitat change for 22 species of old-forest associated birds both inside (green) and outside (within a 50 km buffer) of three large terrestrial national parks in the Maritime provinces.
Under the hypothesis that timber harvest and forest management are the primary drivers of habitat decline, loss should be predominantly outside of reserves, where harvesting is not permitted. Although for some species, minor habitat loss occurs inside parks (likely due to natural shifts in forest composition), habitat loss is much higher beyond park boundaries.
Extended Data Fig. 7
Extended Data Fig. 7. Habitat distribution and change maps for two examples of mature-forest-associated species within and outside three national parks in eastern Canada (Fundy, Kouchibouguac, Kejimkujik National Parks) and the core area of the study region.
Note that habitat loss (red) is common in landscapes surrounding parks, but largely absent within, indicating that the habitat loss we quantified is due to timber harvest, not climate-induced changes in Landsat reflectance, or natural disturbance. White areas indicate non-habitat.
Extended Data Fig. 8
Extended Data Fig. 8. Effects of habitat change on changes in bird population abundance.
Panel a shows Bayesian posterior distributions for the effects of SDMmodeled habitat change (x-axis) in each year on bird abundance in the corresponding year (parameter µβ in Equation 3), using Breeding Bird Survey data. Population changes for thirteen species were strongly positively influenced by habitat changes on abundance; most of these species (10/13) are associated with old forest (dark green) which supports the hypothesis that forest degradation-driven declines in habitat amount are affecting population changes in these species. Panel b shows the posterior probability that habitat change had an effect on population change for 54 forest bird species. Fox Sparrow not shown in a due to large positive effect size.
Extended Data Fig. 9
Extended Data Fig. 9. Habitat trends within 100 m of BBS routes (red lines) versus the entire Maritimes region (green lines) for 54 species of forest birds.
Habitat trends along BBS routes tend to reflect changes in the region except for a few species (for example, Blackthroated Blue Warbler). Habitat amounts for BBS routes and the Maritimes region were normalized to 1 for the starting year (1985).
Extended Data Fig. 10
Extended Data Fig. 10. Study area and location of 12,272 Maritimes Breeding Bird Atlas (MBBA) survey locations (black dots), and Breeding Bird Survey (BBS) routes (orange lines).
We used MBBA bird point counts (collected 2006–2011) to build species distribution (habitat) models, and we used long-term BBS routes (N = 90) to test whether changes in habitat in landscapes surrounding these routes successfully predicted longterm population trends in 54 species of forest birds.

Comment in

  • Old forests are not replaceable.
    [No authors listed] [No authors listed] Nat Ecol Evol. 2022 Jun;6(6):653. doi: 10.1038/s41559-022-01806-y. Nat Ecol Evol. 2022. PMID: 35681003 No abstract available.

References

    1. Betts MG, et al. Global forest loss disproportionately erodes biodiversity in intact landscapes. Nature. 2017;547:441–444. doi: 10.1038/nature23285. - DOI - PubMed
    1. Chase JM, Blowes SA, Knight TM, Gerstner K, May F. Ecosystem decay exacerbates biodiversity loss with habitat loss. Nature. 2020;584:238–243. doi: 10.1038/s41586-020-2531-2. - DOI - PubMed
    1. Barlow J, et al. Anthropogenic disturbance in tropical forests can double biodiversity loss from deforestation. Nature. 2016;535:144–147. doi: 10.1038/nature18326. - DOI - PubMed
    1. Matricardi EAT, et al. Long-term forest degradation surpasses deforestation in the Brazilian Amazon. Science. 2020;369:1378. doi: 10.1126/science.abb3021. - DOI - PubMed
    1. Assessing Forest Degradation: Towards the Development of Globally Applicable Guidelines (Food and Agriculture Organization of the United Nations, 2011).

Publication types