. 2022 May;7(5):680-694.
doi: 10.1038/s41564-022-01103-1. Epub 2022 Apr 28.

Gut microbial β-glucuronidases regulate host luminal proteases and are depleted in irritable bowel syndrome

Affiliations

Gut microbial β-glucuronidases regulate host luminal proteases and are depleted in irritable bowel syndrome

Adam L Edwinson et al. Nat Microbiol. 2022 May.

Abstract

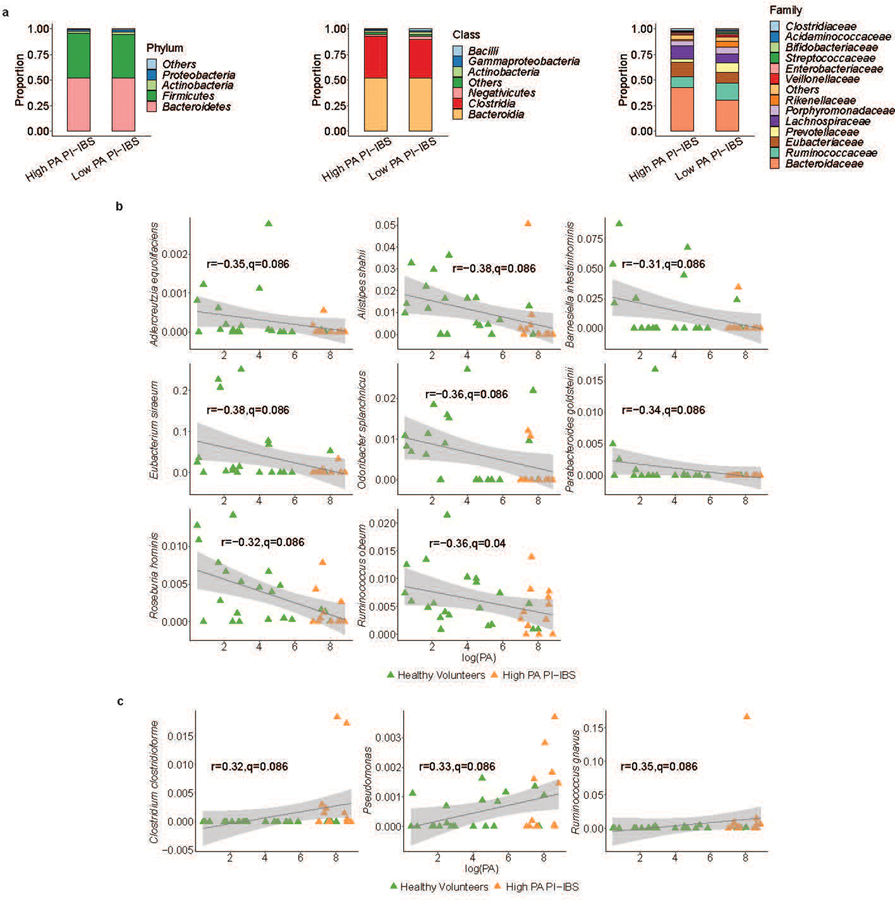
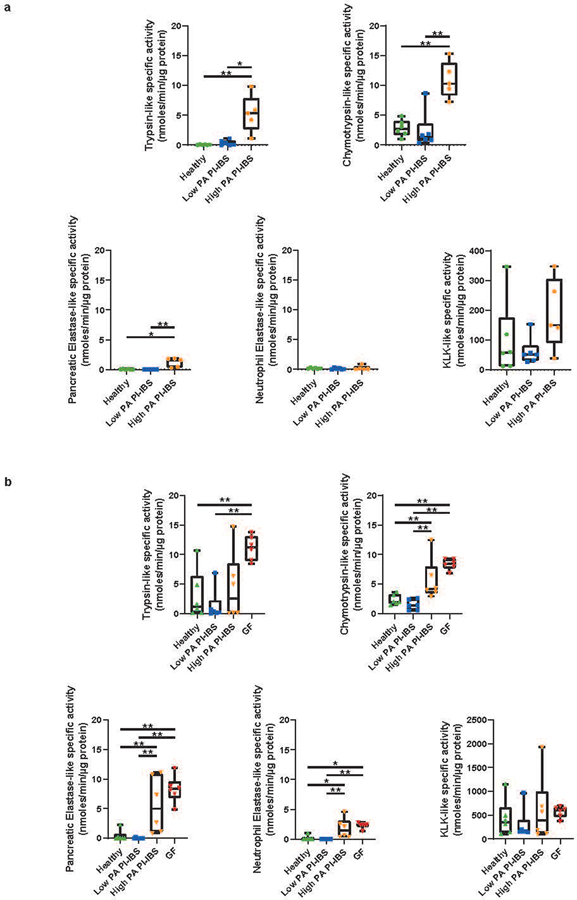
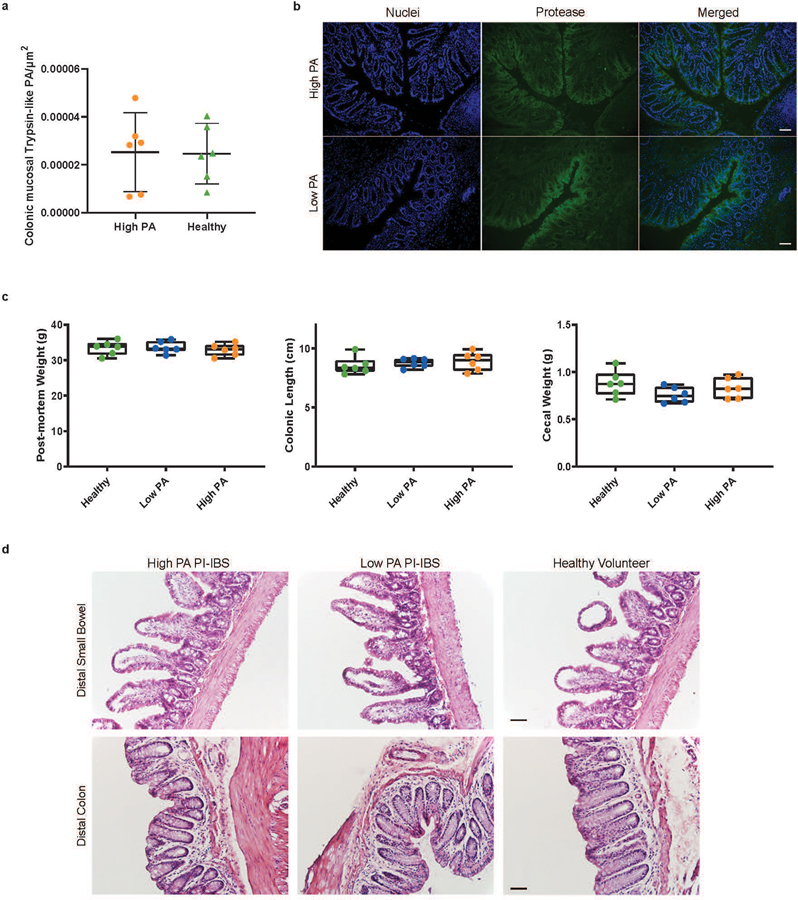
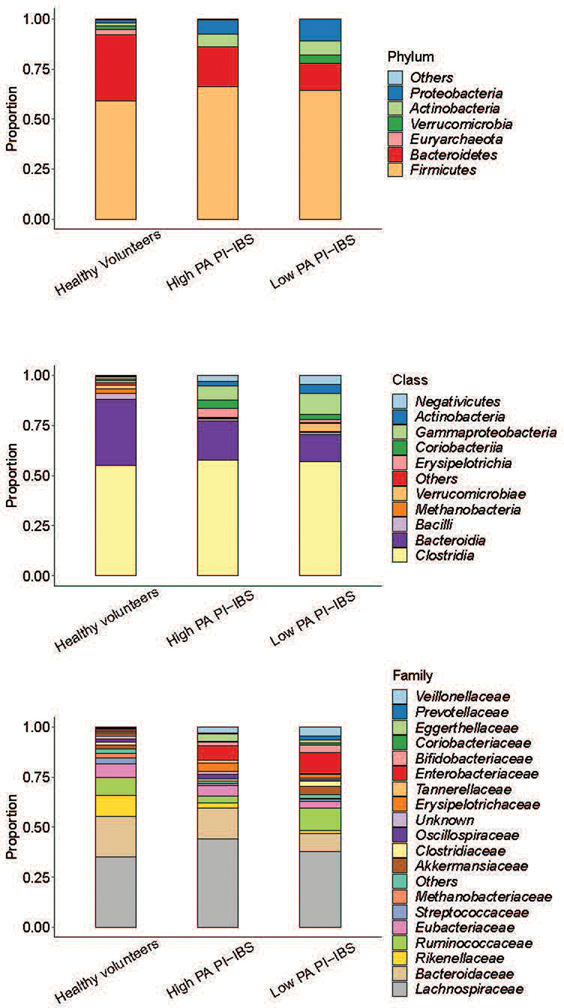
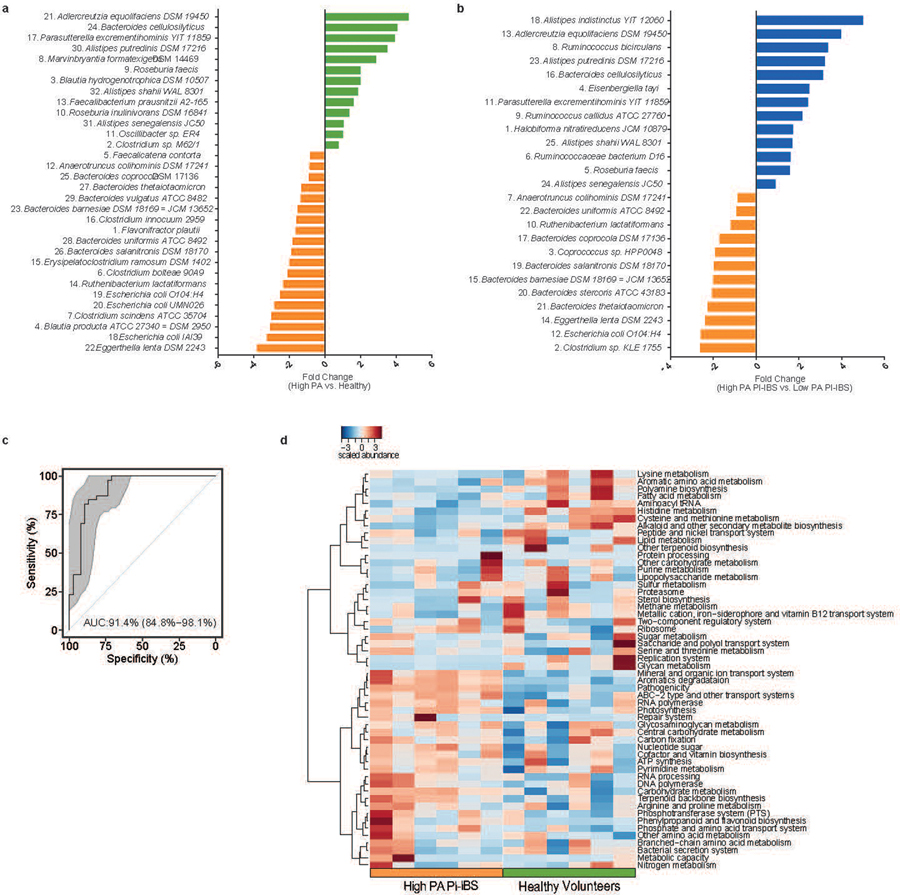
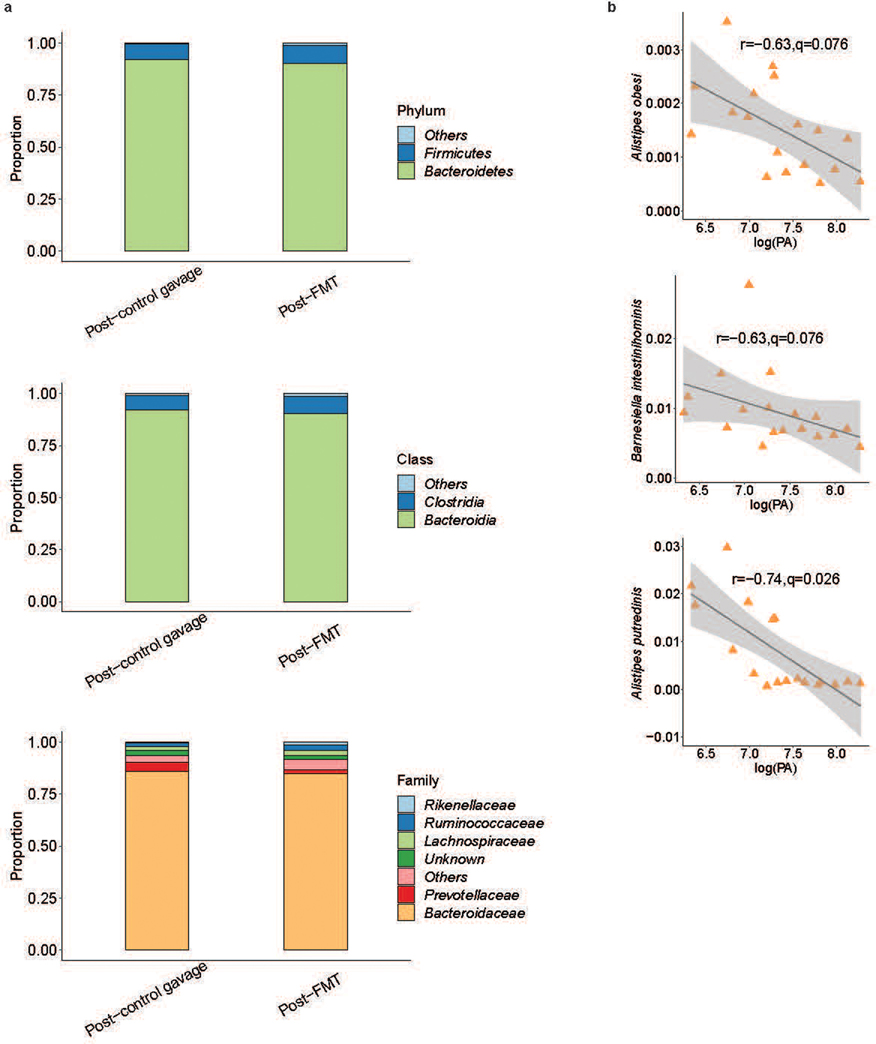
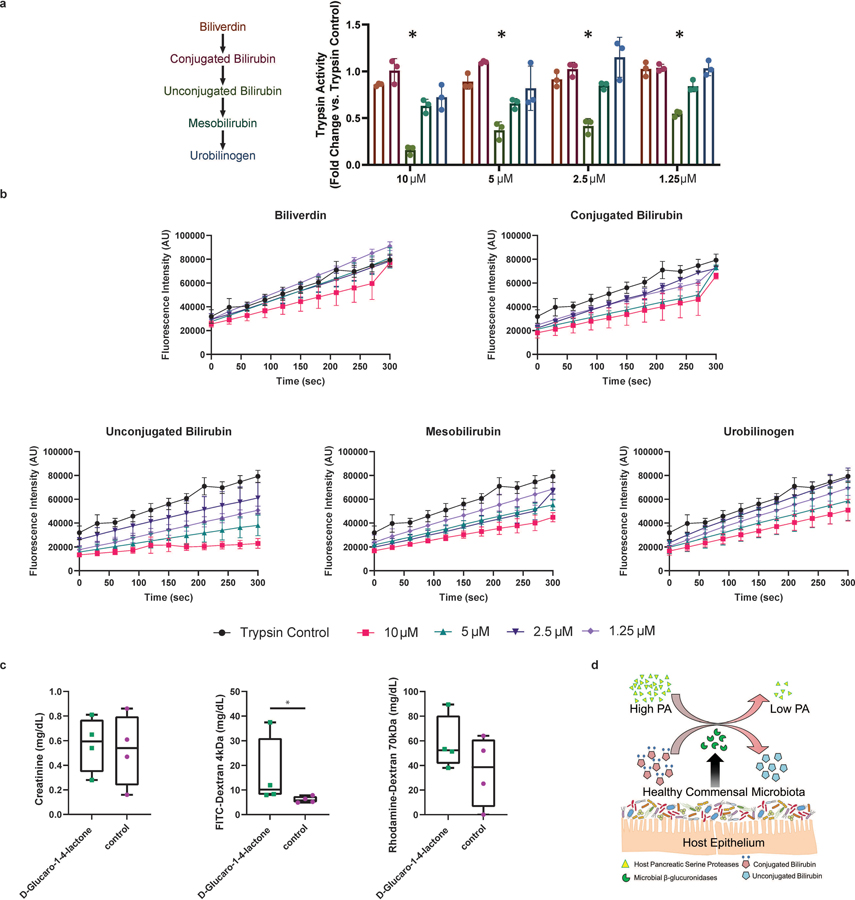
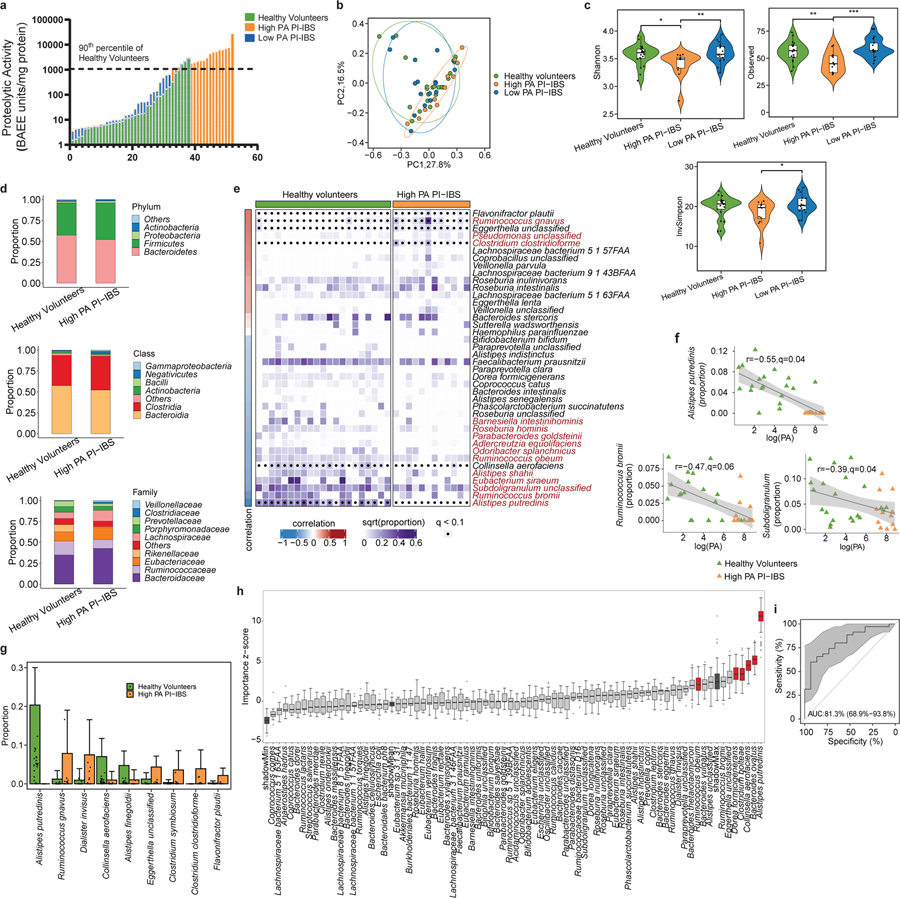
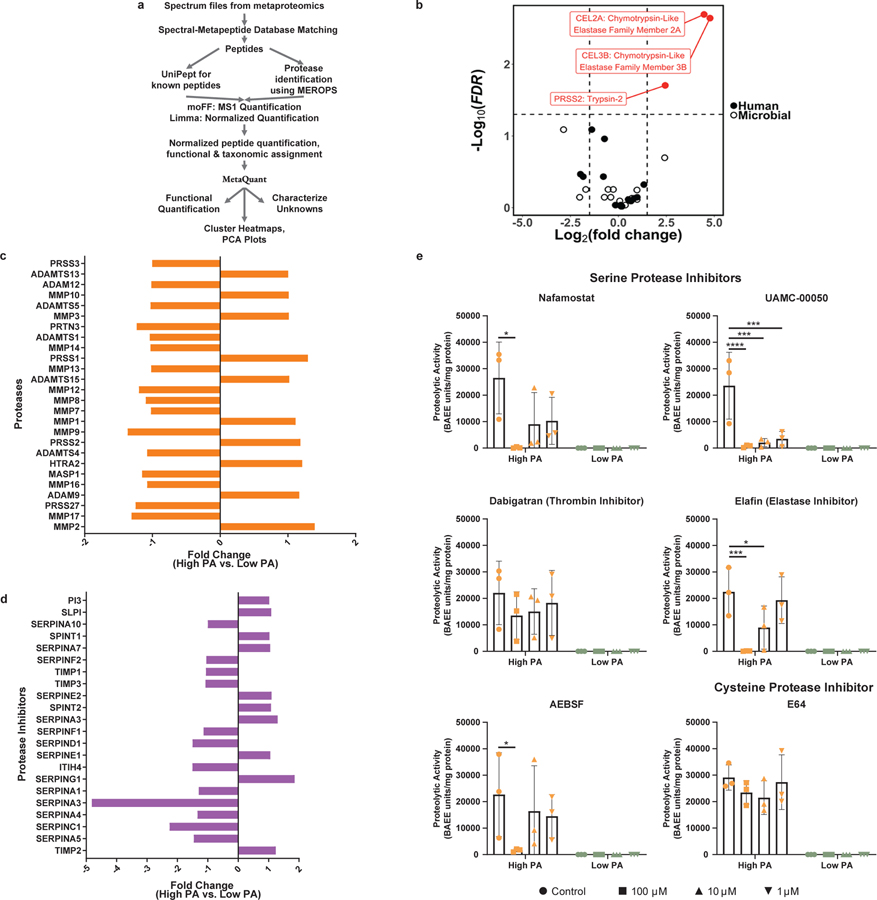
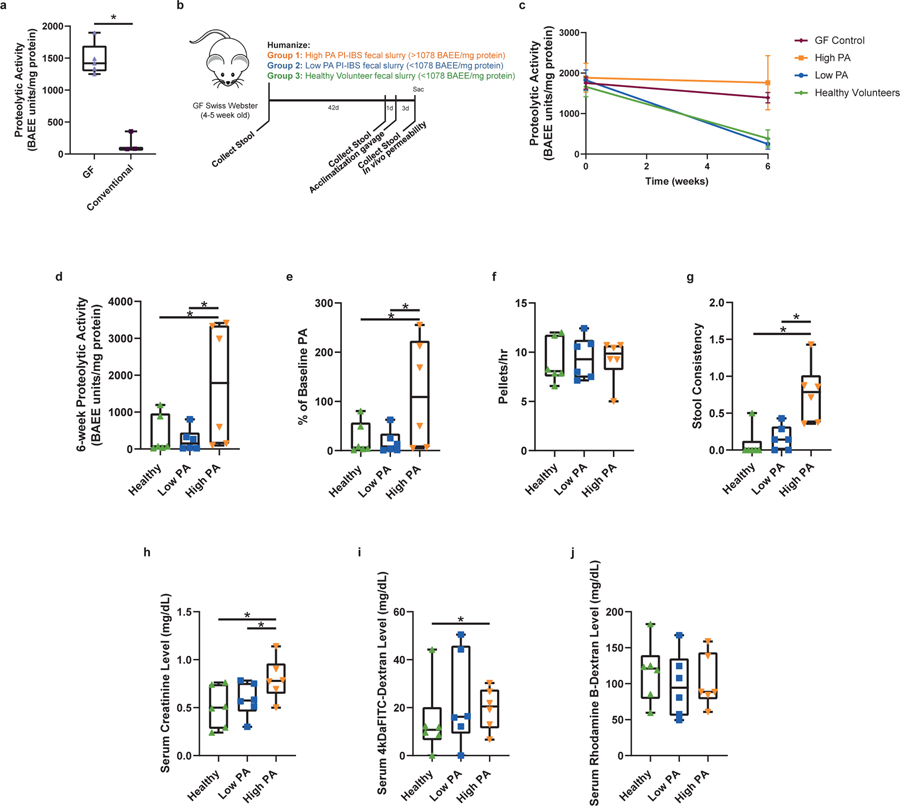
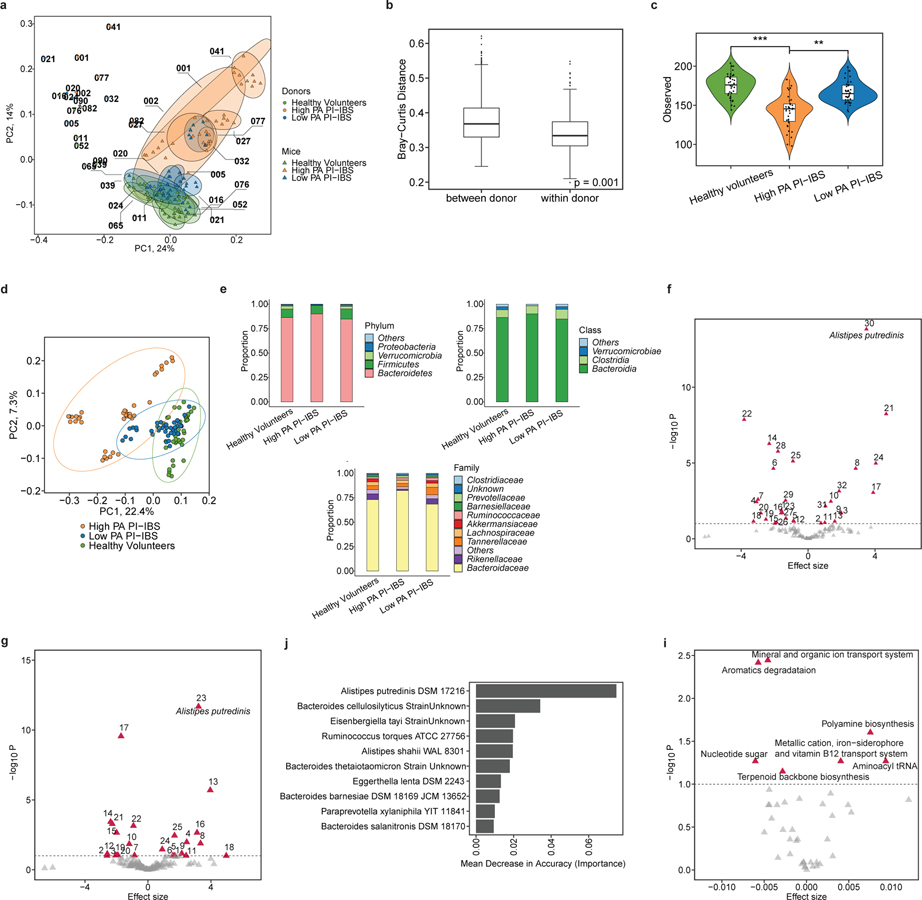
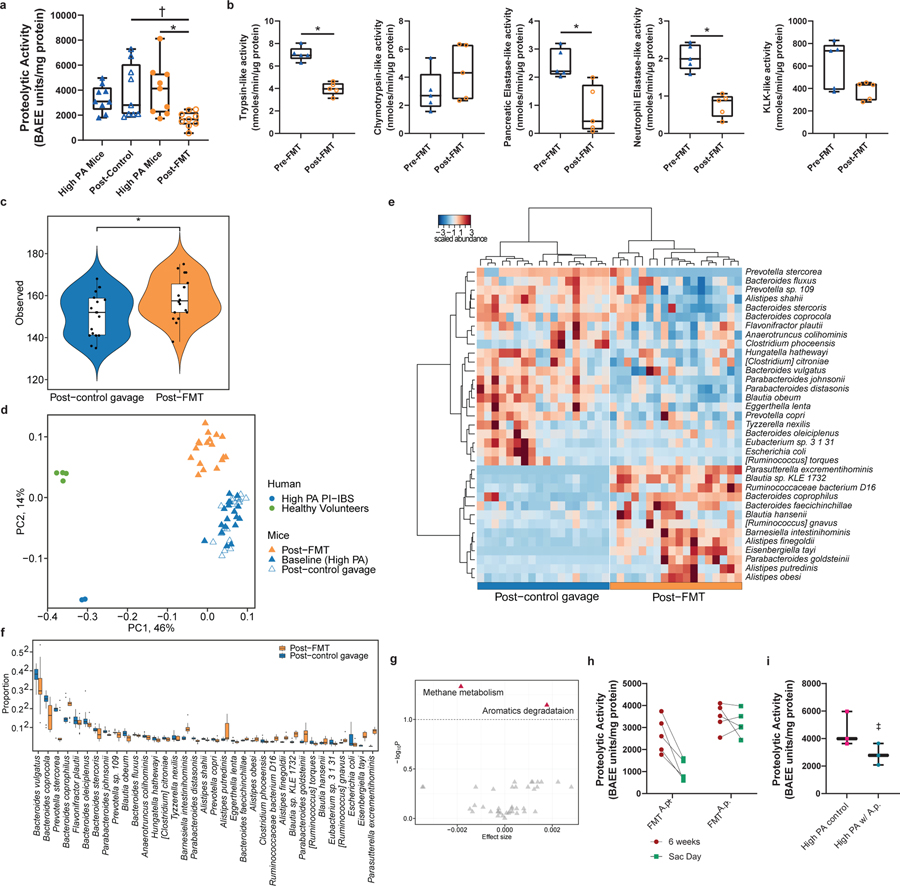
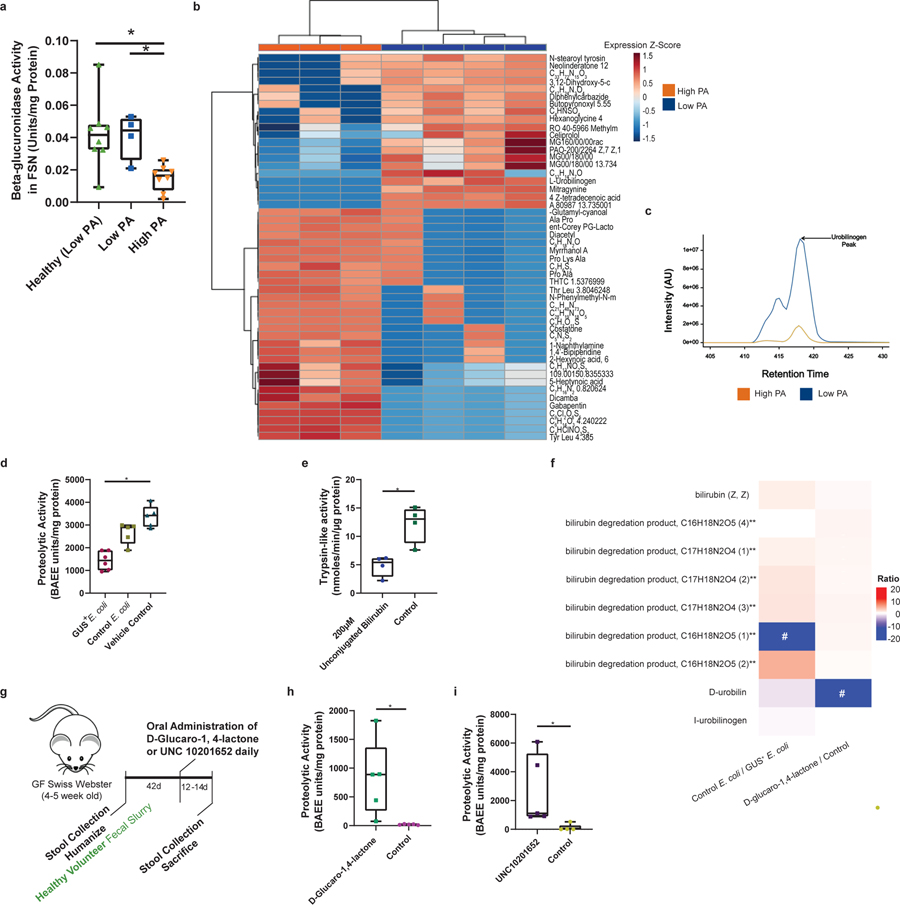
Intestinal proteases mediate digestion and immune signalling, while increased gut proteolytic activity disrupts the intestinal barrier and generates visceral hypersensitivity, which is common in irritable bowel syndrome (IBS). However, the mechanisms controlling protease function are unclear. Here we show that members of the gut microbiota suppress intestinal proteolytic activity through production of unconjugated bilirubin. This occurs via microbial β-glucuronidase-mediated conversion of bilirubin conjugates. Metagenomic analysis of faecal samples from patients with post-infection IBS (n = 52) revealed an altered gut microbiota composition, in particular a reduction in Alistipes taxa, and high gut proteolytic activity driven by specific host serine proteases compared with controls. Germ-free mice showed 10-fold higher proteolytic activity compared with conventional mice. Colonization with microbiota samples from high proteolytic activity IBS patients failed to suppress proteolytic activity in germ-free mice, but suppression of proteolytic activity was achieved with colonization using microbiota from healthy donors. High proteolytic activity mice had higher intestinal permeability, a higher relative abundance of Bacteroides and a reduction in Alistipes taxa compared with low proteolytic activity mice. High proteolytic activity IBS patients had lower fecal β-glucuronidase activity and end-products of bilirubin deconjugation. Mice treated with unconjugated bilirubin and β-glucuronidase-overexpressing E. coli significantly reduced proteolytic activity, while inhibitors of microbial β-glucuronidases increased proteolytic activity. Together, these data define a disease-relevant mechanism of host-microbial interaction that maintains protease homoeostasis in the gut.


Conflict of interest statement

Competing interests: Dr. Grover has disclosure to Mayo Clinic ventures on microbes described in this manuscript. None to disclose for other co-authors.

Figures

Extended Data Fig. 1
Extended Data Fig. 1. Taxa differentially abundant between low and high PA status and correlation with fecal PA.
a, The microbiota of high and low PA PI-IBS patients (n=12 high PA PI-IBS, 17 low PA PI-IBS) were compared at the phyla, class, and family levels. At both phyla and class levels of taxonomy, no significant differences were observed between the two groups of patients. However, one taxon, Rikenellaceae, was differential at the family level (FDR<0.05). Rikenellaceae, the family of A. putredinis and was in higher abundance in low PA PI-IBS subjects with an average abundance of 5.3%, compared to 1.1% in high PA PI-IBS individuals. b, Correlation scatterplots for differentially abundant taxa negatively correlating with PA. In addition to the top 3, an additional 8 differentially abundant (11/14) taxa correlated with low fecal PA. They exhibited weak negative correlation (0.31 ≤ |r| ≤ 0.38). High PA (orange) and healthy volunteers (green) are plotted. Correlation coefficients (r) and q-values are generated from comparisons within the entire cohort to assess the relationship between PA and taxa abundance (n=21 HV, 12 high PA PI-IBS, 17 low PA PI-IBS). Grey area shows 95% confidence level for linear smooths. c, Correlation scatterplots for differentially abundant taxa that positively correlate with PA. Of the 14 differential taxa, only 3 positively correlated with high fecal PA. Clostridium clostridioforme, Pseudomonas and Ruminococcus gnavus all had a weak, positive correlation (0.32 ≤ |r| ≤ 0.35). Plots were generated as stated above. Grey area shows 95% confidence level for linear smooths.
Extended Data Fig. 2
Extended Data Fig. 2. Specific serine protease activity assays in both high PA human and high PA humanized mouse fecal supernatants.
a, Specific serine protease activity of human fecal samples. Using an enzyme preferential substrate assay, fecal trypsin (*p=0.049, **p=0.004), chymotrypsin (**p=0.004) and pancreatic elastase (*p=0.03, **p=0.007) activities were increased in fecal supernatants generated from high PA individuals compared to both low PA PI-IBS and healthy volunteers (One-way ANOVA, multiple comparisons Kruskal-Wallis, n=6 FSNs/group). b, Specific activity of serine proteases in humanized mice and germ-free mice. Mice humanized with high PA microbiota had increased chymotrypsin (*p=0.049, **p=0.004), pancreatic elastase (healthy **p=0.008, low PA PI-IBS **p=0.002) and neutrophil elastase activity (*p=0.01, **p=0.002) in fecal supernatants compared to either healthy volunteer or low PA PI-IBS humanized mice. Decreased trypsin (healthy **p=0.008, low PA PI-IBS **p=0.002), chymotrypsin (**p=0.002), pancreatic elastase (**p=0.002) and neutrophil elastase (*p=0.02, **p=0.004) activity were seen in healthy and low PA PI-IBS humanized mice compared to the germ-free (GF) state. (One-way ANOVA, multiple comparisons Kruskal-Wallis, n=3 mice tested/humanization, 6 humanizations/phenotype, n=6 germ-free mice). Boxplots: lower, middle and upper hinges correspond to 25th, 50th and 75th percentiles. Upper and lower whiskers extend to the largest and smallest value no further than 1.5 * IQR from the respective hinge.
Extended Data Fig. 3
Extended Data Fig. 3. Tissue protease activity, gross morphology or histopathology of the high PA, low PA and healthy volunteer humanized mice.
a, In situ zymography for trypsin-like activity in mouse colonic tissue. No differences were observed between high PA and healthy humanized mice (n=6 mice/group, data presented as mean ±SD). b, Representative in situ zymography image of high PA and healthy mouse tissue. SYTOX Green Nuclear Stain (ThermoFisher, S7020) pseudocolored blue, N-p-Tosyl_Gly-Pro-Arg 7-amido-4-methylcoumarin hydrochloride cleavage pseudocolored green (Scale bar 50μm), c, Mouse weight, cecal weight and colonic length of humanized mice. Post-mortem weight was collected on humanized mice after which the gastrointestinal tract was removed and cecal weight was recorded. Colonic length measurements were done from proximal cecum to the distal rectum (n=6 human feces/phenotype, dots represent average). Boxplots: lower, middle and upper hinges correspond to 25th, 50th and 75th percentiles. Upper and lower whiskers extend to the largest and smallest value no further than 1.5 * IQR from the respective hinge. d, Histological examination of the gastrointestinal tract of humanized mice. Distal small bowel and distal colon tissue sections were evaluated by a pathologist (RG) in blinded manner. No observed differences in inflammation and presence of immune cells between humanized mice (n= 6 mice scored/phenotype, Scale bar 50μm).
Extended Data Fig. 4
Extended Data Fig. 4. Higher level taxonomic evaluation of human fecal samples used for humanization.
Comparisons were made between the microbiota of healthy, low PA and high PA PI-IBS fecal slurries used for mouse humanization (n=6 human feces/phenotype) which showed no significant differences at phylum, class and family levels.
Extended Data Fig. 5
Extended Data Fig. 5. Differentially abundant taxa and KEGG pathways between healthy, low PA and high PA PI-IBS humanized mice.
a, Comparison between healthy and high PA PI-IBS humanized mice engrafted microbiota. 32 differentially abundant taxa were identified between high PA with healthy humanized mice. Of the identified taxa, 13 were in greater fold abundance in healthy humanized mice compared to high PA PI-IBS mice. Colors denote greater abundance in the respective humanized group (green: healthy, orange: high PA PI-IBS, n=6 feces/phenotype). Numbers labeling the taxa correspond to the labels presented in the main manuscript, Fig. 4f. b, Differences in observed taxa between engrafted microbiota of low PA and high PA PI-IBS humanized mice. Microbiome analysis showed 25 differential taxa between low PA and high PA PI-IBS humanized groups, with 13 in greater abundance in low PA, and 12 in high PA. Colors denote greater abundance in the respective humanized group (blue: low PA PI-IBS, orange: high PA PI-IBS n=6 feces/phenotype). Numbers adjacent to taxa correspond to labels provided in main manuscript Figure 4g. c, Receiver operating curve assessing random forest ability to predict PA status based on taxa in humanized mice. The ability of random forest modelling algorithm to predict PA status based on selected taxa was assessed in humanized mice with an area under curve (AUC) of 0.914, (95% CI 0.848–0.981). Grey area shows confidence shape. d, Heatmap of predicted KEGG pathway differences between high PA and healthy humanized mice (n=6 feces/phenotype).
Extended Data Fig. 6
Extended Data Fig. 6. Fecal microbiome transfer in high PA humanized mice results in a compositional changes
a, Microbiome profiles of high PA humanized mice receiving either a control or an FMT with healthy microbiota (n=9 mice/group) were compared at the phyla, class, and family levels. At both phyla and class levels of taxonomy, no significant differences were observed between the two groups of mice. However, at the family level, 9 differential taxa were observed. With increased abundance of Prevotellaceae, Eubacteriaceae, Enterobacteriaceae, Bacteroidaceae, and Clostridiaceae in controls while Odoribacteraceae, Rikenellaceae, Barnesiellaceae and Sutterellaceae were more abundant in mice receiving FMT (FDR<0.1).b, Correlation scatterplots for differentially abundant taxa that negatively correlate with PA post-FMT treatment. After FMT, three bacterial species were found to negatively correlate with fecal PA, all at a q< 0.1. Taxa identified were A. putredinis, Barnesiella intestinihominis, and A. obesi. All of these taxa had strong negative correlations with PA status in mice post-FMT (0.6 ≤ |r| ≤ 0.79). Correlation coefficients (r) and q-values are generated from comparisons within FMT and control animals to assess the relationship between PA and differentially abundant taxa (n=9 mice/group). Grey area shows 95% confidence level for linear smooths.
Extended Data Fig. 7
Extended Data Fig. 7. In vitro trypsin activity is suppressed by unconjugated bilirubin, and inhibition of GUS enzymes results in increased intestinal permeability
a, Trypsin activity in the presence of metabolites within the bilirubin deconjugation pathway. Compared to the other metabolites used for experimentation, unconjugated bilirubin was the only metabolite that significantly inhibited trypsin activity across all concentrations examined. Data presented as Δfluorescence/time, normalized to a trypsin-only control (2-Way ANOVA, Tukey’s multiple comparison test, n=3 *p=0.001, data presented as mean ±SD). b, Time course inhibition of trypsin activity in the presence of bilirubin metabolites (n=3 biologically independent replicates, data presented as mean ±SD). c, Measurement of intestinal permeability in D-Glucaro-1,4-lactone treated humanized mice. Serum 4-kDa FITC-dextran levels were greater in healthy humanized mice treated with D-Glucaro-1,4-lactone indicating inhibition of GUS enzymes causes an increase in leak pathway permeability (2-sided Mann-Whitney, n=4/group *p=0.03). Boxplots: lower, middle and upper hinges correspond to 25th, 50th and 75th percentiles. Upper and lower whiskers extend to the largest and smallest value no further than 1.5 * IQR from the respective hinge. d, Proposed mechanism of microbial based inhibition of host proteases via the production of GUS enzymes.
Figure 1:
Figure 1:. High proteolytic activity (PA) following C. jejuni infection is characterized by reduced microbiota diversity and taxa loss.
a, PA of PI-IBS and healthy volunteers. High PA in 19/52 PI-IBS patients (90th percentile of healthy volunteers dotted line >1078 BAEE/mg of protein, n=38 healthy, 52 PI-IBS). b, PCoA plot of β-diversity. Microbiota composition in high PA is different from healthy (p=0.05) or low PA PI-IBS (p=0.01) (Bray-Curtis distance, PERMANOVA, with 999 permutations, n= 21 healthy, 12 high PA, 17 low PA PI-IBS). c, Alpha diversity measures between high PA PI-IBS, low PA PI-IBS and healthy volunteers (n=12 high PA PI-IBS, 17 low PA PI-IBS, 21 healthy, linear regressions, *p=0.05,**p=0.01,***p=0.001). d, Higher level taxonomic representation (n=12 high PA PI-IBS, 21 healthy). e, Correlation matrix between fecal PA and taxa. Correlations made taxa with q <0.2 with taxa in red highlighting differential abundance at q<0.1. Spearman correlation coefficient (r) identify taxa correlating with PA. Density reflective of proportions of taxa within healthy or high PA with dots denoting differential at q<0.1. f, Representative scatterplots between logPA and taxa of entire cohort. High PA and healthy volunteers plotted (n=21 healthy, 12 high PA PI-IBS). Grey area: 95% confidence level of linear regression. g, Differentially abundant taxa between healthy and high PA PI-IBS. Alistipes putredinis absent from high PA (n= 21 healthy, 12 high PA, q<0.1). Data are presented as mean + s.d. h, Boruta feature selection algorithm identifying predictive taxa of PA status. Six taxa identified (n=12 high PA, 17 low PA PI-IBS). i, Receiver operating curve of random forests prediction. AUC=0.813, (95% CI 0.69–0.94). Grey area: 95% confidence interval. Boxplots: lower, middle and upper hinges correspond to 25th, 50th and 75th percentiles. Upper and lower whiskers extend to largest and smallest value no further than 1.5 * IQR from respective hinge.
Figure 2:
Figure 2:. Fecal and tissue proteomics demonstrates serine proteases of human pancreatic origin drive high PA in PI-IBS.
a, Pipeline used for identifying human and microbial fecal proteomic profiles of high PA and low PA feces. b, Metaproteomic analysis of high and low PA fecal samples. Volcano plot highlights feces from high PA volunteers have an increased abundance of host pancreatic proteases (n=7 high PA, 6 low PA, FDR<0.05). Three proteases, chymotrypsin like pancreatic elastase 2A, 3B (FDR=0.002 for each, Standard t-test) and trypsin 2 (FDR=0.02, Standard t-test), all serine family, were identified in greater abundance in high PA samples. c-d, Proteomic analysis of rectosigmoid colonic biopsies using SOMAscan® platform. Comparisons of proteases (c) and protease inhibitors (d). Analysis reveals that production of mucosal derived proteases and inhibitors are comparable regardless of PA phenotype (n=7 high PA, 6 low PA). e, In vitro inhibition of high PA FSN with protease inhibitors. AEBSF (100μM *p=0.042), nafamostat (100μM *p=0.002), UAMC-0050 (100μM ****p=0.0001, 10μM ***p=0.0002, 1μM ***p=0.0004), and elafin (100μM ***p=0.0005, 10μM *p=0.032) significantly inhibited PA in vitro while dabigatran (thrombin inhibitor) and E64 (cysteine protease inhibitor) had no effect. (2-way ANOVA, Tukey’s multiple comparison test, n= 3 high and 3 low PA FSNs per condition). Barplots are presented as mean ± s.d.
Figure 3:
Figure 3:. Gnotobiotic mice demonstrate healthy commensal microbiota suppresses host derived PA while high PA PI-IBS microbiota does not.
a, Absence of microbiota characterized by higher PA (Swiss-webster female, 2-tailed Mann-Whitney, n=3 germ free,−5 conventional mice, p=0.04). b, Mouse model of humanization. c, Healthy and low PA microbiota causes host fecal PA drop (n=6 feces/phenotype, dots represent average, presented as mean ± s.d). d, Post-humanization PA is dependent on microbiota. Mice with healthy or low PA PI-IBS microbiota have significantly lower PA compared to high PA humanized mice (383 vs. 246 vs. 1,761 BAEE/mg protein, 2-Way ANOVA Tukey’s, n=6 feces/phenotype, dots represent average, *p=0.03 and *p=0.04 respectively). e, Low PA microbiota suppresses host PA. while mice with high PA microbiota have fecal PA similar to GF mice (% of baseline, healthy 24.5 ± 32.8, low PA 17.8 ± 23.9; high PA 116.3 ± 109.7, One-Way ANOVA-Kruskal-Wallis, n=6 feces/phenotype, dots represent average, *p=0.03). f, Humanized mouse pellet frequency. No difference between humanized groups in pellet production. g, Humanized mouse fecal pellet consistency. High PA humanized mice have significantly looser feces. Scored 0=normal to 4=diarrhea. Two averaged independent observations (One-Way ANOVA-Kruskal-Wallis, n=6 feces/phenotype, dots represent average, *p=0.01 for both). h, Pore pathway permeability. Creatinine levels in high PA humanized mice indicate increased pore pathway permeability (for all permeability pathways, n=6 human feces/phenotype; 3 mice/human feces, dots represent averaged mice; high PA PI-IBS 0.81 ± 0.28 mg/dL; low PA PI-IBS 0.58 ± 0.24; healthy 0.51 ± 0.36, One-Way ANOVA-Kruskal-Wallis, *p=0.05). i, Leak pathway permeability. 4-kDa FITC-dextran levels in high PA humanized mice show increased leak pathway permeability (high PA PI-IBS, 19.1 ± 14.6 mg/dL; low PA PI-IBS 23.9 ± 23.9; healthy 13.7 ± 30.3, One-Way ANOVA-Kruskal-Wallis, *p=0.04). j, Unrestricted pathway permeability. No difference in serum rhodamine levels across humanization states. Boxplots as previously described.
Figure 4:
Figure 4:. Microbial diversity and composition in humanized mice identify specific microbial taxa predicative of PA status and metabolic pathway differences.
a, Mice humanized with high PA, low PA PI-IBS and healthy volunteer microbiota have differences in microbiota composition (n=6 human feces/phenotype, dots represent average). b, Humanized mice intra-group, not inter-group relatedness. Humanized mice microbiota are compositionally and taxonomically different when compared to each other, but similar within its group (Bray-Curtis, PERMANOVA with 999 permutations, p=0.001). c, Alpha diversity across humanized mice. Healthy volunteer and low PA humanized mice have greater species richness compared to high PA humanized mice (n=6 human feces/phenotype, dots represent average, linear regression on observed species **p=0.01,***p=0.002). d, Beta diversity measures in humanized mice. Microbial composition differs between each humanization state (Bray-Curtis, PERMANOVA with 999 permutations, p=0.01). e, Higher level taxonomic evaluation of engrafted microbiota in humanized mice (n=6 human feces/phenotype, dots represent average). f-g, Volcano plot(s) highlighting strain level differences between high PA and healthy volunteer (f) or high and low PA PI-IBS humanized mice (g). Red icons indicating differences in abundance (q<0.1) with A. putredinis identified (n=6 human feces/phenotype, dots represent average). h, Prediction model of microbiota for PA status by random forests. The top 10 taxa predictive of PA status in mice assessed using mean decrease in accuracy. i, Predicted KEGG pathway differences between high PA and healthy volunteer humanized mice. Differentially abundant KEGG pathways with q<0.1. Effect size denotes average difference in KEGG functional unit between reference and comparison groups. Boxplots as previously described.
Figure 5:
Figure 5:. Fecal microbiome transfer of low PA microbial communities lowers PA of high PA humanized mice in Alistipes-dependent manner.
a, FMT treatment in high PA mice. FMT with a healthy microbiome decreased PA in high PA humanized mice compared to controls (1676 ± 613.6 vs. 3920± 2178 BAEE units/mg protein, One-Way ANOVA-Kruskal-Wallis †p=0.0235 and 2-sided Wilcoxon-Matched Pairs *p=0.011, 9 mice/group). b, FMT changes proteolytic profile. Trypsin, neutrophilic elastase, and pancreatic elastase activity was lower post-FMT compared to baseline (Paired t-test, Mann-Whitney n=5 mice, trypsin *p=0.003, pancreatic elastase *p=0.04, neutrophil elastase *p=0.006). c, Measurement of alpha diversity. Mice given FMT demonstrate greater microbial diversity compared to control mice (linear regression on observed species, n=9/group, p=0.01). d, Measurement of beta diversity. Bray-Curtis β-diversity ordination demonstrates shifts in microbiota composition following FMT. Mice receiving FMT cluster separately and towards a healthy, low PA microbiome (PERMANOVA, n=9 mice/group, p=0.001). e, Heatmap outlining differentially abundant taxa in mice treated with FMT. Taxa identified differentially abundant at q<0.1 (n=9 mice/group). f, Proportion of differentially abundant bacteria between FMT and control mice. 35 differential bacterial taxa identified at the species level (q<0.1), with 13 in greater abundance after FMT (n=9 mice/group). g, Predicted KEGG pathway differences. Methane metabolism pathway increased, and aromatics degradation decreased in FMT mice (n=9 mice, q<0.1). h, Restoration of low PA phenotype dependent on FMT community. Mice administered a community containing A. putredinis reduced fecal PA while FMT using low PA microbiota lacking A. putredinis was unable to suppress PA. Sac Day is 1-week post-FMT. (2-way ANOVA-Sidak’s, p=0.001, n=5 mice/group). i, High PA feces spiked with A. putredinis attenuates increased PA post-humanization (2-way ANOVA, Sidak’s n=3 mice/group, p=0.05, mean ± s.d). Boxplots as previously described.
Figure 6:
Figure 6:. Microbiota mediates PA suppression through microbial β-glucuronidase enzymatic activity and production of unconjugated bilirubin.
a, Beta-glucuronidase (GUS) activity in humans. High PA PI-IBS had lower fecal GUS activity compared to healthy and low PA PI-IBS (One-Way ANOVA-Kruskal-Wallis, *p=0.02 and *p=0.03 respectively, n=4 low PA, 8 high PA and 8 healthy). b, Concentration of urobilinogen in human feces. Untargeted fecal metabolomics identified higher urobilinogen in low PA compared to high PA feces (n=3 high PA and 4 low PA). c, Liquid chromatography tracing of urobilinogen (C18 column, n=3 high PA and 4 low PA PI-IBS). d, GUS suppresses PA in mice. Mice monocolonized with E. coli overexpressing GUS (GUS+) had significantly lower fecal PA compared to controls (1437 ± 411.7 vs. 3371 ± 481.9 BAEE units/mg protein, One-Way ANOVA-Kruskal-Wallis, p=0.004, n=5). e, Unconjugated bilirubin suppresses PA. Mice given unconjugated bilirubin (gavage, 3 days) had less trypsin-like activity compared to controls (4.8 vs 12.2 nmoles/min/μg protein, Mann-Whitney p=0.03, n=4 mice). f, Fecal metabolomics in experimental mice. Increased D-urobilin, #p=0.001 and bilirubin degradation product, C17H20N2O5 #p=0.03, seen in GUS+ and D-Glucaro-1–4-Lactone treated animals respectively (n=4 mice). g, Schematic for GUS inhibitors in humanized mice. h, D-Glucaro-1–4-Lactone increases fecal PA. Mice given D-Glucaro-1–4-Lactone, a non-specific GUS inhibitor, have significantly higher fecal PA than controls (825.3 ± 655.6 vs. 19.3 ± 8.0 BAEE units/mg protein, Mann-Whitney, n=5, p=0.008). i, UNC10201652, a microbial GUS inhibitor, increases fecal PA (2692 ± 2430 vs. 113.8 ± 230.1 BAEE units/mg of protein, Mann-Whitney, n=5, p=0.008). Data presented mean ± s.d. Boxplots as previously described. Human and mouse metabolite intensities were normalized using total ion current for each sample, log-transformed and compared between groups (Student’s t-test). p-values were adjusted using Benjamini-Hochberg method. Metabolites p-value <0.05 and absolute log2 fold change of > 0.5 (0.0 = no change) are mapped.

Comment in

References

    1. Turk B Targeting proteases: successes, failures and future prospects. Nat Rev Drug Discov 5, 785–799, doi:10.1038/nrd2092 (2006). - DOI - PubMed
    1. Edogawa S et al. Serine proteases as luminal mediators of intestinal barrier dysfunction and symptom severity in IBS. Gut 69, 62–73, doi:10.1136/gutjnl-2018-317416 (2020). - DOI - PMC - PubMed
    1. Cenac N et al. Role for protease activity in visceral pain in irritable bowel syndrome. J Clin Invest 117, 636–647, doi:10.1172/JCI29255 (2007). - DOI - PMC - PubMed
    1. Annahazi A et al. Luminal cysteine-proteases degrade colonic tight junction structure and are responsible for abdominal pain in constipation-predominant IBS. Am J Gastroenterol 108, 1322–1331, doi:10.1038/ajg.2013.152 (2013). - DOI - PubMed
    1. Denadai-Souza A et al. Functional proteomic profiling of secreted serine proteases in health and inflammatory bowel disease. Sci Rep 8, 7834, doi:10.1038/s41598-018-26282-y (2018). - DOI - PMC - PubMed

Publication types