. 2022 May;7(5):640-652.
doi: 10.1038/s41564-022-01105-z. Epub 2022 Apr 28.

Daily longitudinal sampling of SARS-CoV-2 infection reveals substantial heterogeneity in infectiousness

Affiliations

Daily longitudinal sampling of SARS-CoV-2 infection reveals substantial heterogeneity in infectiousness

Ruian Ke et al. Nat Microbiol. 2022 May.

Abstract

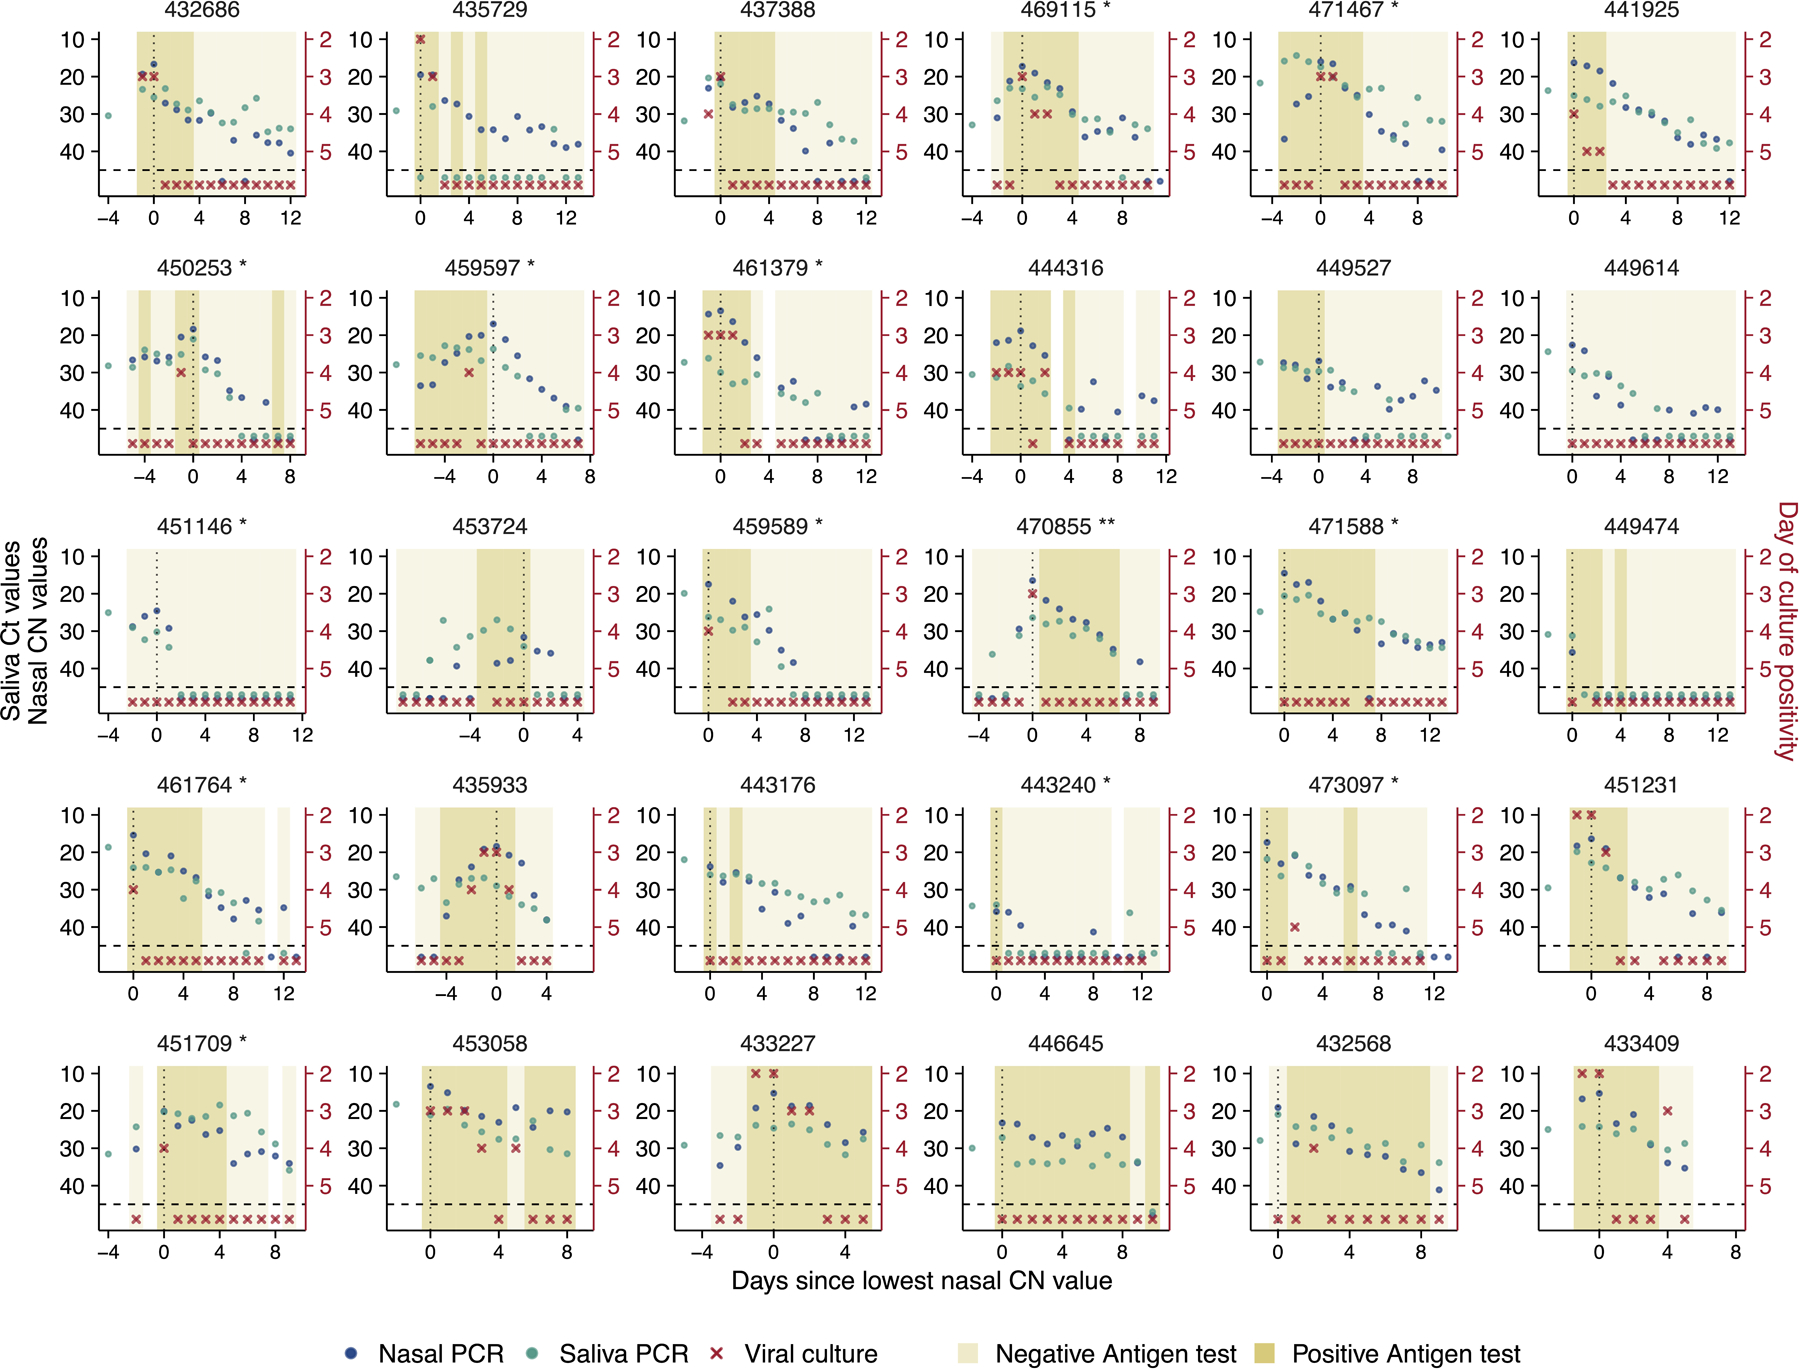
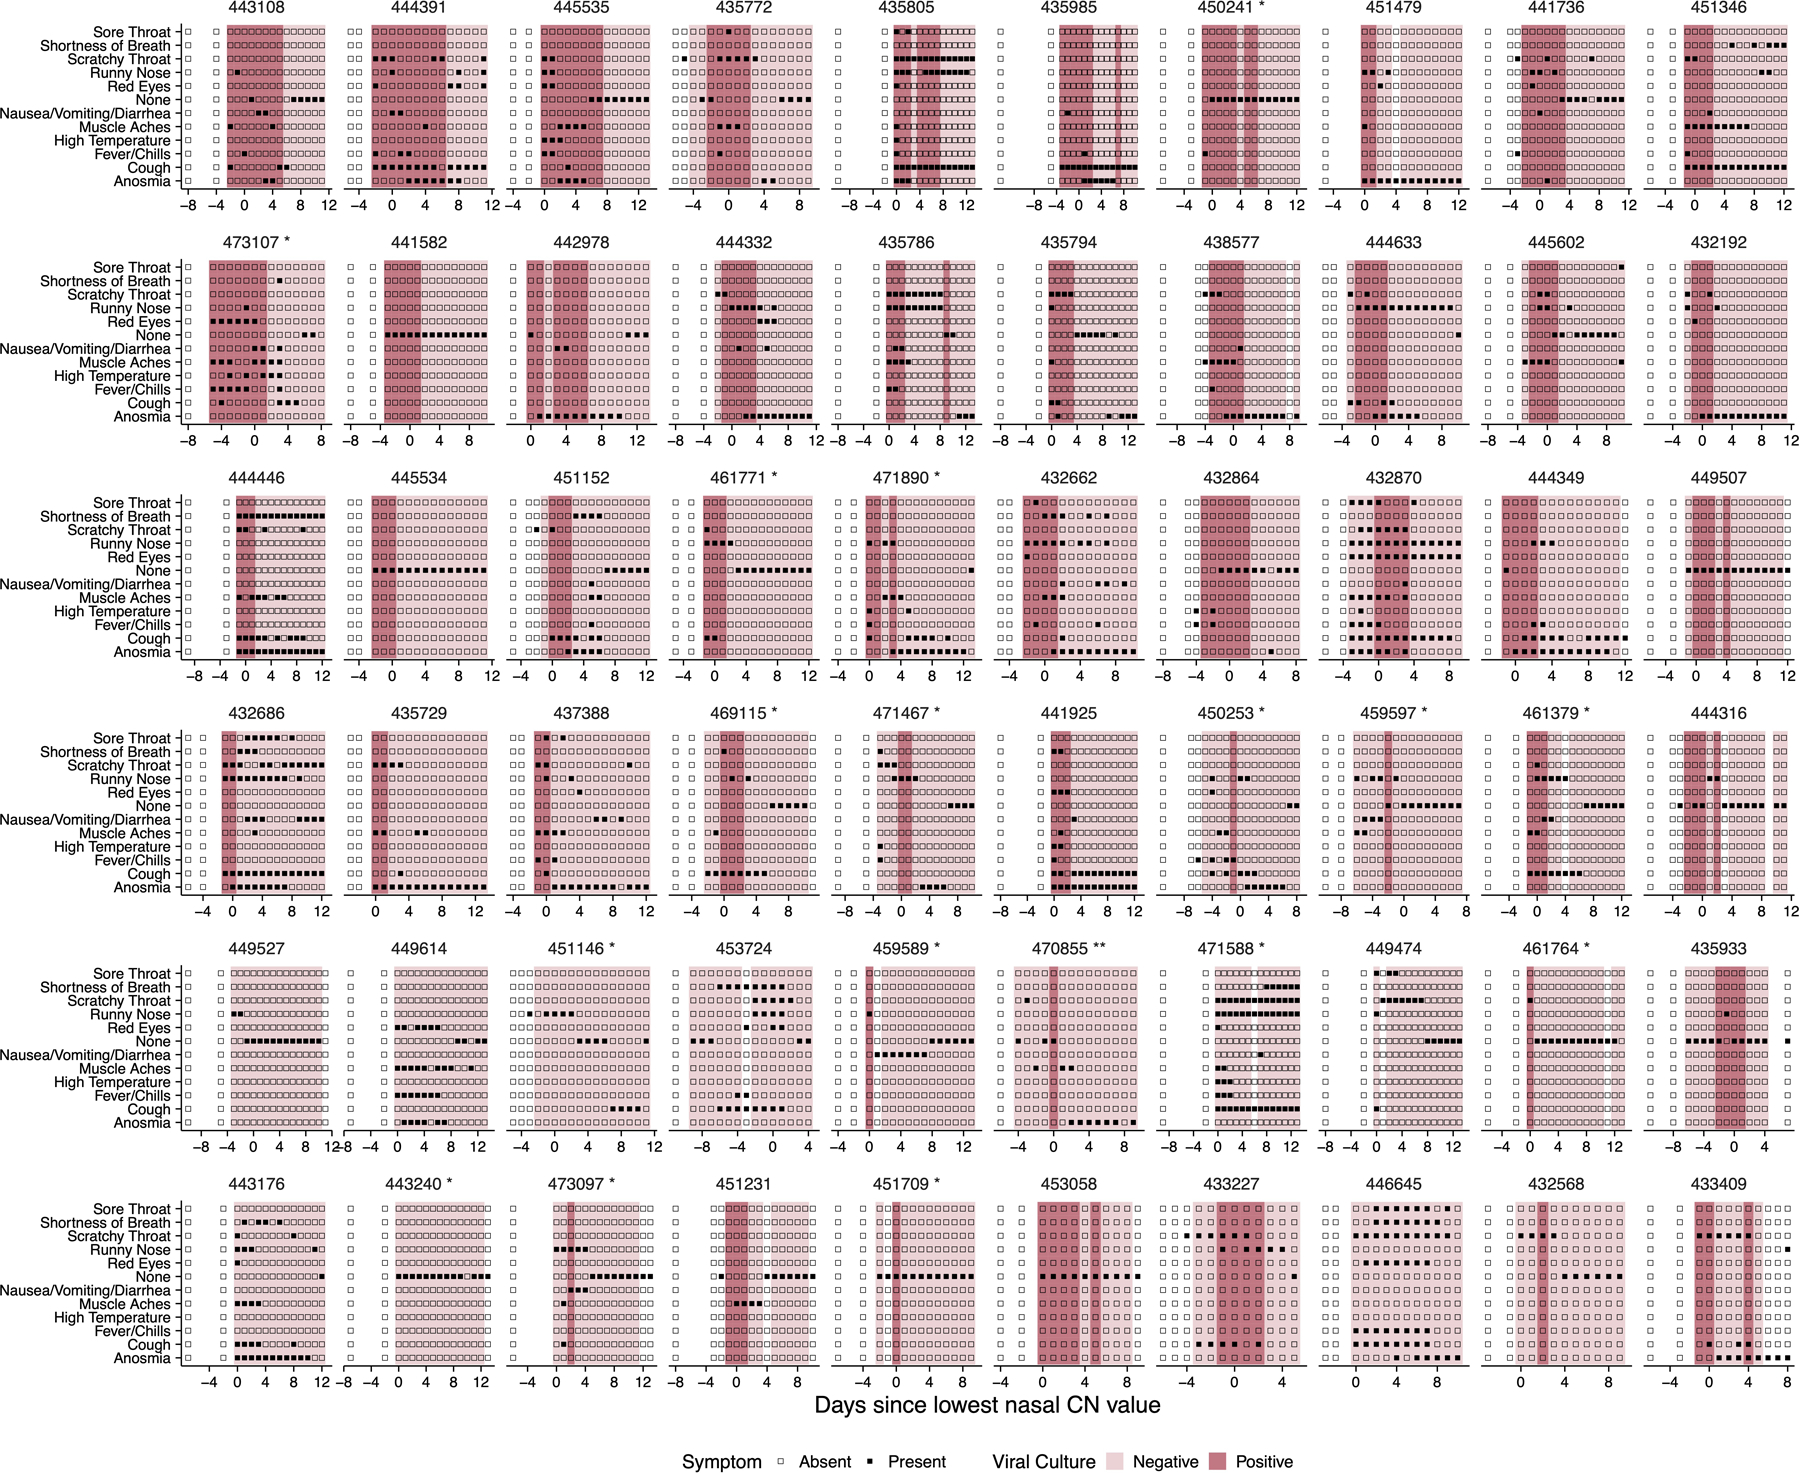
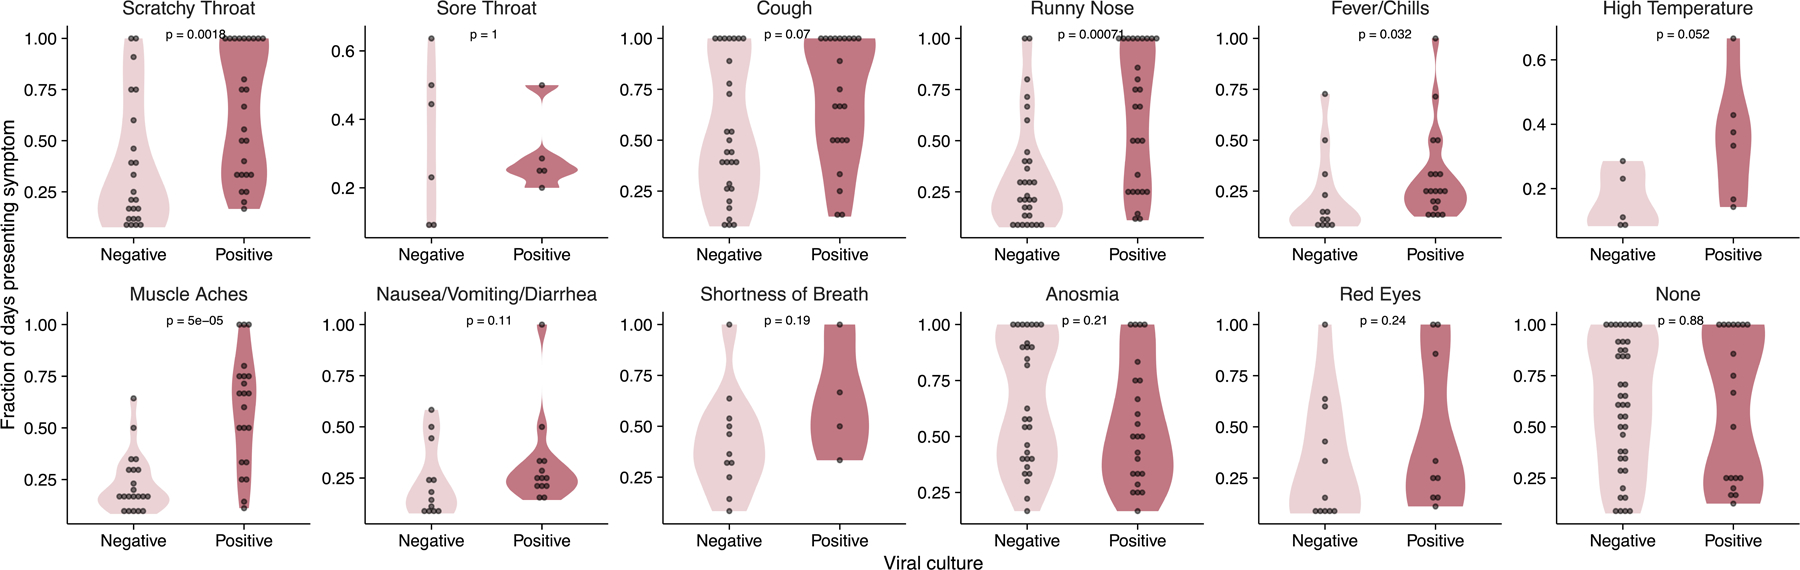
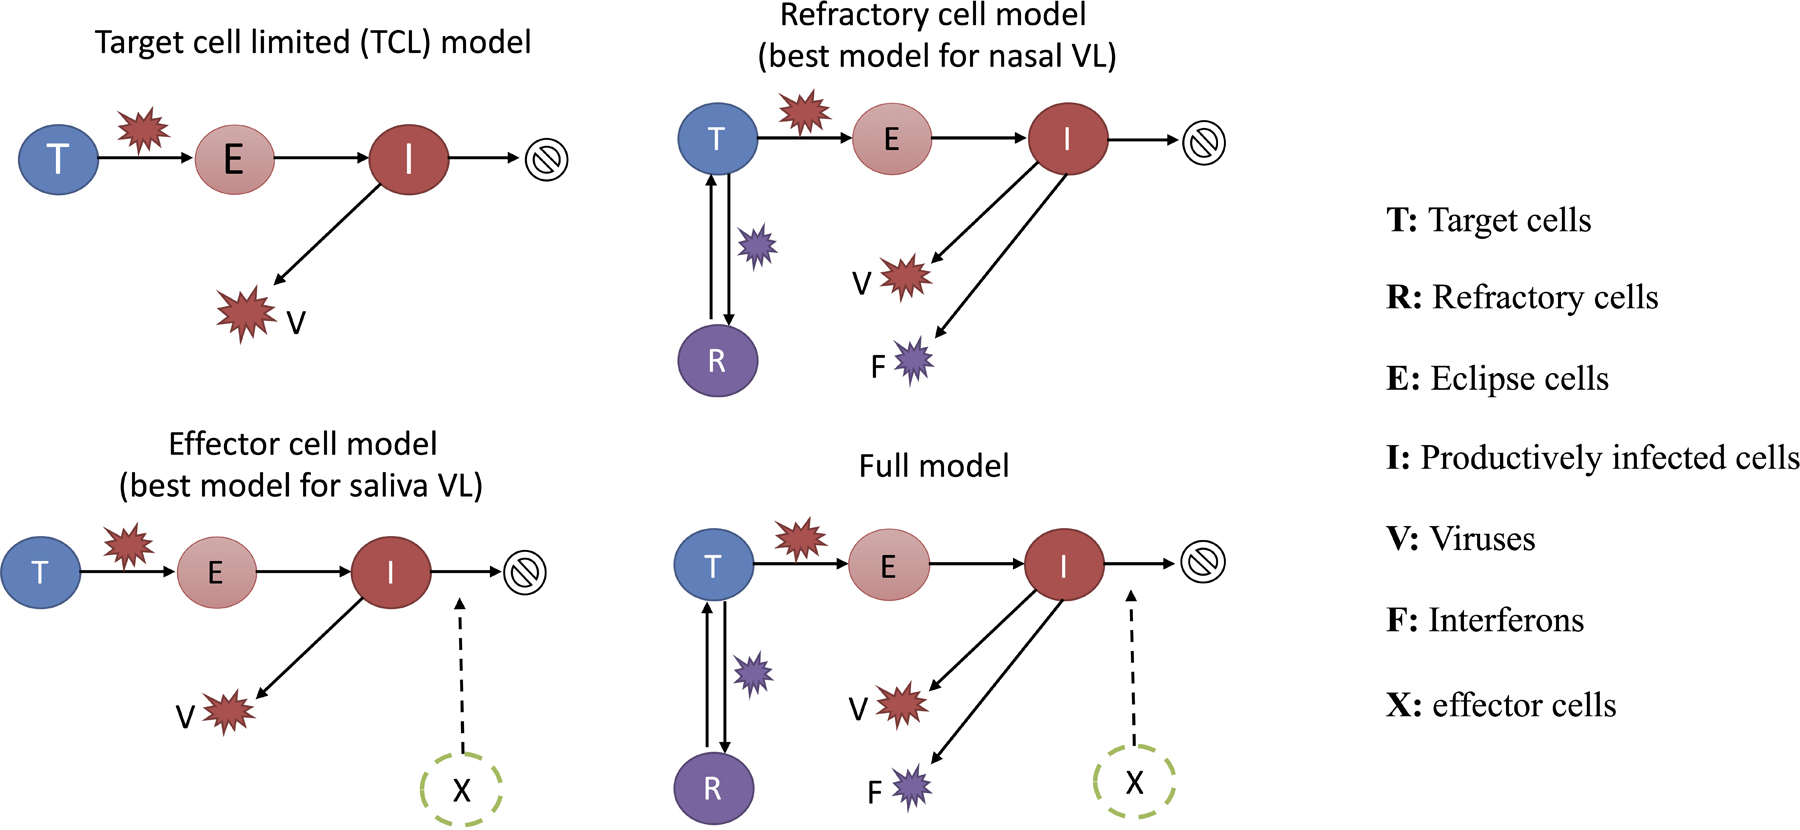
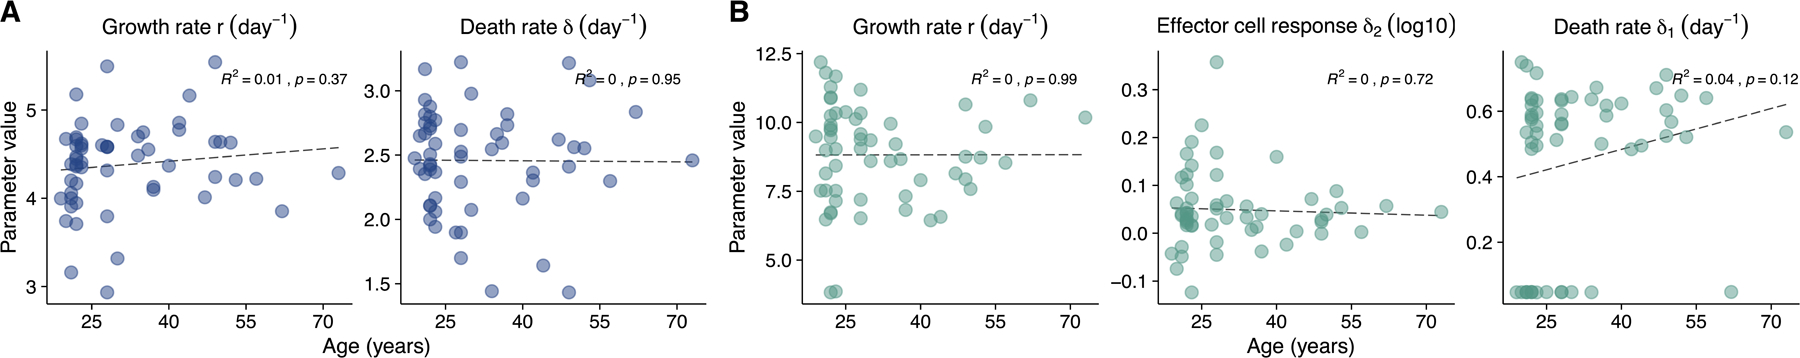
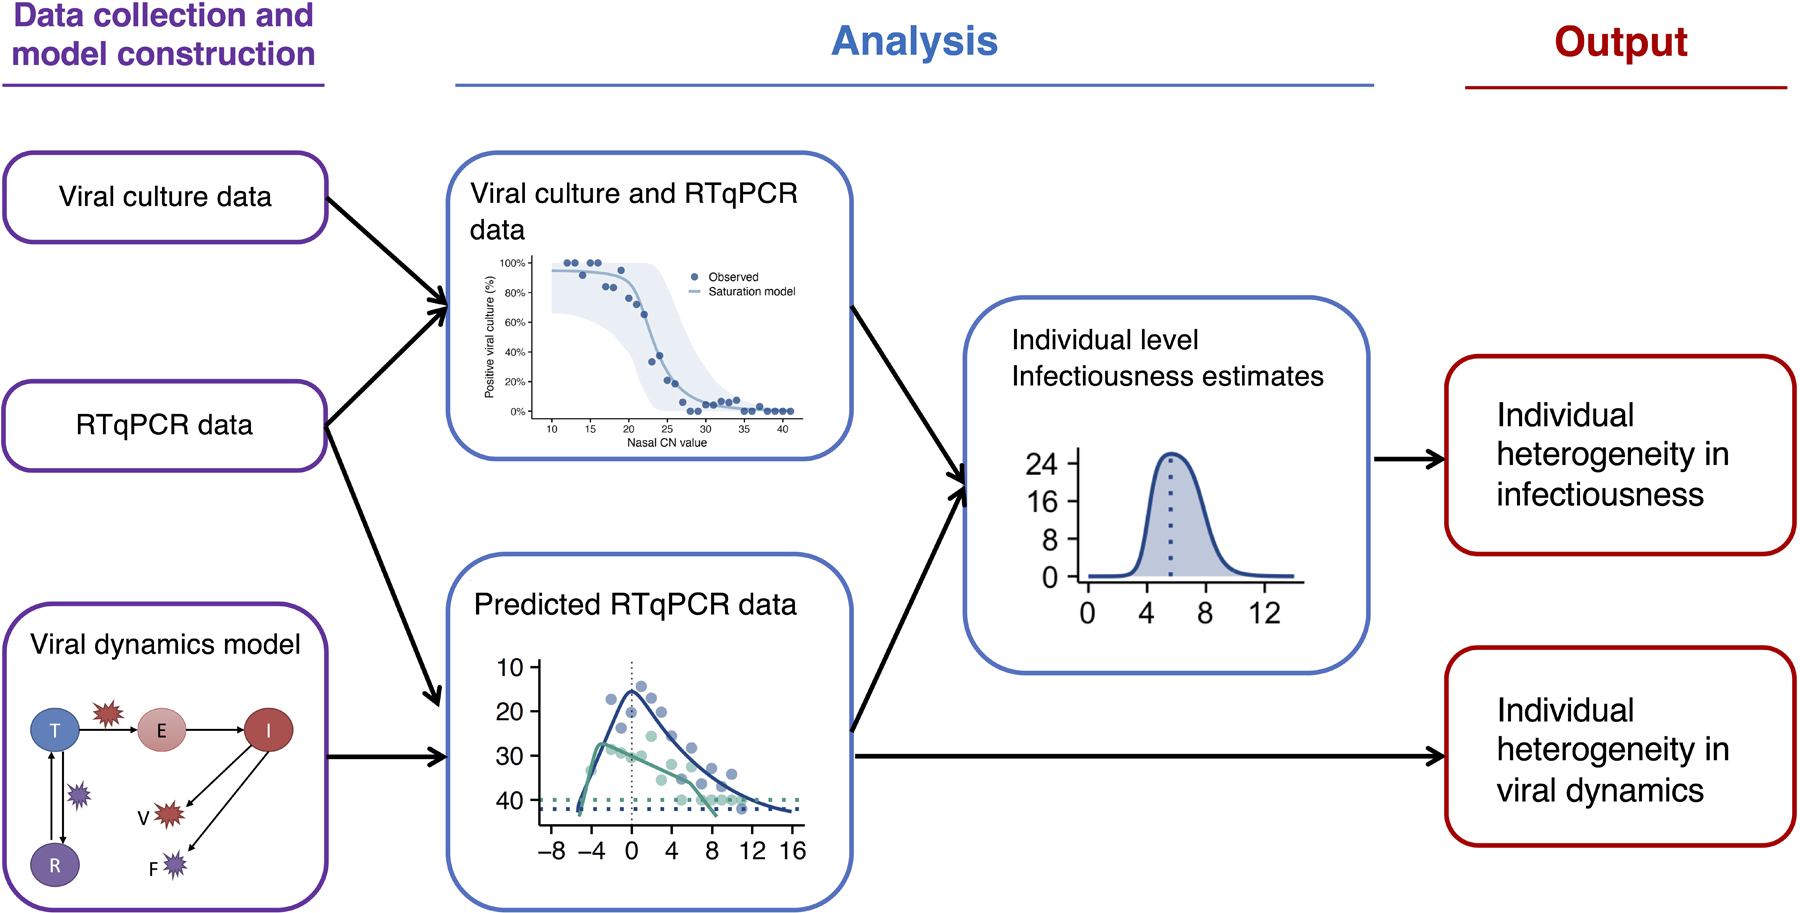
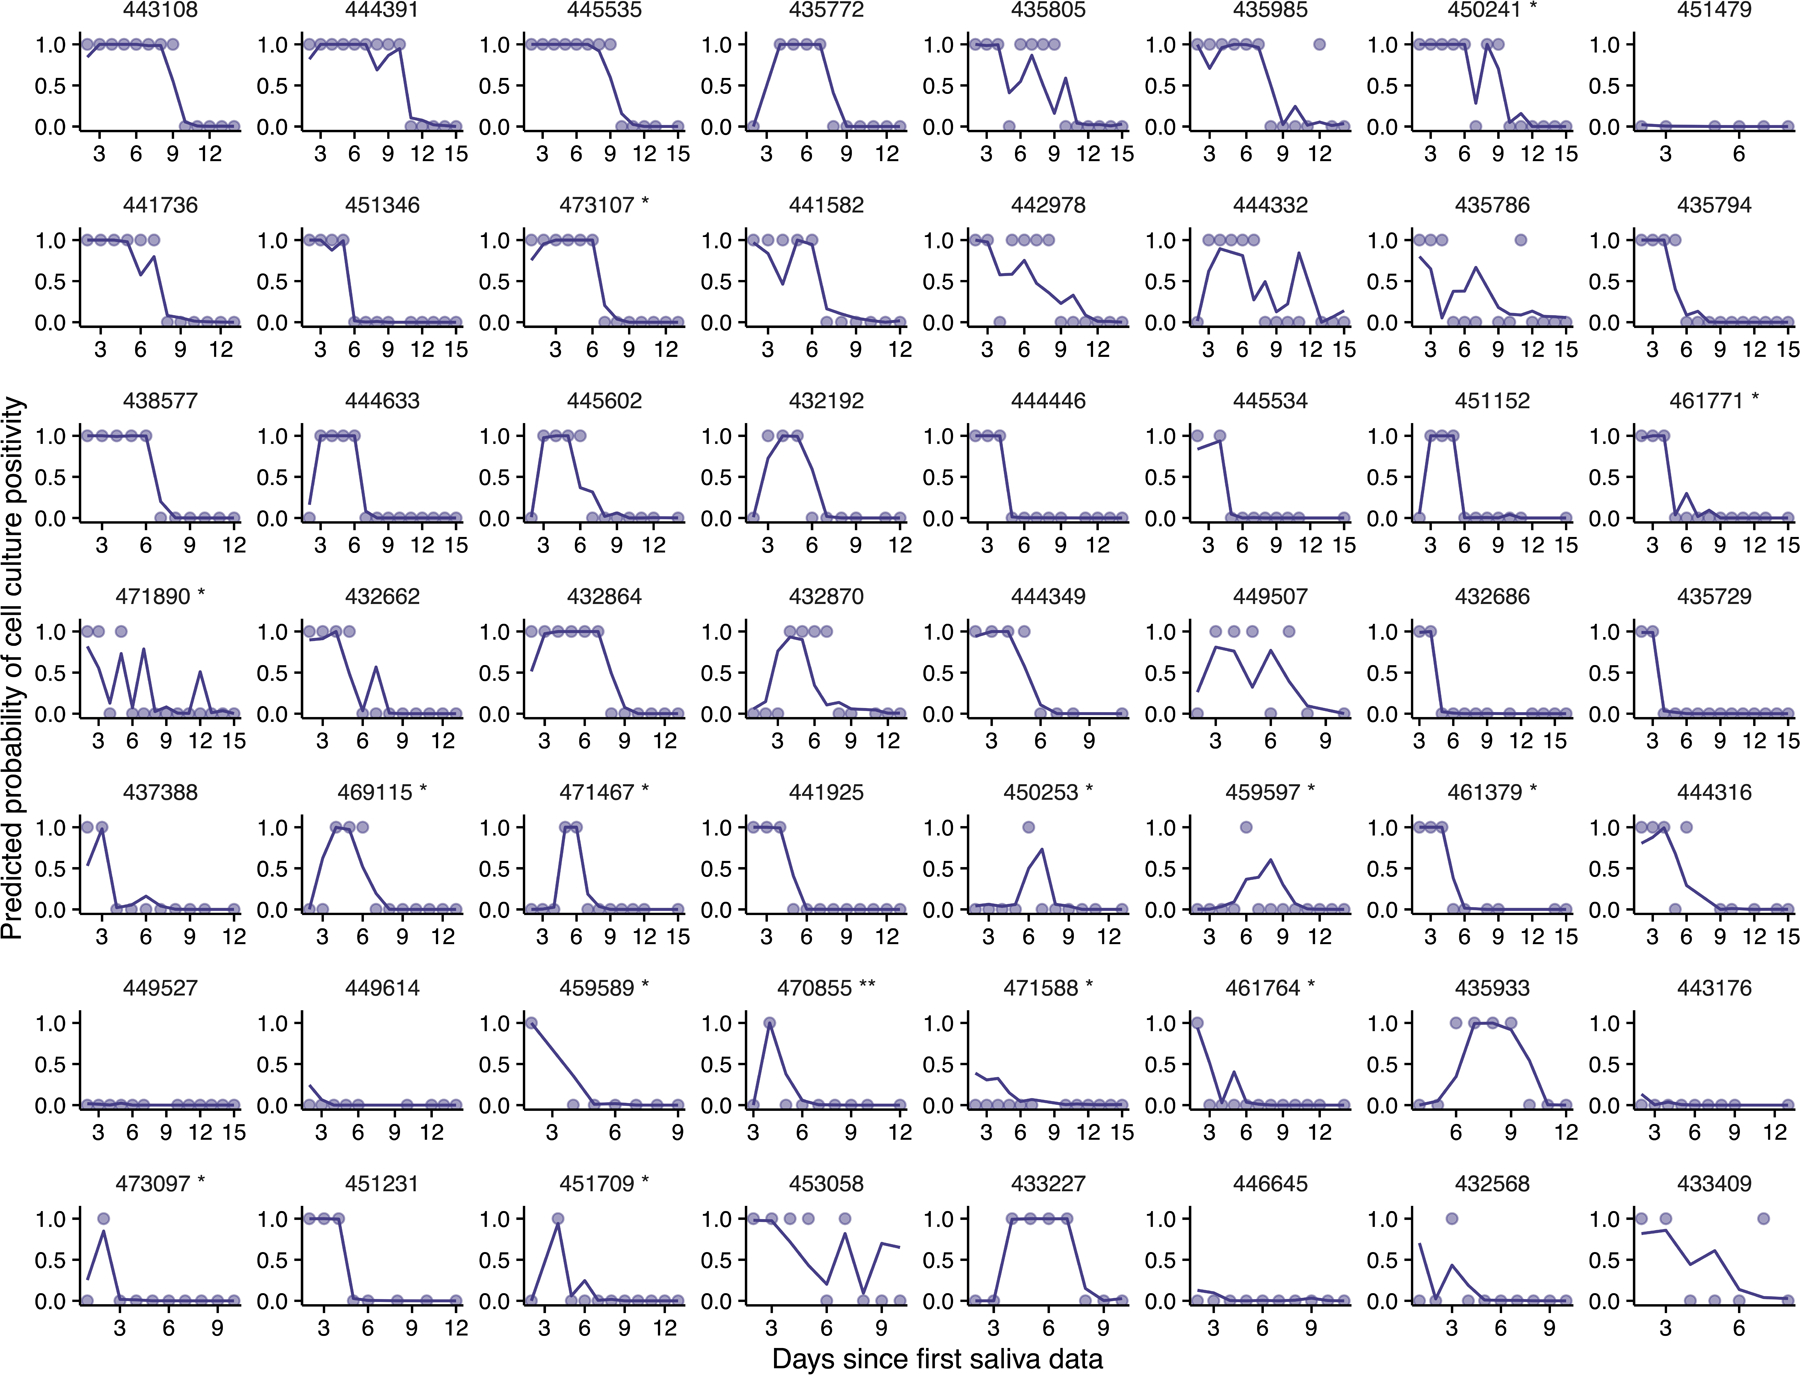
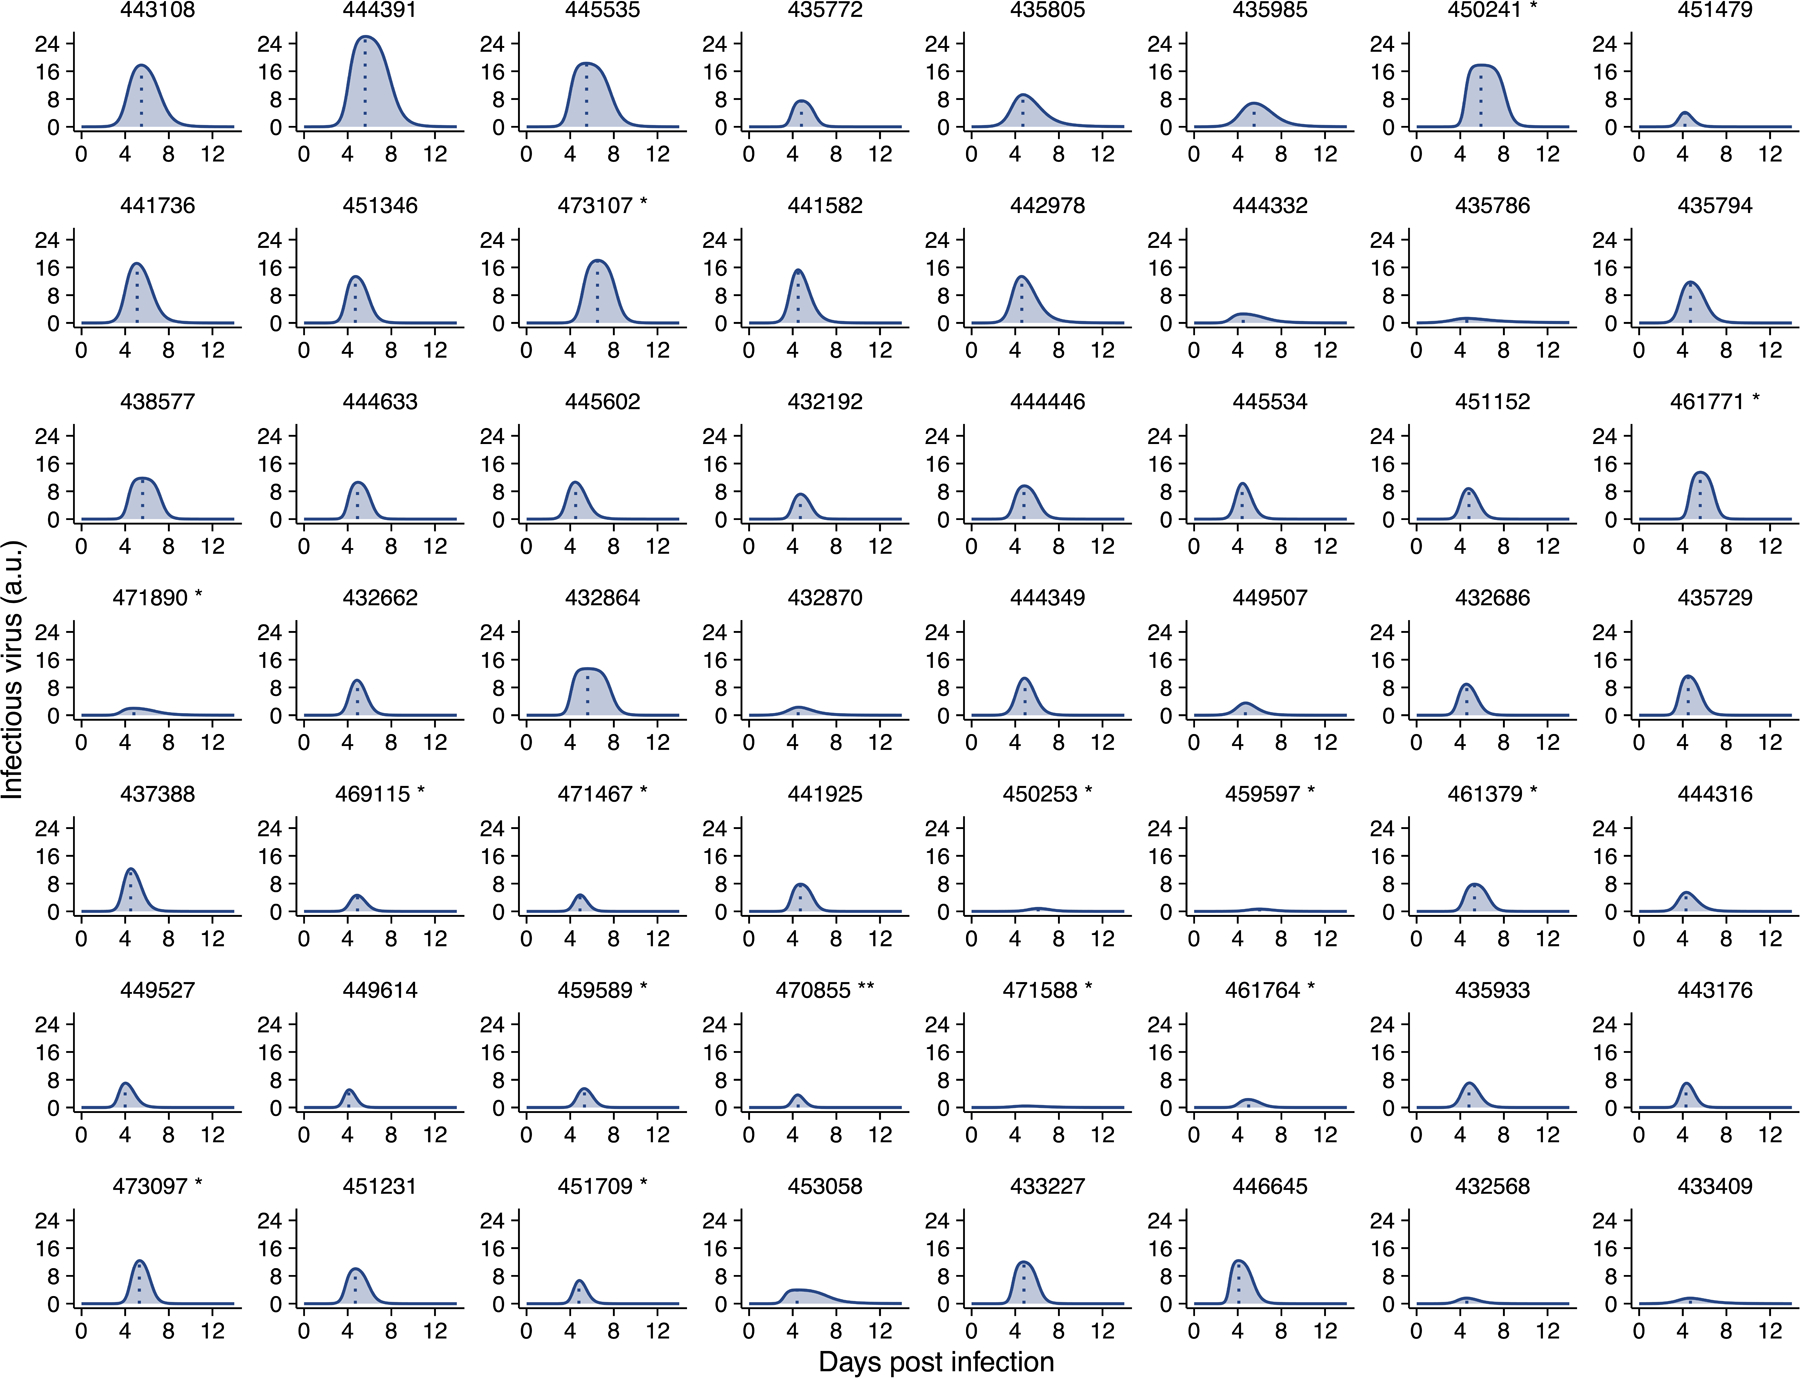
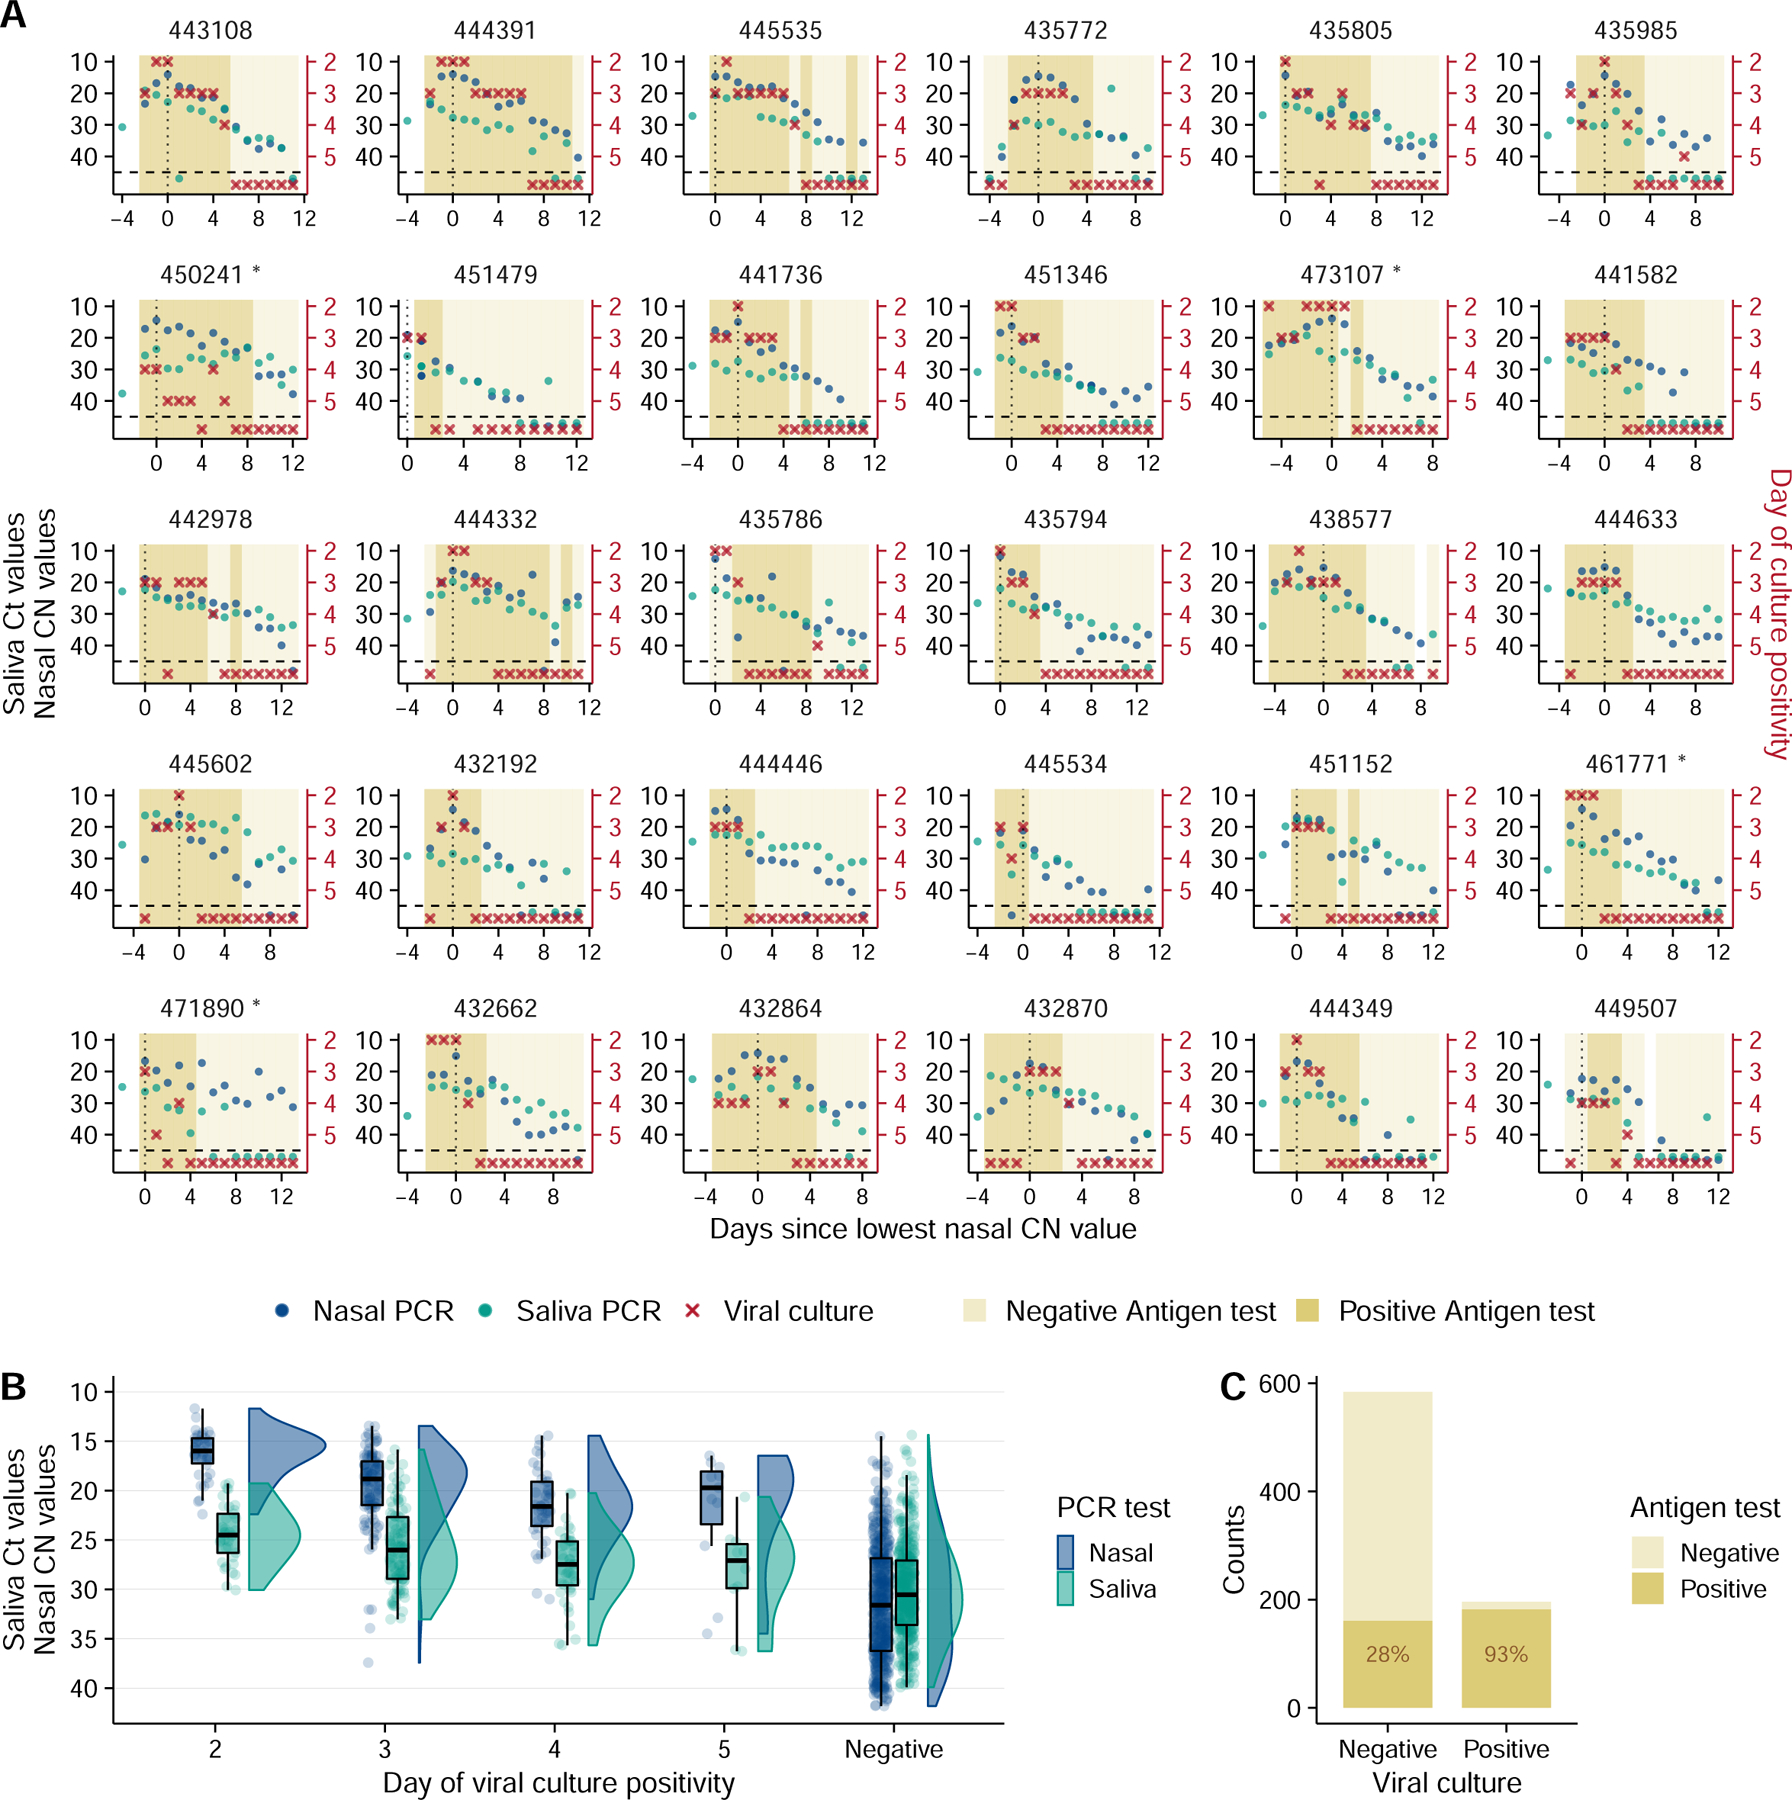
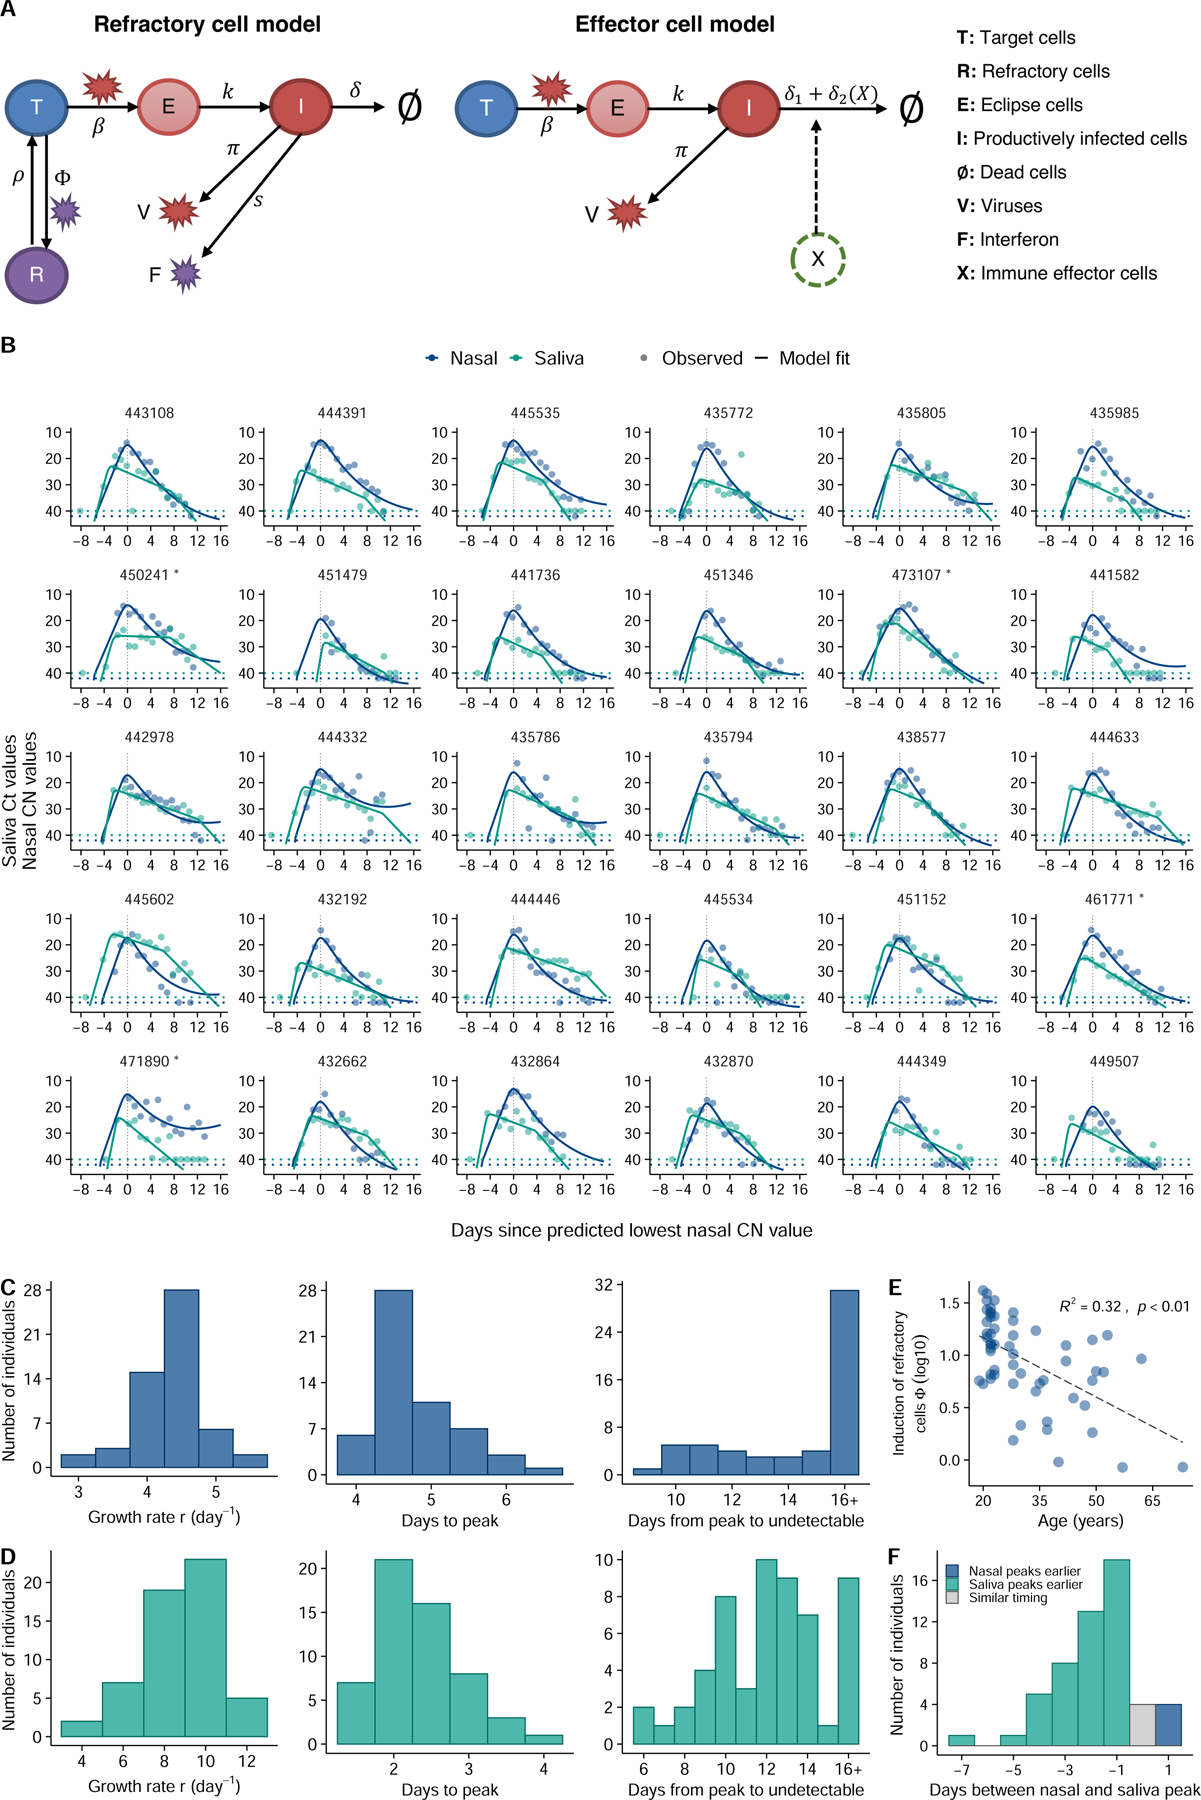
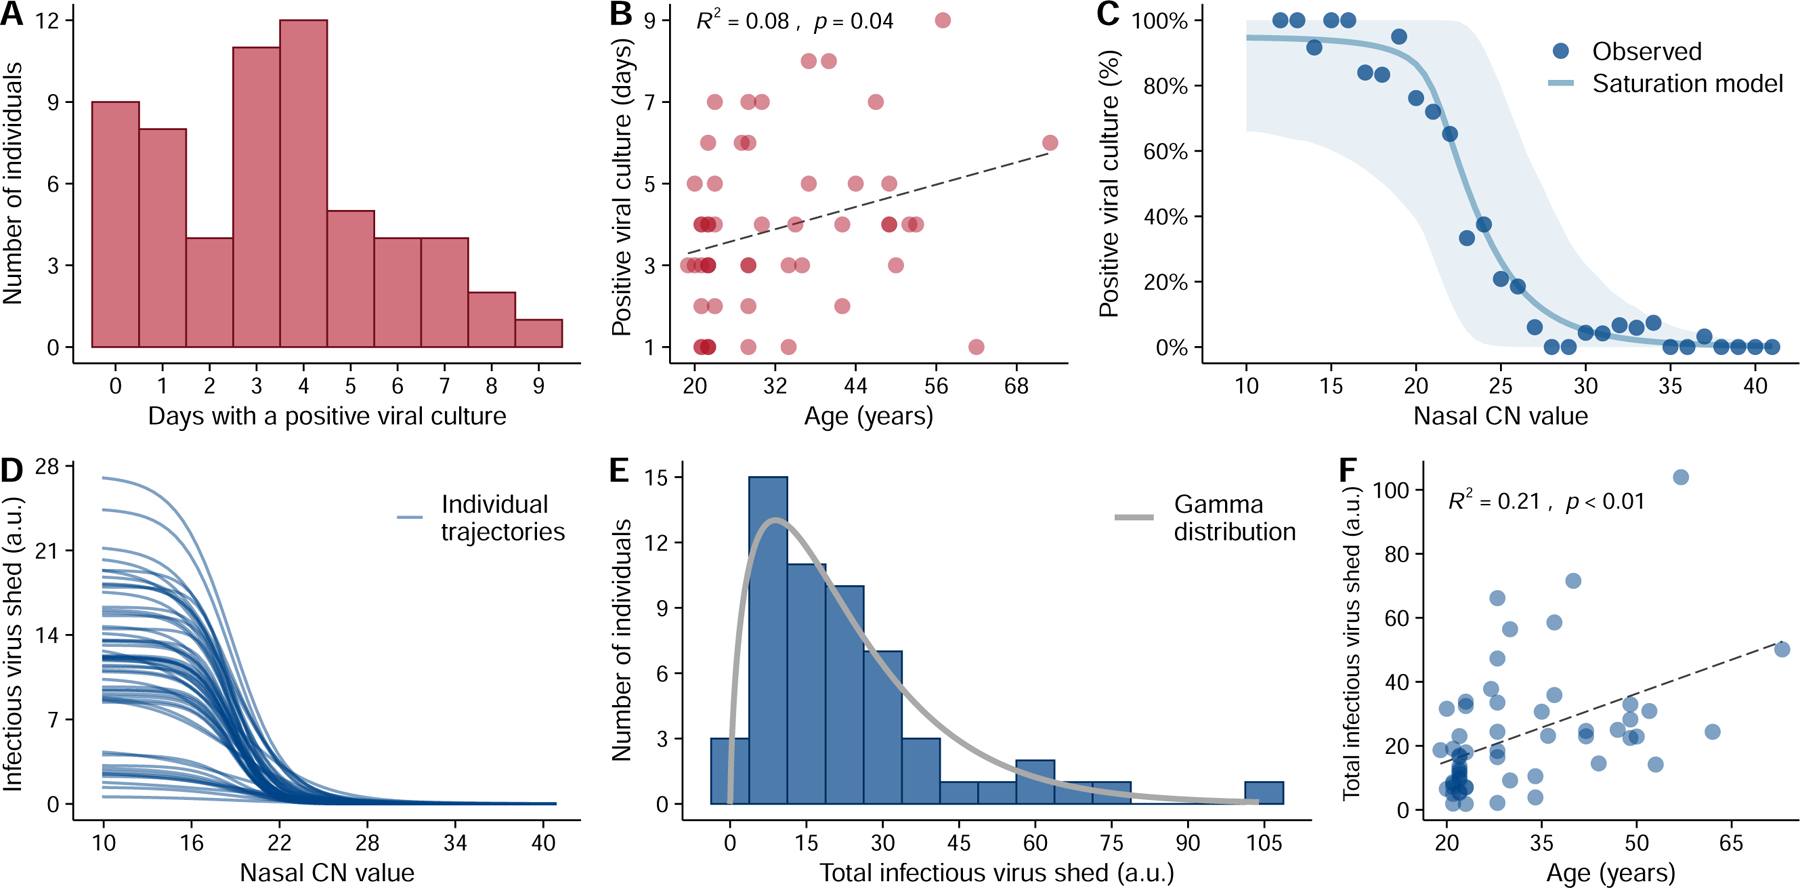
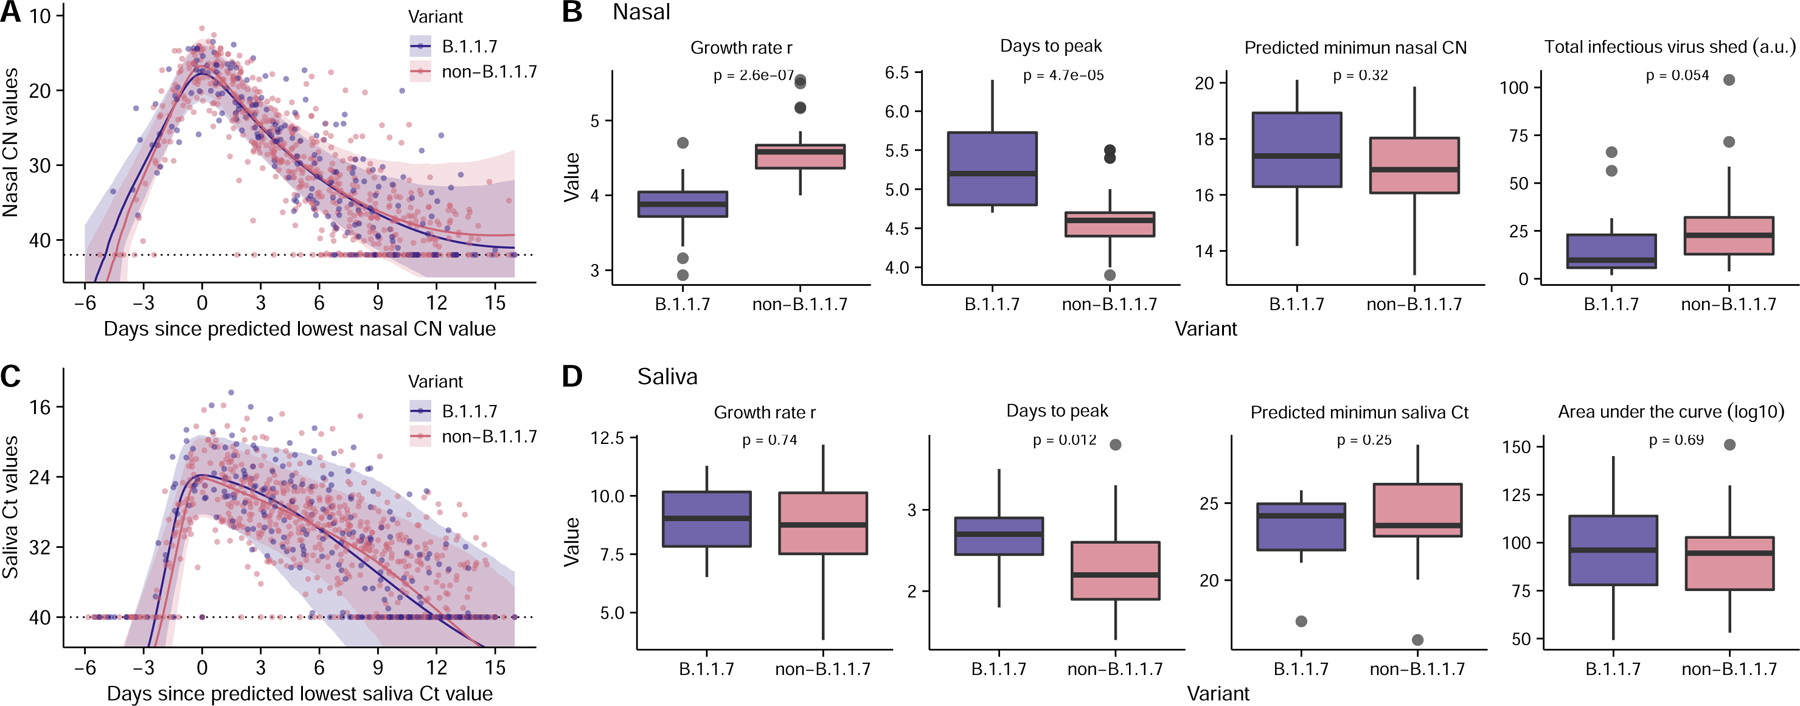
The dynamics of SARS-CoV-2 replication and shedding in humans remain poorly understood. We captured the dynamics of infectious virus and viral RNA shedding during acute infection through daily longitudinal sampling of 60 individuals for up to 14 days. By fitting mechanistic models, we directly estimated viral expansion and clearance rates and overall infectiousness for each individual. Significant person-to-person variation in infectious virus shedding suggests that individual-level heterogeneity in viral dynamics contributes to 'superspreading'. Viral genome loads often peaked days earlier in saliva than in nasal swabs, indicating strong tissue compartmentalization and suggesting that saliva may serve as a superior sampling site for early detection of infection. Viral loads and clearance kinetics of Alpha (B.1.1.7) and previously circulating non-variant-of-concern viruses were mostly indistinguishable, indicating that the enhanced transmissibility of this variant cannot be explained simply by higher viral loads or delayed clearance. These results provide a high-resolution portrait of SARS-CoV-2 infection dynamics and implicate individual-level heterogeneity in infectiousness in superspreading.


Conflict of interest statement

Competing interests. CBB and LW are listed as inventors on a patent application for the saliva RTqPCR test used in this study. The remaining authors declare no competing interests.

Figures

Extended Data Fig. 1
Extended Data Fig. 1. Remainder of individual plots.
Plots of longitudinal assay results from study participants not shown in Figure 1A. Single asterisk next to the participant ID indicates B.1.1.7 variant infection, while double asterisks indicate P1 variant infection.
Extended Data Fig. 2
Extended Data Fig. 2. Individual-level symptom data.
Self-reported symptom data from study participants, overlaid with viral culture status. Participants were asked to complete a survey through the Eureka digital study platform inquiring about the presence or absence of the indicated set of symptoms each day after sample collection.
Extended Data Fig. 3
Extended Data Fig. 3. Comparison of symptoms and viral culture status.
Plots show the proportions of either viral culture negative or viral culture positive days for which participants reported the indicated symptoms. The p-values for the Wilcoxon rank-sum test are reported. Data are only shown for individuals who reported the indicated symptom at least once.
Extended Data Fig. 4
Extended Data Fig. 4. Model structures.
Diagrams showing the structures of the additional three models (not shown in Figure 2A) considered for describing viral load data. See Supporting Text for descriptions of the models.
Extended Data Fig. 5
Extended Data Fig. 5. Model parameter estimates as a function of age.
Plots showing the relationship between age and the indicated model parameter estimates for (A) the refractory cell model (nasal data) and the (B) the immune effector cell model (saliva data). Linear regressions were performed on the data. R2 values and p-values are shown.
Extended Data Fig. 6
Extended Data Fig. 6. Analysis workflow.
Diagram indicating how empirical RTqPCR and viral culture data were used to generate estimations of individual level viral dynamics and infectiousness.
Extended Data Fig. 7
Extended Data Fig. 7. The saturation model accurately predicts the cell culture positivity data.
Lines denote the predicted probability of cell culture being positive. Dots denotes cell culture positivity data, where a dot is at 1 or 0 when the cell culture is positive or negative, respectively.
Extended Data Fig. 8
Extended Data Fig. 8. Individual infectiousness plots.
Estimated infectiousness over time plotted for individual study participants. Dashed lines indicate inferred peak in infectiousness.
Extended Data Fig. 9
Extended Data Fig. 9. The relationship between genome viral load (y-axis; on a log10 scale) and CN value of the nasal samples.
The black line, i.e. the center of the error band, represents the linear regression calibration curve. The shading around the black line shows the standard error for the regression.
Extended Data Fig. 10
Extended Data Fig. 10. The relationship between genome viral load (y-axis; on a log10 scale) and Ct value of the saliva samples.
The black line, i.e. the center of the error band, represents the linear regression calibration curve. The shading around the black line shows the standard error for the regression.
Figure 1:
Figure 1:. SARS-CoV-2 viral dynamics captured through daily sampling.
(A) Temporal trends for the saliva RTqPCR (teal dots), nasal swab RTqPCR (navy blue dots), nasal swab viral culture (red crosses), and positive nasal swab antigen test results (dark mustard shaded area). The left Y axis indicates Ct values for saliva RTqPCR assay (covidSHIELD) and CN values for nasal swab RTqPCR assay (Abbott Alinity). The right Y axis indicates results of viral culture assays, where day of culture positivity indicates the day of incubation at which > 50% of Vero-TMPRSS2 cells infected with the sample were positive for cytopathic effect. The vertical dotted line shows the day at which the lowest nasal CN value is observed. Horizontal dashed line indicates limit of detection of RTqPCR and viral culture assays. The title of each plot corresponds to the participant ID for the top 30 individuals with the most data points (the remaining 30 participants are shown in figure S1). Single and double asterisks next to the participant ID indicates B.1.1.7 and P.1 variants respectively. (B) Individual Ct (for saliva) and CN (for nasal swabs) values from samples plotted based on concurrent results from the viral culture assay. Negative indicates samples for which viral culture assay showed no viral growth after 5 days. The boxplot shows first and third quartiles (interquartile range IQR), where the horizontal line is the median value, and the whiskers are 1.5 times the IQR. (C) Plot showing antigen FIA results from days where participants tested either positive or negative by viral culture. The text inside the bars indicates the percentage of antigen FIA results that were positive when concurrent viral culture sample was positive or negative.
Figure 2:
Figure 2:. Model fits quantify heterogeneity in viral dynamics and discordance in genome shedding between nasal and saliva samples.
(A) Diagrams outlining structures of the refractory cell model and the immune effector cell model that best fit the nasal swab and saliva RTqPCR data, respectively. In the refractory cell model, target cells (T) are infected by viruses (V) at rate β. Infected cells first become eclipse cells (E) and do not produce viruses; at rate k, eclipse cells become productively infected cells (I) producing both viruses and interferon (F) at rate π and s, respectively. They die at rate δ. Binding of interferons with target cells induces an antiviral response that turns target cells into cells refractory to infection (R). The rate of induction of the antiviral response is Φ. Refractory cells can revert to target cells at rate ρ. In the effector cell model, we assume that over the course of infection, immune effector cells (X) that clear infected cells are activated and recruited. This leads to an increase in infected cell death rate from δ1 to δ1+δ2. (B) Model fits to nasal sample (navy blue) and saliva (teal) RTqPCR results from the same subset of individuals shown in figure 1A. Includes last recorded negative saliva RTqPCR result prior to study enrollment. Dotted lines represent the limit of detection (LoD) for the RTqPCR assays. Dots on the dotted lines denote measurements under the LoD. (C, D) Distributions of the exponential viral growth rates, days from infection to peak viral genome load, and days from peak to undetectable viral genome loads predicted by the refractory cell model (nasal data; panel C) and the immune effector model (saliva data; panel D) across 56 individuals in this cohort. (E) Association between age and the estimated strength of the antiviral immune response (Φ) based on nasal sample data. The Y axis is shown on a log 10 scale. Associations are examined using a standard linear regression analysis. The R-squared value and the p-value are reported. (F) Distribution of the differences in the estimated times of peak viral genome loads between the saliva and nasal samples. Bars colored teal and navy blue represent estimated saliva peaks that occur at least 0.5 day earlier and later than nasal samples, respectively. The gray bar indicates the number of individuals that have similar timing in the peaks.
Figure 3:
Figure 3:. Substantial heterogeneity in infectious virus shedding between individuals.
(A) The distribution in the numbers of days in which participants tested positive by viral culture on nasal swabs following study enrollment. (B) Association between age of study participants and the number of days of positive viral culture using a standard linear regression analysis. The R-squared value and the p-value are reported. (C) Relationship between the CN value in nasal samples and the probability of the sample being viral culture positive, summarized across all individuals. Individual samples were binned based on their CN values. Dots indicate the observed percentage of positive samples within a bin that were viral culture positive. The solid line and the shaded area are the mean and the 90% confidence intervals, respectively, of the trajectories generated using the best-fit parameters of the saturation model (see extended data Fig 7 for individual fits). (D) The relationship between infectious virus shed (in arbitrary units or a.u.) and CN values by the saturation model for 56 individuals in our analysis. (E) Distribution of the estimated total cumulative level of infectious virus (in arbitrary units) shed from the nasal passage by each participant over the course of infection. Solid line shows the best-fit gamma distribution with a shape parameter of 1.6. (F) Association between age and the estimated total infectious virus (in arbitrary units) shed by each individual. The R2 value and the p-value from a linear regression (dashed line) are shown in panels (B) and (F).
Figure 4:
Figure 4:. Comparison of viral dynamics between B.1.1.7 and non-B.1.1.7 viruses.
(A, C) Viral genome load of B.1.1.7 infections (purple) and non-B.1.1.7 infections (pink) over time in (A) nasal and (C) saliva samples, as measured by RTqPCR (Dots). Ribbons indicate 90% confidence intervals of predicted CN and Ct value trajectories respectively using population parameters estimated from modeling analysis (Table S4). (B, D) Comparison of estimated values for the indicated summary statistics of viral dynamics between individual B.1.1.7 and non-B.1.1.7 infections. (n=14 and 42 for B.1.1.7 and non-B.1.1.7 infections, respectively). The boxes of the boxplots start in the first quartile and ends in the third quartile of the data (e.g., interquartile range IQR), and the line inside the box represents the median. The whiskers represent 1.5 x the IQR, and the closed circles represent outliers. The p-values for the Wilcoxon rank-sum test are reported. Note that because age covaries with the total infectious virus shed (Fig. 3F), comparison of the total infectious virus shed after adjusting for age is shown in panel (B) (see Methods).

Update of

Similar articles

Cited by

References

    1. He X et al. Temporal dynamics in viral shedding and transmissibility of COVID-19. Nat Med 26, 672–675 (2020). - PubMed
    1. Ferretti L et al. The timing of COVID-19 transmission 10.1101/2020.09.04.20188516 (2020) doi:10.1101/2020.09.04.20188516. - DOI - DOI
    1. Szablewski CM et al. SARS-CoV-2 Transmission and Infection Among Attendees of an Overnight Camp — Georgia, June 2020. MMWR Morb. Mortal. Wkly. Rep 69, 1023–1025 (2020). - PMC - PubMed
    1. Long Q-X et al. Clinical and immunological assessment of asymptomatic SARS-CoV-2 infections. Nat Med 26, 1200–1204 (2020). - PubMed
    1. Li R et al. Substantial undocumented infection facilitates the rapid dissemination of novel coronavirus (SARS-CoV-2). Science 368, 489–493 (2020). - PMC - PubMed

Publication types

Supplementary concepts